900 N Taylor St #909 · Arlington, VA
Flood risk No data
- FEMA flood zone
- —
- Chance of flooding over 30 yrs
- —
- Est. flood insurance / yr
- —
Fire risk No data
- Est. fire insurance / yr
- —
Heat risk No data
- Hot days now (above threshold)
- —
- Hot days in 30 yrs
- —
Wind risk No data
- Chance of severe wind over 30 yrs
- —
Air-quality risk No data
- Unhealthy air days now
- —
- Unhealthy air days in 30 yrs
- —
Risk factors via First Street. Map © Google.
Why this score? — see what drove the B grade
The composite is a weighted blend of 9 inputs, each scored 0–100. Each bar is that input's sub-score; the figure is the points it added to the 100-point composite (weight × sub-score).
- Cash flow +28.7/30.0
- DSCR +10.0/10.0
- 1% rule +8.5/10.0
- ARV discount +7.5/15.0
- Schools +6.5/10.0
- Livability +4.3/5.0
- Rent growth +2.6/5.0
- Condition / age +2.5/5.0
- Appreciation +0.0/10.0
$175,000
🖨 Deal sheet 📄 Offer letter ✓ Due diligence
Listing remarks
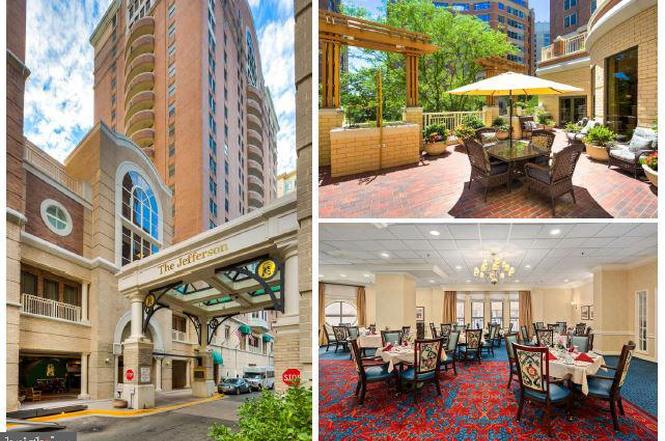
The Jefferson a Monogram Collection property from Sunrise Senior Living) was proudly voted "Best Senior Living Community" by Arlington Magazine readers in the "Best of Arlington" survey. The Jefferson, which is an independent and active senior community, is located in the heart of Arlington's Ballston neighborhood. When you arrive, you will feel like you have entered a luxury hotel. The Jefferson boasts in-house dining, housekeeping, transportation, pool/spa, fitness room, and other generous amenities in an urban setting with a walkability score of 97. The Jefferson is a 55+ community with a non-optional monthly fee that includes all amenities. The monthly fee for this u
Key facts
- Housekeeping
- In-house dining
- Transportation
Tags
Property features AI
Finance
- HOA & community: Monthly condo fee of $240; HOA covers water, sewer, trash, exterior building maintenance, common area maintenance and reserves; Building amenities include concierge, elevator, fitness center, exercise room, indoor pool, spa, community center, club house, dining rooms, game room, library, art studio, beauty salon, transportation service, newspaper service, recreational center and retirement community services
Exterior
- Parking: Underground parking garage; Approximately 300 garage spaces; Visitor parking available (garage)
- Utilities: Public water; Public sewer; Electric hot water
- Home design: Condominium unit (Unit/Flat); Hi-rise building (9+ floors); Entry floor: 9; Senior community (55+)
- Construction: Brick construction; Built year from assessor
- Exterior features: No basement; Above- and below-grade structures
Interior
- Bedrooms: One bedroom on main level
- Bathrooms: One full bathroom on main level; One full bathroom total
- Heating & cooling: Heat pump heating; Heat pump cooling; Electric heating and cooling
- Interior features: Elevator; Grab bars; Lever-handle doors; Doors 32"+ wide
- Laundry & utility: Washer/dryer hookup in unit; Electric hot water
Neighborhood map
What this means for you Summary
Snapshot
- This is a 1-bed/1.0-bath condo listed at $175k.
Deal economics
- At list price, monthly cash flow is $583 ($7k/yr) — positive.
- The deal already cash-flows at list — no discount required.
- Meets the 1% rule at list price ($2k rent vs $175k).
- Recommended offer: $154k (12.0% below list) — sets the bar for market timing.
- Cap rate 10.3% vs local median 1.7% in Arlington — top-decile yield for the area; either an underpriced asset or a hidden risk that comps aren't pricing in. Stress-test before assuming the spread holds.
Location & tenants
- Location reads 86/100 on livability (#14 in VA, #387 nationally) — a professional / high-income tenant draw. Strengths: schools A+, crime A+, amenities A+; Watch: cost of living F.
- Arlington County Public School District (urban): math 65% / reading 77% proficiency, ranked #8 of 131 in VA (top 6%) — strong family-tenant draw, lease renewals of 3-5y typical.
- Market conditions: Rents flat; 59 active listings in the ZIP; 40 comparable units currently listed for rent nearby; rentals at typical pace (median 15d on market — plan ~3-4 weeks tenant-placement turnaround); high-income renter base; 621 units permitted in Arlington County in 2024 (429 in 5+ unit buildings).
Forward outlook
- Local home prices are declining (-3.0%/yr); year-one equity from $1k of loan paydown is wiped out by about $5k of value loss. Plan a longer hold.
- Arlington County population projected at +44% by 2050 — long-run rental-demand tailwind backs the buy-and-hold thesis.
Negotiation context
- It's been on market 149 days — a 12% lower offer ($154k) is reasonable based on typical stale-listing flexibility.
- 11 sale attempts since 31y ago; this cycle's ask is 67% above the opening price — seller raised mid-cycle; expect resistance to lowballs.
- Current owner paid $78k; list at $175k implies a 124% gain — meaningful room to come down on a strong offer.
Questions for the listing agent
- It's been on market 149 days. Have you received any prior offers? Is the seller open to a 12% concession, seller financing, or rate buy-down credit?
- What does the HOA fee cover, when was the last increase, and are there any pending special assessments or reserve-fund shortfalls?
- Any open or pending special assessments — roof, HVAC, plumbing, elevator, façade? What's the per-unit balance and payoff schedule, and is the seller paying it off at close or rolling it to the buyer?
- Why hasn't it sold? Are there any deal-killer items the seller is aware of (foundation, flood, title, zoning, code violations)?
- Is there a deadline driving the sale (1031 exchange, divorce, estate, relocation)? That informs how much negotiation room exists.
- Schools are A-rated — typically a magnet for longer-tenancy family renters. What's the average tenant stay here, and is there a school-zone premium baked into asking?
- What's the average days-on-market for RENTAL listings here right now (not sales)? A rising rental-DOM trend means longer vacancies and softer asking-rent achievability than the comps imply.
- What's the recent tenant-quality profile in this submarket — average credit score on applications, eviction rate, late-payment / NSF rate, and stable-employment percentage? A property-management company in the area should have these aggregated.
- How much new apartment / multifamily construction is in the pipeline within 1–3 miles? Heavy new supply (>2% of stock underway) typically softens rents 12–24 months out; light construction supports rent growth.
Investment metrics
- 1% rule
- 1.35% ✓
- Cap rate
- 10.29%
- Cash-on-cash
- 14.29%
- DSCR
- 1.64
- GRM
- 6.2
CMA / ARV
No comps found within radius.
Projected returns pro-forma
-3.0% appreciation · 0.56% rent growth · sell at horizon
- IRR
- 1.8%
- Equity multiple
- 1.07×
- Total profit
- $3,209
- Equity at exit
- $26,093
- IRR
- 8.7%
- Equity multiple
- 1.59×
- Total profit
- $28,822
- Equity at exit
- $15,131
Cash invested: $49,000 (down + closing). Projections, not guarantees.
Landlord ↔ Tenant lean methodology
- Overall (STATE)
- 55 Moderately Landlord-Leaning
- State Virginia
- 55 Moderately Landlord-Leaning · D+2
- County
- — inherits STATE
- City
- — inherits STATE
ZIP-level market 22203
- Rents YoY
- 0.6%
- Active inventory
- 59
- Price-to-rent
- 6.2×
Monthly cashflow live
- Estimated rent
- $2,364 high interval (Pro) →
- Mortgage (P&I)
- −$918
- Tax from tax record
- −$54 /mo · $647/yr
- Insurance
- −$73
- HOA
- −$240
- Vacancy / Maint / Mgmt
- −$497
- Net cashflow
- $583
Break-even live
UW: 25.0% down · 7.5% · 30yr · 1.5% tax · 5.0% vac · 8.0% maint · 8.0% mgmt
Financing live
Cash to close
- Down payment
- $43,750
- Closing costs
- $5,250
- Reserves months
- —
- Total cash needed
- —
Loan-product check · same deal, 3 products live
Conventional
25% down · 7.5% · 30yr
- Down + closing
- —
- Monthly P&I
- —
- Monthly cashflow
- —
- DSCR
- —
- Eligible?
- —
Personal DTI + credit; lowest rate.
DSCR
20% down · 8.5% · 30yr
- Down + closing
- —
- Monthly P&I
- —
- Monthly cashflow
- —
- DSCR
- —
- Eligible?
- —
No personal income docs; deal must DSCR.
Hard money
10% down · 12.0% · 12mo
- Down + closing
- —
- Monthly P&I
- —
- Monthly cashflow
- —
- DSCR
- —
- Eligible?
- —
Short-term bridge; refi at stabilization.
Rent comps 40 comps
| Address | Beds | Baths | Sqft | Rent | $/sqft | DOM | Units | Dist |
|---|---|---|---|---|---|---|---|---|
| 900 N Taylor St #1510 Arlington, VA | 1.0 | 1.0 | 686 | $5,854 | $8.53 | 43d | 1 | 0.02mi |
| 851 N Glebe Rd #1812 Arlington, VA | — | 1.0 | 550 | $2,000 | $3.64 | 22d | 1 | 0.07mi |
| 850 N Randolph St Arlington, VA | 1.0–2.0 | 1.0–2.0 | 807 | $2,401 | $2.97 | 2d | 1 | 0.15mi |
| 1050 N Stuart St Arlington, VA | 1.0 | 1.0 | 748 | $1,450 | $1.94 | 14d | 1 | 0.18mi |
| 1020 N Stafford St Arlington, VA | 1.0 | 1.0 | 683 | $2,350 | $3.44 | 4d | 1 | 0.18mi |
| 672 N Glebe Rd Arlington, VA | 1.0–2.0 | 1.0–2.0 | 943 | $2,793 | $2.96 | 1d | 7 | 0.18mi |
| 1020 N Stafford St Arlington, VA | 1.0 | 1.0 | 605 | $2,375 | $3.92 | 7d | 2 | 0.19mi |
| 700 N Randolph St Arlington, VA | 2.0 | 1.0–2.0 | 782 | $3,454 | $4.41 | 2d | 23 | 0.22mi |
| 4040 Wilson Blvd Arlington, VA | 2.0 | 1.0–2.0 | 759 | $3,614 | $4.76 | 2d | 15 | 0.25mi |
| 4200 N Carlin Springs Rd Arlington, VA | 2.0 | 1.0–2.0 | 771 | $2,875 | $3.73 | 2d | 20 | 0.25mi |
| 624 N Glebe Rd Arlington, VA | 2.0 | 1.0–2.0 | 888 | $3,656 | $4.11 | 2d | 22 | 0.27mi |
| 888 N Quincy St #908 Arlington, VA | 1.0 | 1.0 | 684 | $2,500 | $3.65 | 22d | 1 | 0.27mi |
| 818 N Quincy St Arlington, VA | 1.0–2.0 | 1.0–2.0 | 938 | $2,629 | $2.80 | 1d | 21 | 0.29mi |
| 4000 Wilson Blvd Arlington, VA | 2.0 | 1.0–2.0 | 874 | $3,495 | $4.00 | 2d | 16 | 0.29mi |
| 4206 Washington Blvd Unit 3 Arlington, VA | 1.0 | 1.0 | 575 | $2,200 | $3.83 | 43d | 1 | 0.31mi |
| 4510 Washington Blvd Unit B1 Arlington, VA | — | 1.0 | 650 | $1,550 | $2.38 | 7d | 1 | 0.33mi |
| 820 N Pollard St Arlington, VA | 1.0 | 1.0 | 724 | $2,575 | $3.55 | 14d | 1 | 0.34mi |
| 4650 Washington Blvd Arlington, VA | 2.0 | 1.0–2.0 | 847 | $2,855 | $3.37 | 2d | 1 | 0.36mi |
| 901 N Pollard St Arlington, VA | 1.0–3.0 | 1.0–2.0 | 1057 | $2,380 | $2.25 | 3d | 17 | 0.37mi |
| 4141 N Henderson Rd Arlington, VA | 1.0 | 1.0 | 734 | $2,175 | $2.96 | 43d | 2 | 0.41mi |
| 4141 N Henderson Rd Arlington, VA | 1.0 | 1.0 | 732 | $3,200 | $4.37 | 15d | 2 | 0.41mi |
| 3800 Fairfax Dr #1801 Arlington, VA | 1.0 | 1.0 | 550 | $2,200 | $4.00 | 43d | 1 | 0.43mi |
| 3601 Fairfax Dr Arlington, VA | 1.0–2.0 | 1.0–2.0 | 857 | $2,471 | $2.88 | 2d | 24 | 0.51mi |
| 726 N Nelson St Arlington, VA | 1.0 | 1.0 | 650 | $2,100 | $3.23 | 24d | 1 | 0.52mi |
| 901 N Nelson St Arlington, VA | 1.0–2.0 | 1.0–2.0 | 953 | $2,637 | $2.77 | 1d | 19 | 0.53mi |
| 3515 Washington Blvd #406 Arlington, VA | — | 1.0 | 400 | $1,750 | $4.38 | 15d | 1 | 0.57mi |
| 712 N Monroe St Apt 4 Arlington, VA | 1.0 | 1.0 | 500 | $1,850 | $3.70 | 43d | 1 | 0.58mi |
| 704 N Monroe St Unit 3 Arlington, VA | 1.0 | 1.0 | 450 | $1,850 | $4.11 | 43d | 1 | 0.58mi |
| 700 N Monroe St Arlington, VA | 1.0 | 1.0 | 450 | $1,850 | $4.11 | 43d | 1 | 0.59mi |
| 235 N George Mason Dr Unit 4 Arlington, VA | 1.0 | 1.0 | 699 | $1,950 | $2.79 | 43d | 1 | 0.71mi |
| 235 N George Mason Dr Unit 235-4 Arlington, VA | 1.0 | 1.0 | 699 | $1,900 | $2.72 | 43d | 1 | 0.71mi |
| 250 N Thomas St Arlington, VA | 1.0 | 1.0 | 666 | $950 | $1.43 | 43d | 1 | 0.71mi |
| 229 N George Mason Dr Arlington, VA | 1.0 | 1.0 | 666 | $1,150 | $1.73 | 43d | 1 | 0.72mi |
| 230 N George Mason Dr Unit 230-4 Arlington, VA | 1.0 | 1.0 | 651 | $1,850 | $2.84 | 43d | 1 | 0.72mi |
| 4378 N Pershing Dr #43784 Arlington, VA | 1.0 | 1.0 | 651 | $1,675 | $2.57 | 43d | 1 | 0.74mi |
| 214 N George Mason Dr Arlington, VA | 1.0 | 1.0 | 651 | $1,550 | $2.38 | 7d | 1 | 0.76mi |
| 201 N Trenton St #1 Arlington, VA | 1.0 | 1.0 | 670 | $2,200 | $3.28 | 7d | 1 | 0.80mi |
| 206 N Trenton St Unit 206-2 Arlington, VA | 1.0 | 1.0 | 699 | $1,750 | $2.50 | 24d | 1 | 0.80mi |
| 104 N George Mason Dr Unit 104-2 Arlington, VA | 1.0 | 1.0 | 651 | $1,750 | $2.69 | 43d | 1 | 0.83mi |
| 4111 18th Rd N #1 Arlington, VA | — | 1.0 | 700 | $2,100 | $3.00 | 7d | 1 | 0.88mi |
HOA detail condo
- Monthly dues
- $240 · $2,880/yr
- Likely covers
- pool
- Assessments
- None detected in remarks — confirm with the listing agent.
Listing history 50 events
-
2026-06-18days on market $175,000 Active 149 DOM
-
2026-06-17days on market $175,000 Active 148 DOM
-
2026-06-16days on market $175,000 Active 147 DOM
-
2026-06-15days on market $175,000 Active 146 DOM
-
2026-06-13days on market $175,000 Active 144 DOM
-
2026-06-09days on market $175,000 Active 140 DOM
-
2026-06-08days on market $175,000 Active 139 DOM
-
2026-06-07days on market $175,000 Active 138 DOM
-
2026-06-03days on market $175,000 Active 134 DOM
-
2026-06-02days on market $175,000 Active 133 DOM
-
2026-06-01days on market $175,000 Active 132 DOM
-
2026-05-31days on market $175,000 Active 131 DOM
-
2026-05-19price $175,000
-
2026-05-19status Active
-
2026-01-28historical
-
2025-10-01$105,000 Active
-
2025-08-07historical
-
2025-03-25$65,000 Active
-
2024-06-26historical $4,901
-
2024-06-26$4,901
-
2022-10-04historical
-
2022-07-07$95,000 Active
-
2019-07-02soldstatus $78,000
-
2019-07-01soldstatus $78,000 Closed
-
2019-06-21status Pending
-
2019-03-13price $79,900
-
2019-02-17price $99,000
-
2018-12-31$112,000 Active
-
2018-03-16historical Withdrawn
-
2018-03-13Active
-
2013-01-10soldstatus $75,000
-
2013-01-08soldstatus $75,000
-
2013-01-08soldstatus $75,000
-
2012-11-15historical
-
2012-11-15$75,000
-
2010-08-31soldstatus $125,000
-
2008-10-08soldstatus $133,100
-
2008-01-01historical
-
2007-10-18price
-
2006-11-13
-
2003-06-17soldstatus $115,000
-
2003-06-16soldstatus $115,000
-
2003-03-24historical
-
2002-04-29$119,900
-
1995-09-07soldstatus $132,500
-
1995-08-31soldstatus $132,500
-
1995-08-04historical
-
1995-08-01soldstatus $132,500
-
1995-06-26$135,000
-
1993-07-26soldstatus $123,700
ⓘ Source: listings_history table (triggers on properties + properties_extension) + one-shot
backfill from property_details.listing_events for pre-trigger history.
Tax reassessment forecast VA · Resets to sale price
- Current annual tax
- $647 · $54/mo
- Projected year-2 tax
- $1,435 · $120/mo
- Expected delta
- +$788/yr (+$66/mo · 121.9%)
ⓘ Screening estimate from a state-policy table — verify with the county assessor before closing.
Nearby sold comps map
Loading sold comps map…
Walkable amenities ~0.75 mi
Loading nearby amenities…
Taxation est. · year 1
- Rental income
- $28,372
- − Mortgage interest
- −$9,803
- − Property taxes
- −$647
- − Insurance
- −$875
- − Repairs & maintenance
- −$2,270
- − Management
- −$2,270
- − HOA
- −$2,880
- − Depreciation
- −$5,091
- Taxable income
- $4,537
- Est. tax owed @ 24.0%
- −$1,089
- After-tax cash flow
- $5,911/yr
For passive investors: Depreciation is non-cash, so a rental often shows a tax loss while cash-flowing — sheltering income. Rental losses are passive: they offset passive income freely, and up to $25,000/yr can offset ordinary (W-2) income if you actively participate and your MAGI is under $100k (phasing out to $0 by $150k); unused losses carry forward. On sale, claimed depreciation is recaptured at up to 25%, and gains may owe capital-gains tax (a 1031 exchange can defer both). Figures are a year-1 estimate at your 24.0% rate — not tax advice; consult a CPA.
Schools (NCES district)
- District
- Arlington County Public School District
- NCES district ID
- 5100270
- Math proficiency
- 65% ▼ -22.00%
- Reading proficiency
- 77% ▼ -6.00%
- Median HH income
- $103,164
- Composite
- 65.23/100
- National rank
- #492
- State rank
- #8 of 131 in VA
Livability — Arlington
- Score
- 86/100
- State rank
- #14
- US rank
- #387
Category grades
Schools grade is shown separately in the Schools card above.
Census & demographics
- Census place
- Arlington, VA
- County
- Arlington County · 236,086 people
- City population
- 236,086
- Metro
- Washington-Arlington-Alexandria, DC-VA-MD-WV
- Population (ZIP)
- 26,594
- Household income
- $140,135
- Rent vs Own
- Severe rent burden
- 1847.0
Population outlook (Arlington County) Hauer SSP2
- Today (2025)
- 278,021 people
- By 2030
- 301,560 · +8.5%
- By 2040
- 349,063 · +25.6%
- By 2050
- 399,147 · +43.6%
- By 2075
- 505,325 · +81.8%
- By 2100
- 584,095 · +110.1%
Race, ethnicity, and origin ACS 2023
- Neighborhood character
- Diverse neighborhood (Simpson 0.62)
- Race & ethnicity
- White 57% Hispanic / Latino 16% Asian 12% Two or more races 10% Black 8%
- Hispanic origin (detail)
- Mexican 1% Puerto Rican 1%
- Common ancestry
- Romanian 3% Italian 2% Slovak 2%
- Foreign-born
- 23% · Canada, China, South Korea
- Languages at home
- 71% English-only · Spanish 11% Other Indo-European 5% Other Asian/Pacific 3%
Political lean MEDSL · Arlington
- 2024 margin
- Solid D (+58.6) · D 78.2% · R 19.6% · Other 2.1%
- 2008→2024 swing
- +14.0pp toward D · 2008: 44.6pp · 2024: 58.6pp
- All cycles
- 2024: D+58.6 2020: D+63.5 2016: D+60.1 2012: D+39.9 2008: D+44.6
Not yet ingested
- Civics
- —
Market trends
- HPI YoY
- ▼ -474.57%
- Current HPI
- 284.9956
- Rent YoY
- ▲ 0.56%
- Metro
- Washington-Arlington-Alexandria, DC-VA-MD-WV
- State GDP YoY
- ▲ 2.40%
- F500 in state
- 50
Industry mix (Fortune 500 HQ in VA)
| Industry | F500 HQs | Revenue |
|---|---|---|
| Aerospace / Defense | 4 | $236B |
|
||
| Technology / Defense | 3 | $32B |
|
||
| Financial Services | 2 | $176B |
|
||
| Utilities | 2 | $27B |
|
||
| Insurance | 2 | $25B |
|
||
| Technology | 2 | $15B |
|
||
Price history
+41.5% since first listed38 events — show timeline
- 2026-05-19 Price Changed $175,000 BRIGHT MLS
- 2026-05-19 Relisted — BRIGHT MLS
- 2026-01-28 Listing Removed — BRIGHT MLS
- 2025-10-01 Listed $105,000 BRIGHT MLS
- 2025-08-07 Listing Removed — BRIGHT MLS
- 2025-03-25 Listed $65,000 BRIGHT MLS
- 2024-06-26 Rental Removed $4,901 BRIGHTMLS
- 2024-06-26 Listed for Rent $4,901 BRIGHTMLS
- 2022-10-04 Listing Removed — BRIGHT MLS
- 2022-07-07 Listed $95,000 BRIGHT MLS
- 2019-07-02 Sold (Public Records) $78,000 Public Records
- 2019-07-01 Sold (MLS) $78,000 BRIGHT MLS
- 2019-06-21 Pending — BRIGHT MLS
- 2019-03-13 Price Changed $79,900 BRIGHT MLS
- 2019-02-17 Price Changed $99,000 BRIGHT MLS
- 2018-12-31 Listed $112,000 BRIGHT MLS
- 2018-03-16 Delisted — MRIS
- 2018-03-13 Listed — MRIS
- 2013-01-10 Sold (Public Records) $75,000 Public Records
- 2013-01-08 Sold (MLS) $75,000 MRIS
- 2013-01-08 Sold (MLS) $75,000 BRIGHT MLS
- 2012-11-15 Listed $75,000 MRIS
- 2012-11-15 Delisted — MRIS
- 2010-08-31 Sold (Public Records) $125,000 Public Records
- 2008-10-08 Sold (Public Records) $133,100 Public Records
- 2008-01-01 Delisted — MRIS
- 2007-10-18 Price Changed — MRIS
- 2006-11-13 Listed — MRIS
- 2003-06-17 Sold (Public Records) $115,000 Public Records
- 2003-06-16 Sold (MLS) $115,000 MRIS
- 2003-03-24 Delisted — MRIS
- 2002-04-29 Listed $119,900 MRIS
- 1995-09-07 Sold (Public Records) $132,500 Public Records
- 1995-08-31 Sold (MLS) $132,500 MRIS
- 1995-08-04 Delisted — MRIS
- 1995-08-01 Sold (Public Records) $132,500 Public Records
- 1995-06-26 Listed $135,000 MRIS
- 1993-07-26 Sold (Public Records) $123,700 Public Records
Property tax history
-3.2%/yrLatest (2025): $647 · +0.6% YoY. Source: county tax records.
Cash-flow waterfall
monthlySold comps — $/sqft
last 12 mo · ≤1 miLoading sold comps…