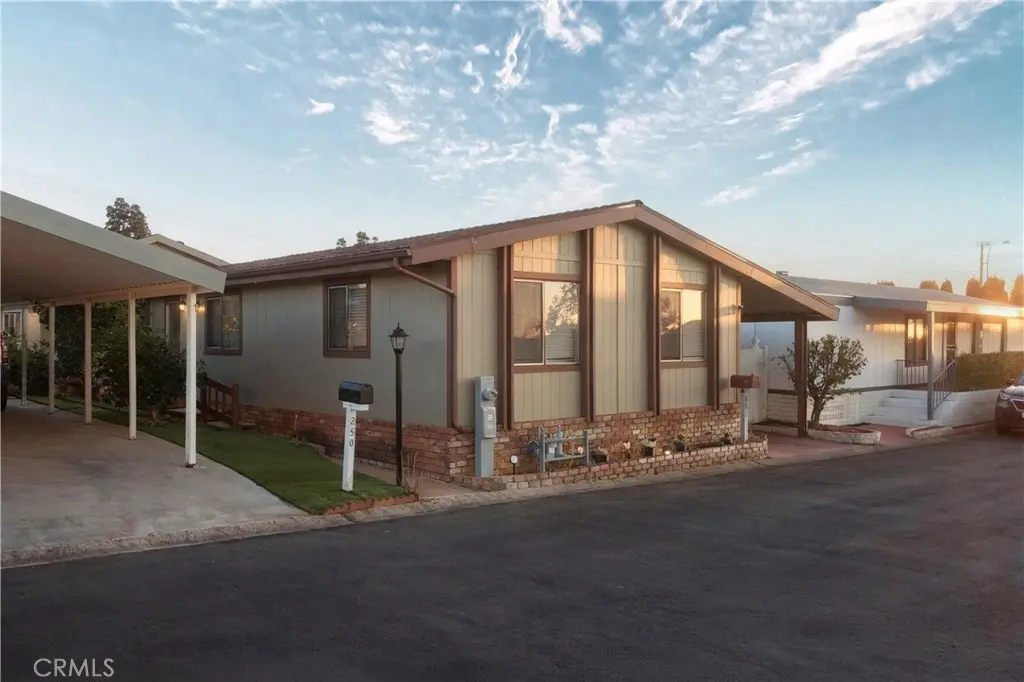
1051 Site #251 · Brea, CA
Flood risk 1/10 · Minimal
- FEMA flood zone
- X (unshaded)
- Chance of flooding over 30 yrs
- 0.0%
- Est. flood insurance / yr
- $507 – $1,088
Fire risk 5/10 · Moderate
- Est. fire insurance / yr
- $659 – $1,223
Heat risk 6/10 · Moderate
- Hot days now (above 96°F)
- 7 days/yr
- Hot days in 30 yrs
- 22 days/yr
Wind risk 1/10 · Minimal
- Chance of severe wind over 30 yrs
- —
Air-quality risk 5/10 · Moderate
- Unhealthy air days now
- 7 days/yr
- Unhealthy air days in 30 yrs
- 9 days/yr
Risk factors via First Street. Map © Google.
Why this score? — see what drove the B grade
The composite is a weighted blend of 9 inputs, each scored 0–100. Each bar is that input's sub-score; the figure is the points it added to the 100-point composite (weight × sub-score).
- Cash flow +30.0/30.0
- 1% rule +10.0/10.0
- DSCR +10.0/10.0
- ARV discount +8.5/15.0
- Schools +5.1/10.0
- Livability +3.8/5.0
- Rent growth +2.9/5.0
- Condition / age +2.5/5.0
- Appreciation +0.0/10.0
$199,900
🖨 Deal sheet 📄 Offer letter ✓ Due diligence
Listing remarks MLS
This charming 3-bedroom, 2-bath home offers approximately 1,300 square feet of comfortable living space designed for both relaxation and everyday convenience. Step inside to an inviting open layout that seamlessly connects the bright living room, dining area, and well-equipped kitchen, creating a perfect setting for gatherings or quiet evenings at home. The spacious primary suite features its own recently remodeled private bath, while the additional bedrooms offer versatility for guests, a home office, or a growing household. Large windows fill the interior with natural light, enhancing the home’s warm and welcoming feel. Outside, you’ll find room to unwind, garden, or simply enjoy the peaceful surroundings. Located in a well-maintained community close to shopping, dining, parks, and major conveniences, this residence delivers comfort, value, and an easy Southern California lifestyle.
Key facts
- 32.47 acre lot
- Built 1983
- Listed 21 days
Neighborhood map
What this means for you Summary
Snapshot
- This is a 3-bed/2.0-bath manufactured listed at $200k.
Deal economics
- At list price, monthly cash flow is $1k ($15k/yr) — positive.
- The deal already cash-flows at list — no discount required.
- Meets the 1% rule at list price ($3k rent vs $200k).
- Recommended offer: $197k (1.5% below list) — sets the bar for market timing.
- Cap rate 13.9% vs local median 2.1% in Brea — top-decile yield for the area; either an underpriced asset or a hidden risk that comps aren't pricing in. Stress-test before assuming the spread holds.
Location & tenants
- Location reads 76/100 on livability (#100 in CA, #3,570 nationally) — a middle-class / working-renter tenant base. Strengths: amenities A+, employment A+, schools A-; Watch: health & safety C-, cost of living F.
- Brea-Olinda Unified (suburban): math 48% / reading 65% proficiency, ranked #84 of 517 in CA (top 16%) — acceptable for families but not a draw, mixed tenant base, ~2y average lease.
- Market conditions: Rents rising (+1.8%/yr); 63 active listings in the ZIP; 24 comparable units currently listed for rent nearby; rentals leasing fast (median 10d on market — plan ~1-2 weeks tenant-placement turnaround); high-income renter base; 6,974 units permitted in Orange County in 2024 (3,839 in 5+ unit buildings).
- This rent runs 32% of the median local income ($124k/yr) — at the standard rent-burdened threshold; future hikes will face affordability resistance.
Forward outlook
- Local home prices are declining (-3.0%/yr); year-one equity from $1k of loan paydown is wiped out by about $6k of value loss. Plan a longer hold.
- Orange County population projected at +14% by 2050 — modest demand growth; plan on rents tracking national, not racing it.
- At projected returns (-3.0% appreciation + 1.8% rent growth), your $56k cash investment doubles in ~5 years — after that, you're playing with house money.
Negotiation context
- It's been on market 21 days — a 2% lower offer ($197k) is reasonable based on typical stale-listing flexibility.
Risks & watch-outs
- Climate carrying-cost: moderate wildfire risk; extreme-heat days projected 7→22/yr by 2055 (HVAC capex compounding) — expect insurance premiums to compound above CPI over the hold.
Questions for the listing agent
- Is there a deadline driving the sale (1031 exchange, divorce, estate, relocation)? That informs how much negotiation room exists.
- Schools are A-rated — typically a magnet for longer-tenancy family renters. What's the average tenant stay here, and is there a school-zone premium baked into asking?
- What's the average days-on-market for RENTAL listings here right now (not sales)? A rising rental-DOM trend means longer vacancies and softer asking-rent achievability than the comps imply.
- What's the recent tenant-quality profile in this submarket — average credit score on applications, eviction rate, late-payment / NSF rate, and stable-employment percentage? A property-management company in the area should have these aggregated.
- How much new for-sale + rental construction is in the pipeline within 1–3 miles? Heavy new supply typically softens prices + rents 12–24 months out; constrained supply supports both.
Investment metrics
- 1% rule
- 1.67% ✓
- Cap rate
- 13.87%
- Cash-on-cash
- 27.08%
- DSCR
- 2.20
- GRM
- 5.0
CMA / ARV
- ARV (median comp)
- $204,593
- List price
- $199,900
- Delta
- 2.15%
- Verdict
- FAIR
- Comps
- 20 within 1.0 mi
Show comp detail 12 sales within ~0.75 mi
| Address | Dist | Beds/Ba | Sqft | Sold | Price | $/sf | Match |
|---|---|---|---|---|---|---|---|
| 1051 Site Dr #25 | 0.00mi | 3/2.0 | 1,344 (+3%) | 0mo | $185,000 | $138 | 94 |
| 1051 Site Dr #203 | 0.00mi | 3/2.0 | 1,344 (+3%) | 10mo | $240,000 | $179 | 86 |
| 1051 Site Dr #89 | 0.00mi | 3/2.0 | 1,400 (+8%) | 4mo | $300,000 | $214 | 84 |
| 1051 Site #197 | 0.00mi | 3/2.0 | 1,120 (-14%) | 1mo | $179,000 | $160 | 76 |
| 1051 Site Dr #169 | 0.00mi | 2/2.0 (-1) | 1,368 (+5%) | 18mo | $109,888 | $80 | 71 |
| 1051 Site Dr #37 | 0.00mi | 3/2.0 | 1,440 (+11%) | 15mo | $160,000 | $111 | 70 |
| 1051 Site Dr #154 | 0.00mi | 2/2.0 (-1) | 1,440 (+11%) | 10mo | $210,000 | $146 | 69 |
| 1051 Site Dr #133 | 0.00mi | 2/2.0 (-1) | 1,440 (+11%) | 11mo | $157,000 | $109 | 68 |
| 1051 Site Dr #142 | 0.00mi | 2/2.0 (-1) | 1,440 (+11%) | 17mo | $179,000 | $124 | 62 |
| 1261 Glen Lake Ave #279 | 0.71mi | 2/2.0 (-1) | 1,296 (-0%) | 6mo | $149,000 | $115 | 56 |
| 726 Knoll Lake Dr #264 | 0.71mi | 2/2.0 (-1) | 1,296 (-0%) | 8mo | $210,000 | $162 | 55 |
| 1241 Glen Lake Ave #277 | 0.71mi | 2/2.0 (-1) | 1,200 (-8%) | 9mo | $190,000 | $158 | 41 |
Match score weights: distance 35% · size 25% · config 20% · recency 20%. Top-matched comps best support the ARV.
Projected returns pro-forma
-3.0% appreciation · 1.78% rent growth · sell at horizon
- IRR
- 19.6%
- Equity multiple
- 1.79×
- Total profit
- $44,034
- Equity at exit
- $29,806
- IRR
- 27.1%
- Equity multiple
- 3.25×
- Total profit
- $125,868
- Equity at exit
- $17,284
Cash invested: $55,972 (down + closing). Projections, not guarantees.
Landlord ↔ Tenant lean methodology
- Overall (STATE)
- 18 Strongly Tenant-Friendly
- State California
- 18 Strongly Tenant-Friendly · D+13
- County
- — inherits STATE
- City
- — inherits STATE
ZIP-level market 92821
- Rents YoY
- 1.8%
- Active inventory
- 63
- Price-to-rent
- 5.0×
Monthly cashflow live
- Estimated rent
- $3,347 high interval (Pro) →
- Mortgage (P&I)
- −$1,048
- Tax est. 1.5%
- −$250 /mo · $2,998/yr
- Insurance
- −$83
- HOA
- −$0
- Vacancy / Maint / Mgmt
- −$703
- Net cashflow
- $1,263
Break-even live
UW: 25.0% down · 7.5% · 30yr · 1.5% tax · 5.0% vac · 8.0% maint · 8.0% mgmt
Financing live
Cash to close
- Down payment
- $49,975
- Closing costs
- $5,997
- Reserves months
- —
- Total cash needed
- —
Loan-product check · same deal, 3 products live
Conventional
25% down · 7.5% · 30yr
- Down + closing
- —
- Monthly P&I
- —
- Monthly cashflow
- —
- DSCR
- —
- Eligible?
- —
Personal DTI + credit; lowest rate.
DSCR
20% down · 8.5% · 30yr
- Down + closing
- —
- Monthly P&I
- —
- Monthly cashflow
- —
- DSCR
- —
- Eligible?
- —
No personal income docs; deal must DSCR.
Hard money
10% down · 12.0% · 12mo
- Down + closing
- —
- Monthly P&I
- —
- Monthly cashflow
- —
- DSCR
- —
- Eligible?
- —
Short-term bridge; refi at stabilization.
Rent comps 24 comps
| Address | Beds | Baths | Sqft | Rent | $/sqft | DOM | Units | Dist |
|---|---|---|---|---|---|---|---|---|
| 825 Tamarack Ave Brea, CA | 1.0–2.0 | 1.0–2.0 | 837 | $2,640 | $3.15 | 1d | 5 | 0.32mi |
| 350 W Central Ave Brea, CA | 1.0–3.0 | 1.0–2.5 | 1024 | $4,210 | $4.11 | 1d | 8 | 0.42mi |
| 730 Brooklyn Dr Brea, CA | 2.0 | 2.5 | 1210 | $3,400 | $2.81 | 24d | 1 | 0.45mi |
| 250 W Central Ave Brea, CA | 2.0 | 2.0 | 1100 | $2,930 | $2.66 | 16d | 2 | 0.52mi |
| 650 Tamarack Ave Brea, CA | 2.0 | 1.0–2.0 | 750 | $2,850 | $3.80 | 1d | 18 | 0.55mi |
| 655 N Brea Blvd Brea, CA | 1.0–2.0 | 1.0–2.0 | 830 | $2,745 | $3.31 | 1d | 1 | 0.68mi |
| 319 W Lambert Rd Brea, CA | 2.0 | 2.0 | 1120 | $3,333 | $2.98 | 4d | 9 | 0.78mi |
| 308 Mountain Ct Brea, CA | 3.0 | 2.0 | 1730 | $3,550 | $2.05 | 43d | 1 | 0.95mi |
| 1511 Kinsler Ct Brea, CA | 3.0 | 2.5 | 1605 | $4,095 | $2.55 | 15d | 1 | 0.98mi |
| 369 Meadow Ct Brea, CA | 3.0 | 2.0 | 1281 | $3,450 | $2.69 | 43d | 1 | 1.11mi |
| 137 N Orange Ave Brea, CA | 2.0 | 2.0 | 975 | $2,585 | $2.65 | 43d | 1 | 1.15mi |
| 1913 Lotus Pl Brea, CA | 4.0 | 2.0 | 1627 | $4,100 | $2.52 | 1d | 1 | 1.30mi |
| 160 N Fonda St La Habra, CA | 2.0 | 2.0 | 1000 | $2,500 | $2.50 | 1d | 1 | 1.39mi |
| 160 N Fonda St Unit 2 La Habra, CA | 2.0 | 1.5 | 1000 | $2,500 | $2.50 | 1d | 1 | 1.39mi |
| 334 S Walnut Ave Unit F Brea, CA | 2.0 | 1.5 | 904 | $2,995 | $3.31 | 16d | 1 | 1.41mi |
| 141 N Fonda St Unit 1 La Habra, CA | 3.0 | 2.5 | 1300 | $3,400 | $2.62 | 10d | 1 | 1.42mi |
| 201 Laurel Ave #7 Brea, CA | 2.0 | 2.5 | 1218 | $3,450 | $2.83 | 43d | 1 | 1.43mi |
| 1500 Eastpark Dr Unit 3 La Habra, CA | 2.0 | 1.5 | 1286 | $2,500 | $1.94 | 1d | 1 | 1.44mi |
| 209 S Fonda St La Habra, CA | 2.0 | 2.0 | 1200 | $3,500 | $2.92 | 1d | 1 | 1.45mi |
| 331 Pomelo Ave Brea, CA | 3.0 | 2.0 | 1538 | $4,200 | $2.73 | 43d | 1 | 1.46mi |
| 242 S Redwood Ave Unit C Brea, CA | 3.0 | 2.5 | 1590 | $3,995 | $2.51 | 7d | 1 | 1.48mi |
| 664 Olive Ave Brea, CA | 4.0 | 2.0 | 1472 | $4,500 | $3.06 | 6d | 1 | 1.49mi |
| 628 E Birch St Unit D Brea, CA | 2.0 | 1.5 | 1104 | $2,850 | $2.58 | 13d | 1 | 1.49mi |
| 108 E Date St Unit 108 Brea, CA | 2.0 | 1.0 | 950 | $3,095 | $3.26 | 43d | 1 | 1.50mi |
Listing history 17 events
-
2026-06-18days on market $199,900 Active 21 DOM
-
2026-06-17days on market $199,900 Active 20 DOM
-
2026-06-16days on market $199,900 Active 19 DOM
-
2026-06-15days on market $199,900 Active 18 DOM
-
2026-06-13days on market $199,900 Active 16 DOM
-
2026-06-13days on market $199,900 Active 15 DOM
-
2026-06-09days on market $199,900 Active 12 DOM
-
2026-06-08days on market $199,900 Active 11 DOM
-
2026-06-07days on market $199,900 Active 10 DOM
-
2026-06-04days on market $199,900 Active 7 DOM
-
2026-06-03days on market $199,900 Active 6 DOM
-
2026-06-02days on market $199,900 Active 5 DOM
-
2026-06-01days on market $199,900 Active 4 DOM
-
2026-05-31days on market $199,900 Active 3 DOM
-
2026-04-15price $209,000 909-char remark
Show marketing remark (909 chars)
This charming 3-bedroom, 2-bath home offers approximately 1,300 square feet of comfortable living space designed for both relaxation and everyday convenience. Step inside to an inviting open layout that seamlessly connects the bright living room, dining area, and well-equipped kitchen, creating a perfect setting for gatherings or quiet evenings at home. The spacious primary suite features its own recently remodeled private bath, while the additional bedrooms offer versatility for guests, a home office, or a growing household. Large windows fill the interior with natural light, enhancing the home’s warm and welcoming feel. Outside, you’ll find room to unwind, garden, or simply enjoy the peaceful surroundings. Located in a well-maintained community close to shopping, dining, parks, and major conveniences, this residence delivers comfort, value, and an easy Southern California lifestyle.
-
2026-02-17price $216,000 909-char remark
Show marketing remark (909 chars)
This charming 3-bedroom, 2-bath home offers approximately 1,300 square feet of comfortable living space designed for both relaxation and everyday convenience. Step inside to an inviting open layout that seamlessly connects the bright living room, dining area, and well-equipped kitchen, creating a perfect setting for gatherings or quiet evenings at home. The spacious primary suite features its own recently remodeled private bath, while the additional bedrooms offer versatility for guests, a home office, or a growing household. Large windows fill the interior with natural light, enhancing the home’s warm and welcoming feel. Outside, you’ll find room to unwind, garden, or simply enjoy the peaceful surroundings. Located in a well-maintained community close to shopping, dining, parks, and major conveniences, this residence delivers comfort, value, and an easy Southern California lifestyle.
-
2025-12-26$225,000 Active 909-char remark
Show marketing remark (909 chars)
This charming 3-bedroom, 2-bath home offers approximately 1,300 square feet of comfortable living space designed for both relaxation and everyday convenience. Step inside to an inviting open layout that seamlessly connects the bright living room, dining area, and well-equipped kitchen, creating a perfect setting for gatherings or quiet evenings at home. The spacious primary suite features its own recently remodeled private bath, while the additional bedrooms offer versatility for guests, a home office, or a growing household. Large windows fill the interior with natural light, enhancing the home’s warm and welcoming feel. Outside, you’ll find room to unwind, garden, or simply enjoy the peaceful surroundings. Located in a well-maintained community close to shopping, dining, parks, and major conveniences, this residence delivers comfort, value, and an easy Southern California lifestyle.
ⓘ Source: listings_history table (triggers on properties + properties_extension) + one-shot
backfill from property_details.listing_events for pre-trigger history.
Climate risk First Street
- Flood 1/10 Low FEMA zone X (unshaded) · 0% chance over 30 yrs
- Wildfire 5/10 Major
- Heat 6/10 Major 7 d/yr ≥96°F today · 22 d/yr by 30 yrs out
- Wind 1/10 Low
- Air quality 5/10 Major 7 unhealthy d/yr today · 9 by 30 yrs out
Nearby sold comps map
Loading sold comps map…
Walkable amenities ~0.75 mi
Loading nearby amenities…
Taxation est. · year 1
- Rental income
- $40,168
- − Mortgage interest
- −$11,198
- − Property taxes
- −$2,998
- − Insurance
- −$1,000
- − Repairs & maintenance
- −$3,213
- − Management
- −$3,213
- − Depreciation
- −$5,815
- Taxable income
- $12,730
- Est. tax owed @ 24.0%
- −$3,055
- After-tax cash flow
- $12,100/yr
For passive investors: Depreciation is non-cash, so a rental often shows a tax loss while cash-flowing — sheltering income. Rental losses are passive: they offset passive income freely, and up to $25,000/yr can offset ordinary (W-2) income if you actively participate and your MAGI is under $100k (phasing out to $0 by $150k); unused losses carry forward. On sale, claimed depreciation is recaptured at up to 25%, and gains may owe capital-gains tax (a 1031 exchange can defer both). Figures are a year-1 estimate at your 24.0% rate — not tax advice; consult a CPA.
Schools (NCES district)
- District
- Brea-Olinda Unified
- NCES district ID
- 0605880
- Math proficiency
- 48% ▼ -14.00%
- Reading proficiency
- 65% ▼ -2.00%
- Median HH income
- $83,131
- Composite
- 51.28/100
- National rank
- #1748
- State rank
- #84 of 517 in CA
Livability — Brea
- Score
- 76/100
- State rank
- #100
- US rank
- #3570
Category grades
Schools grade is shown separately in the Schools card above.
Census & demographics
- Census place
- Brea, CA
- County
- Orange County · 3,096,323 people
- City population
- 41,623
- Metro
- Los Angeles-Long Beach-Anaheim, CA
- Population (ZIP)
- 41,623
- Household income
- $123,629
- Rent vs Own
- Severe rent burden
- 1655.0
Population outlook (Orange County) Hauer SSP2
- Today (2025)
- 3,477,456 people
- By 2030
- 3,613,117 · +3.9%
- By 2040
- 3,835,945 · +10.3%
- By 2050
- 3,968,736 · +14.1%
- By 2075
- 4,097,053 · +17.8%
- By 2100
- 3,903,633 · +12.3%
Race, ethnicity, and origin ACS 2023
- Neighborhood character
- Diverse neighborhood (Simpson 0.69)
- Race & ethnicity
- White 38% Hispanic / Latino 32% Asian 24% Two or more races 14% Black 1%
- Hispanic origin (detail)
- Mexican 27%
- Common ancestry
- Slovak 2% Lithuanian 2% Italian 1%
- Foreign-born
- 23% · Canada, South Korea, China
- Languages at home
- 66% English-only · Spanish 16% Korean 6% Chinese 4%
Political lean MEDSL · Orange
- 2024 margin
- Toss-up / Even · D 49.7% · R 47.1% · Other 3.2%
- 2008→2024 swing
- +5.2pp toward D · 2008: -2.6pp · 2024: 2.6pp
- All cycles
- 2024: D+2.6 2020: D+9.0 2016: D+7.7 2012: R+8.3 2008: R+2.6
Not yet ingested
- Civics
- —
Market trends
- HPI YoY
- ▼ -826.78%
- Current HPI
- 374.8663
- Rent YoY
- ▲ 1.78%
- Metro
- Los Angeles-Long Beach-Anaheim, CA
- State GDP YoY
- ▲ 3.21%
- F500 in state
- 116
Industry mix (Fortune 500 HQ in CA)
| Industry | F500 HQs | Revenue |
|---|---|---|
| Technology | 27 | $1,492B |
|
||
| Financial Services | 3 | $174B |
|
||
| Retail | 3 | $44B |
|
||
| Insurance | 3 | $26B |
|
||
| Media / Entertainment | 2 | $115B |
|
||
| Pharmaceuticals / Biotech | 2 | $62B |
|
||
Price history
-7.1% since first listed3 events — show timeline
- 2026-04-15 Price Changed $209,000 CRMLS
- 2026-02-17 Price Changed $216,000 CRMLS
- 2025-12-26 Listed $225,000 CRMLS
Property tax history
-5.1%/yrLatest (2025): $86 · +3.2% YoY. Source: county tax records.
Cash-flow waterfall
monthlySold comps — $/sqft
last 12 mo · ≤1 miLoading sold comps…