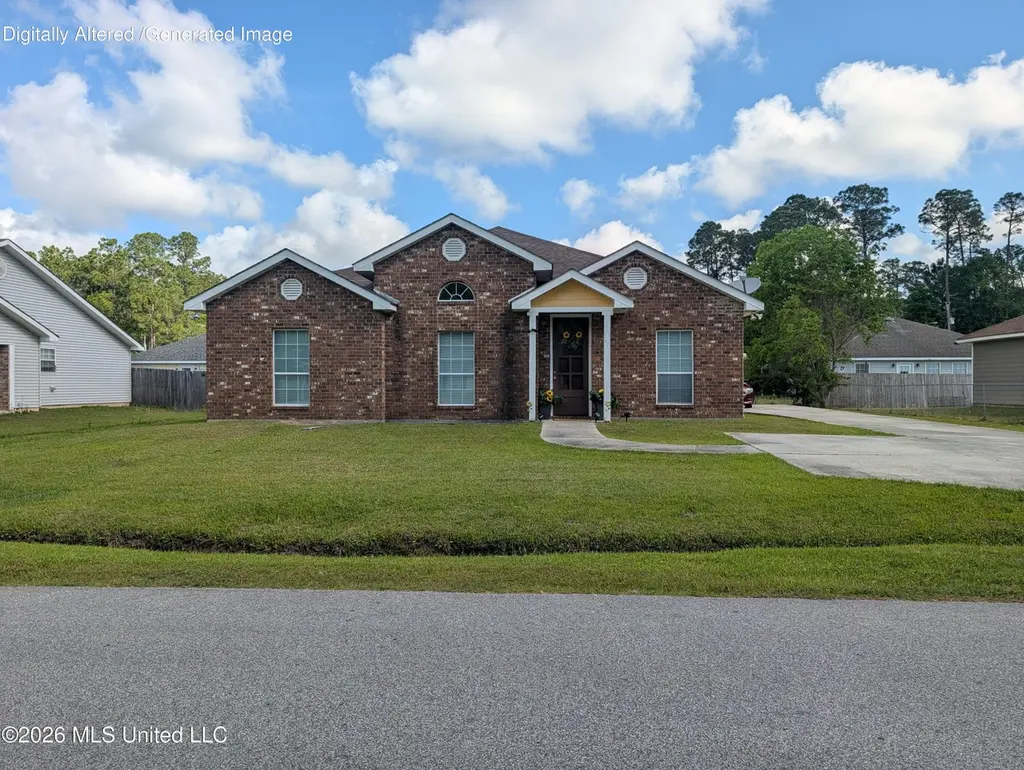
216 Dogwood St · Waveland, MS
Flood risk 7/10 · Major
- FEMA flood zone
- AE
- Chance of flooding over 30 yrs
- 0.95%
- Est. flood insurance / yr
- $1,737 – $8,500
Fire risk 5/10 · Moderate
- Est. fire insurance / yr
- $1,241 – $2,305
Heat risk 10/10 · Severe
- Hot days now (above 107°F)
- 7 days/yr
- Hot days in 30 yrs
- 21 days/yr
Wind risk 10/10 · Severe
- Chance of severe wind over 30 yrs
- 99.0%
Air-quality risk 1/10 · Minimal
- Unhealthy air days now
- 0 days/yr
- Unhealthy air days in 30 yrs
- 0 days/yr
Risk factors via First Street. Map © Google.
Why this score? — see what drove the C+ grade
The composite is a weighted blend of 9 inputs, each scored 0–100. Each bar is that input's sub-score; the figure is the points it added to the 100-point composite (weight × sub-score).
- Cash flow +24.5/30.0
- ARV discount +13.5/15.0
- DSCR +7.9/10.0
- 1% rule +6.0/10.0
- Schools +3.9/10.0
- Livability +3.1/5.0
- Rent growth +2.5/5.0
- Condition / age +2.5/5.0
- Appreciation +0.0/10.0
$177,000
🖨 Deal sheet 📄 Offer letter ✓ Due diligence
Listing remarks MLS
Income property OR Ready to call your Home. Great rental history and a proven income-producing property. This well-loved home has consistently attracted quality tenants who have taken excellent care of the property, with maintenance addressed promptly as needed. Currently tenant-occupied, making it an ideal investment opportunity. The home features 3 bedrooms and 2 full baths. The spacious primary suite offers a tray ceiling and ample storage with two closets, while the en-suite bath includes a relaxing soaking tub and separate walk-in shower. The additional bedrooms are well-positioned and generously sized. A vaulted ceiling enhances the living room, creating a warm and inviting atmosphere. The kitchen is thoughtfully designed with abundant counter space, ample cabinetry, and a pantry, along with an oversized laundry room conveniently located just off the kitchen. Enjoy your morning coffee in the light-filled breakfast area, then step out to the covered back porch--perfect for relaxing and enjoying the peaceful outdoor setting. Durable brick and concrete plank siding provide low-maintenance living, adding to this home's overall appeal.
Key facts
- Tenant occupied
- Vaulted ceiling
- Covered back porch
Tags
Neighborhood map
What this means for you Summary
Snapshot
- This is a 3-bed/2.0-bath single-family listed at $177k.
Deal economics
- At list price, monthly cash flow is $-63 ($-761/yr) — negative.
- To cash-flow at today's rent, offer at most $166k (6.3% below list).
- Meets the 1% rule at list price ($2k rent vs $177k).
- Recommended offer: $166k (6.3% below list) — sets the bar for cash-flow.
- Cap rate 8.8% vs local median 2.5% in Waveland — top-decile yield for the area; either an underpriced asset or a hidden risk that comps aren't pricing in. Stress-test before assuming the spread holds.
Location & tenants
- Location reads 61/100 on livability (#199 in MS) — a middle-class / working-renter tenant base. Strengths: cost of living A+, housing A+, health & safety A+; Watch: schools F, amenities F, commute F.
- Hancock County School District (rural): math 47% / reading 44% proficiency, ranked #23 of 130 in MS (top 18%) — families likely to look elsewhere, expect single-tenant / working-renter base with shorter leases.
- Market conditions: 225 active listings in the ZIP; 1 comparable units currently listed for rent nearby; 248 units permitted in Hancock County in 2024 (0 in 5+ unit buildings).
Forward outlook
- Local home prices are declining (-3.0%/yr); year-one equity from $1k of loan paydown is wiped out by about $5k of value loss. Plan a longer hold.
- Hancock County population projected at +20% by 2050 — long-run rental-demand tailwind backs the buy-and-hold thesis.
Negotiation context
- It's been on market 63 days — a 6% lower offer ($166k) is reasonable based on typical stale-listing flexibility.
- 3 sale attempts since 4y ago; this cycle's ask has dropped $18k (9%) from the opening price — seller is motivated, your offer sets the floor, not the list.
Risks & watch-outs
- Watch-outs: flood insurance adds $427/mo.
- Climate carrying-cost: in FEMA flood zone AE (mandatory federal flood insurance); severe wind risk, 99% chance of damaging wind over 30y; moderate wildfire risk; extreme-heat days projected 7→21/yr by 2055 (HVAC capex compounding) — expect insurance premiums to compound above CPI over the hold.
Questions for the listing agent
- What do current leases actually rent for vs. the listed asking? Can we see a recent rent roll and the last 12 months of T-12 income?
- It's been on market 63 days. Have you received any prior offers? Is the seller open to a 6% concession, seller financing, or rate buy-down credit?
- What's the actual annual flood-insurance premium (NFIP or private), and is the property in a SFHA with mandatory coverage?
- Why hasn't it sold? Are there any deal-killer items the seller is aware of (foundation, flood, title, zoning, code violations)?
- Is there a deadline driving the sale (1031 exchange, divorce, estate, relocation)? That informs how much negotiation room exists.
- Schools are F-rated, which usually means shorter tenancies and higher turnover. Who's the typical renter profile here, and what's been the actual vacancy rate?
- What's the average days-on-market for RENTAL listings here right now (not sales)? A rising rental-DOM trend means longer vacancies and softer asking-rent achievability than the comps imply.
- What's the recent tenant-quality profile in this submarket — average credit score on applications, eviction rate, late-payment / NSF rate, and stable-employment percentage? A property-management company in the area should have these aggregated.
- How much new for-sale + rental construction is in the pipeline within 1–3 miles? Heavy new supply typically softens prices + rents 12–24 months out; constrained supply supports both.
Investment metrics
- 1% rule
- 1.10% ✓
- Cap rate
- 8.75%
- Cash-on-cash
- 8.79%
- DSCR
- 1.39
- GRM
- 7.6
CMA / ARV
- ARV (median comp)
- $204,492
- List price
- $177,000
- Delta
- -13.44%
- Verdict
- UNDERPRICED
- Comps
- 20 within 1.0 mi
Show comp detail 5 sales within ~0.75 mi
| Address | Dist | Beds/Ba | Sqft | Sold | Price | $/sf | Match |
|---|---|---|---|---|---|---|---|
| 214 Dogwood St | 0.02mi | 3/2.0 | 1,637 (-0%) | 16mo | $194,900 | $119 | 85 |
| 4136 Coral St | 0.44mi | 3/2.0 | 1,689 (+3%) | 10mo | $199,000 | $118 | 66 |
| 4358 Coral St | 0.42mi | 4/2.0 (+1) | 1,500 (-9%) | 3mo | $184,999 | $123 | 58 |
| 205 Idlewood Dr | 0.44mi | 3/2.0 | 1,716 (+4%) | 22mo | $234,500 | $137 | 54 |
| 709 Boyd St | 0.69mi | 3/2.0 | 1,601 (-3%) | 23mo | $279,000 | $174 | 44 |
Match score weights: distance 35% · size 25% · config 20% · recency 20%. Top-matched comps best support the ARV.
Projected returns pro-forma
-3.0% appreciation · 3.0% rent growth · sell at horizon
- IRR
- -18.6%
- Equity multiple
- 0.35×
- Total profit
- $-32,458
- Equity at exit
- $26,391
- IRR
- -10.7%
- Equity multiple
- 0.35×
- Total profit
- $-32,396
- Equity at exit
- $15,304
Cash invested: $49,560 (down + closing). Projections, not guarantees.
Landlord ↔ Tenant lean methodology
- Overall (STATE)
- 90 Strongly Landlord-Friendly
- State Mississippi
- 90 Strongly Landlord-Friendly · R+11
- County
- — inherits STATE
- City
- — inherits STATE
ZIP-level market 39576
- Active inventory
- 225
- Price-to-rent
- 7.6×
Monthly cashflow live
- Estimated rent
- $1,950 medium interval (Pro) →
- Mortgage (P&I)
- −$928
- Tax from tax record
- −$175 /mo · $2,105/yr
- Insurance
- −$74
- Flood insurance flood zone
- −$427 /mo · $5,118/yr
- HOA
- −$0
- Vacancy / Maint / Mgmt
- −$410
- Net cashflow
- $-63
Break-even live
UW: 25.0% down · 7.5% · 30yr · 1.5% tax · 5.0% vac · 8.0% maint · 8.0% mgmt
Financing live
Cash to close
- Down payment
- $44,250
- Closing costs
- $5,310
- Reserves months
- —
- Total cash needed
- —
Loan-product check · same deal, 3 products live
Conventional
25% down · 7.5% · 30yr
- Down + closing
- —
- Monthly P&I
- —
- Monthly cashflow
- —
- DSCR
- —
- Eligible?
- —
Personal DTI + credit; lowest rate.
DSCR
20% down · 8.5% · 30yr
- Down + closing
- —
- Monthly P&I
- —
- Monthly cashflow
- —
- DSCR
- —
- Eligible?
- —
No personal income docs; deal must DSCR.
Hard money
10% down · 12.0% · 12mo
- Down + closing
- —
- Monthly P&I
- —
- Monthly cashflow
- —
- DSCR
- —
- Eligible?
- —
Short-term bridge; refi at stabilization.
Rent comps 1 comps
| Address | Beds | Baths | Sqft | Rent | $/sqft | DOM | Units | Dist |
|---|---|---|---|---|---|---|---|---|
| 912 Maple St Waveland, MS | 4.0 | 2.0 | 1702 | $1,950 | $1.15 | 2d | 1 | 1.39mi |
Listing history 22 events
-
2026-06-18days on market $177,000 Active 63 DOM
-
2026-06-17days on market $177,000 Active 62 DOM
-
2026-06-16days on market $177,000 Active 61 DOM
-
2026-06-15days on market $177,000 Active 60 DOM
-
2026-06-14days on market $177,000 Active 58 DOM
-
2026-06-13days on market $177,000 Active 57 DOM
-
2026-06-10days on market $177,000 Active 55 DOM
-
2026-06-09days on market $177,000 Active 54 DOM
-
2026-06-08days on market $177,000 Active 53 DOM
-
2026-06-07days on market $177,000 Active 52 DOM
-
2026-06-05days on market $177,000 Active 49 DOM
-
2026-06-03days on market $177,000 Active 48 DOM
-
2026-06-03price $177,000 Active 47 DOM
-
2026-06-02days on market $195,000 Active 47 DOM
-
2026-06-01days on market $195,000 Active 46 DOM
-
2026-05-31days on market $195,000 Active 45 DOM
-
2026-05-30days on market $195,000 Active 44 DOM
-
2026-04-16$195,000 Active 1170-char remark
Show marketing remark (1170 chars)
Income property OR Ready to call your Home. Great rental history and a proven income-producing property. This well-loved home has consistently attracted quality tenants who have taken excellent care of the property, with maintenance addressed promptly as needed. Currently tenant-occupied, making it an ideal investment opportunity. The home features 3 bedrooms and 2 full baths. The spacious primary suite offers a tray ceiling and ample storage with two closets, while the en-suite bath includes a relaxing soaking tub and separate walk-in shower. The additional bedrooms are well-positioned and generously sized. A vaulted ceiling enhances the living room, creating a warm and inviting atmosphere. The kitchen is thoughtfully designed with abundant counter space, ample cabinetry, and a pantry, along with an oversized laundry room conveniently located just off the kitchen. Enjoy your morning coffee in the light-filled breakfast area, then step out to the covered back porch--perfect for relaxing and enjoying the peaceful outdoor setting. Durable brick and concrete plank siding provide low-maintenance living, adding to this home's overall appeal.
-
2025-09-01historical
-
2025-06-17$225,000 Active
-
2022-07-29historical
-
2022-06-01$199,900 Active
ⓘ Source: listings_history table (triggers on properties + properties_extension) + one-shot
backfill from property_details.listing_events for pre-trigger history.
Tax reassessment forecast MS · Resets to sale price
- Current annual tax
- $2,105 · $175/mo
- Projected year-2 tax
- $2,105 · $175/mo
- Expected delta
- $0/yr ($0/mo · 0.0%)
ⓘ Screening estimate from a state-policy table — verify with the county assessor before closing.
Climate risk First Street
- Flood 7/10 Severe FEMA zone AE · 95% chance over 30 yrs
- Wildfire 5/10 Major
- Heat 10/10 Extreme 7 d/yr ≥107°F today · 21 d/yr by 30 yrs out
- Wind 10/10 Extreme 99% chance of damaging wind over 30 yrs
- Air quality 1/10 Low 0 unhealthy d/yr today · 0 by 30 yrs out
Nearby sold comps map
Loading sold comps map…
Walkable amenities ~0.75 mi
Loading nearby amenities…
Taxation est. · year 1
- Rental income
- $23,400
- − Mortgage interest
- −$9,915
- − Property taxes
- −$2,105
- − Insurance
- −$6,004
- − Repairs & maintenance
- −$1,872
- − Management
- −$1,872
- − Depreciation
- −$5,149
- Taxable loss
- −$3,516
- Est. tax savings @ 24.0%
- +$844
- After-tax cash flow
- $83/yr
For passive investors: Depreciation is non-cash, so a rental often shows a tax loss while cash-flowing — sheltering income. Rental losses are passive: they offset passive income freely, and up to $25,000/yr can offset ordinary (W-2) income if you actively participate and your MAGI is under $100k (phasing out to $0 by $150k); unused losses carry forward. On sale, claimed depreciation is recaptured at up to 25%, and gains may owe capital-gains tax (a 1031 exchange can defer both). Figures are a year-1 estimate at your 24.0% rate — not tax advice; consult a CPA.
Schools (NCES district)
- District
- Hancock County School District
- NCES district ID
- 2801740
- Math proficiency
- 47% ▼ -11.00%
- Reading proficiency
- 44% ▼ -9.00%
- Median HH income
- $47,971
- Composite
- 38.88/100
- National rank
- #4099
- State rank
- #23 of 130 in MS
Livability — Waveland
- Score
- 61/100
- State rank
- #199
- US rank
- #18110
Category grades
Schools grade is shown separately in the Schools card above.
Census & demographics
- Census place
- Waveland, MS
- City population
- 6,249
- Population (ZIP)
- 6,249
Population outlook (Hancock County) Hauer SSP2
- Today (2025)
- 52,161 people
- By 2030
- 54,753 · +5.0%
- By 2040
- 59,242 · +13.6%
- By 2050
- 62,417 · +19.7%
- By 2075
- 68,168 · +30.7%
- By 2100
- 69,212 · +32.7%
Race, ethnicity, and origin ACS 2023
- Neighborhood character
- Predominantly White (76%)
- Race & ethnicity
- White 76% Black 13% Two or more races 8% Hispanic / Latino 4%
- Common ancestry
- Lithuanian 8% Italian 1% Russian 1%
- Foreign-born
- 4% · Canada
- Languages at home
- 95% English-only · French/Haitian/Cajun 2% Spanish 2% Arabic 1%
Political lean MEDSL · Hancock
- 2024 margin
- Solid R (+58.7) · D 20.1% · R 78.8% · Other 1.1%
- 2008→2024 swing
- -4.4pp toward R · 2008: -54.2pp · 2024: -58.7pp
- All cycles
- 2024: R+58.7 2020: R+55.5 2016: R+59.4 2012: R+52.8 2008: R+54.2
Not yet ingested
- Civics
- —
Market trends
- HPI YoY
- ▼ -144.70%
- Current HPI
- 218.6299
- Rent YoY
- —
- Metro
- —
- State GDP YoY
- —
- F500 in state
- 0
Price history
-2.5% since first listed5 events — show timeline
- 2026-04-16 Listed $195,000 MLSU
- 2025-09-01 Listing Removed — MLSU
- 2025-06-17 Listed $225,000 MLSU
- 2022-07-29 Listing Removed — MLSU
- 2022-06-01 Listed $199,900 MLSU
Property tax history
+2.8%/yrLatest (2025): $2,105 · +3.0% YoY. Source: county tax records.
Cash-flow waterfall
monthlySold comps — $/sqft
last 12 mo · ≤1 miLoading sold comps…