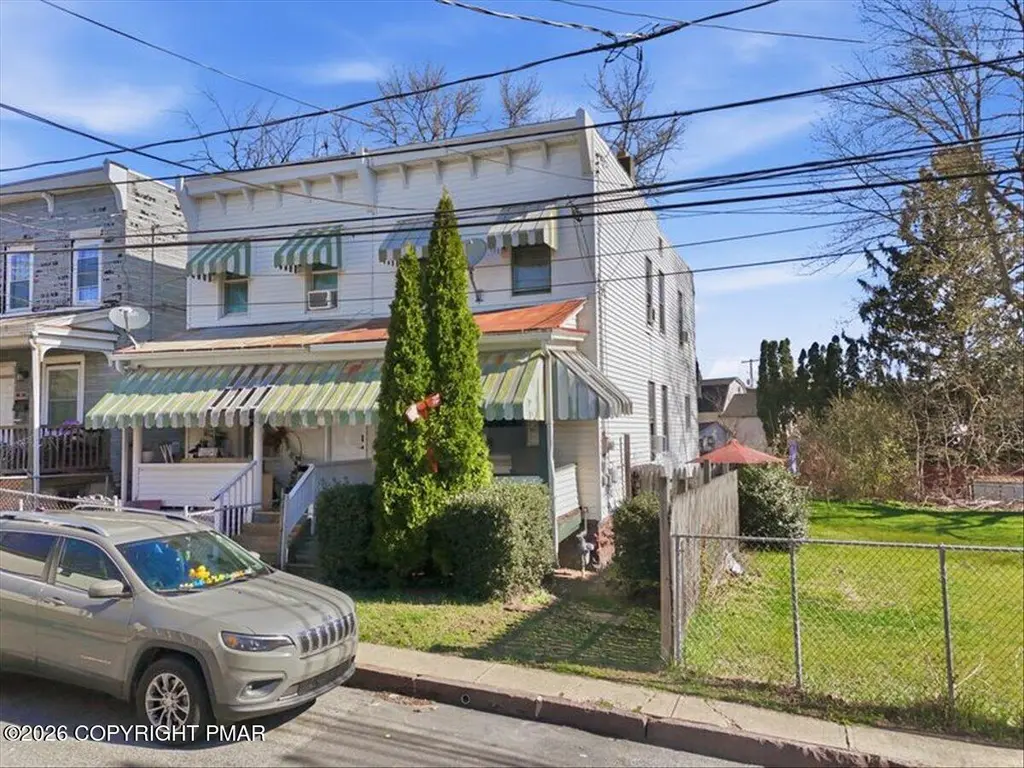
22 Schoolhouse Ln · Wilkes-Barre, PA
Flood risk 1/10 · Minimal
- FEMA flood zone
- X (unshaded)
- Chance of flooding over 30 yrs
- 0.0%
- Est. flood insurance / yr
- $507 – $1,088
Fire risk 3/10 · Minor
- Est. fire insurance / yr
- $511 – $949
Heat risk 4/10 · Minor
- Hot days now (above 95°F)
- 7 days/yr
- Hot days in 30 yrs
- 16 days/yr
Wind risk 3/10 · Minor
- Chance of severe wind over 30 yrs
- 5.0%
Air-quality risk 2/10 · Minimal
- Unhealthy air days now
- 1 days/yr
- Unhealthy air days in 30 yrs
- 2 days/yr
Risk factors via First Street. Map © Google.
Why this score? — see what drove the B grade
The composite is a weighted blend of 9 inputs, each scored 0–100. Each bar is that input's sub-score; the figure is the points it added to the 100-point composite (weight × sub-score).
- Cash flow +28.2/30.0
- ARV discount +15.0/15.0
- DSCR +10.0/10.0
- 1% rule +7.7/10.0
- Rent growth +4.2/5.0
- Livability +2.5/5.0
- Condition / age +2.5/5.0
- Schools +2.1/10.0
- Appreciation +0.0/10.0
$109,000
🖨 Deal sheet 📄 Offer letter ✓ Due diligence
Listing remarks
Charming single-family home located at 22 Schoolhouse Ln, offering 1,204 sq ft of comfortable living space in the heart of Wilkes-Barre. This well-situated property is perfect for homeowners or investors alike, featuring a manageable footprint with great potential to personalize, renovate, or expand. The home also boasts a large lawn yard that serves as an open canvas to bring your ideas to life, ideal for outdoor entertaining, gardening, recreation, or future improvements. Conveniently located near local schools, shopping, and major roadways, the property provides easy access to everyday essentials while maintaining a peaceful neighborhood feel. Positioned in a low-tax area with minimal fl
Key facts
- Adjacent parcel
- 1,306 sq ft lot
- Built 1940
Tags
Property features AI
Finance
- Other: Living area approximately 1,204 finished above-grade; Basement: full, concrete, unfinished (includes large basement area and additional basement room with wet bar)
Exterior
- Parking: Off-street parking; On-street parking
- Utilities: Public water; Public sewer; Electricity connected (200+ Amp service); Natural gas connected; Water connected; Sewer connected
- Home design: Single family residence; Residential property; Built circa 1940 (estimated)
- Construction: Block, vinyl siding and concrete construction; Stone foundation; Rolled/hot mop roof; Shingle roof
- Exterior features: Private yard; Back yard; Corner lot; City street frontage; Paved road
Interior
- Kitchen: Electric range; Refrigerator
- Bedrooms: 3 bedrooms (Primary bedroom included)
- Flooring: Carpet; Tile
- Bathrooms: 1 full bathroom
- Heating & cooling: Baseboard heating; Ceiling fan(s) for cooling
- Interior features: Eat-in kitchen; Wet bar; Storage attic
Neighborhood map
What this means for you Summary
Snapshot
- This is a 3-bed/1.0-bath single-family listed at $109k.
Deal economics
- At list price, monthly cash flow is $344 ($4k/yr) — positive.
- The deal already cash-flows at list — no discount required.
- Meets the 1% rule at list price ($1k rent vs $109k).
- Cap rate 10.1% vs local median 5.7% in Wilkes-Barre — top-decile yield for the area; either an underpriced asset or a hidden risk that comps aren't pricing in. Stress-test before assuming the spread holds.
Location & tenants
- Location reads: area grade B — affects rentability + tenant quality, not the cash-flow math above.
- Wilkes-Barre Area SD (urban): math 19% / reading 32% proficiency, ranked #469 of 539 in PA (top 87%) — low school quality limits family demand, transient renter base, plan for 1-2y turnover; 61% free/reduced lunch — lower-income household profile, screen leases tightly.
- Market conditions: Rents rising fast (+6.8%/yr); 221 active listings in the ZIP; 29 comparable units currently listed for rent nearby; rentals at typical pace (median 21d on market — plan ~3-4 weeks tenant-placement turnaround); 349 units permitted in Luzerne County in 2024 (16 in 5+ unit buildings).
Forward outlook
- Local home prices are declining (-3.0%/yr); year-one equity from $754 of loan paydown is wiped out by about $3k of value loss. Plan a longer hold.
- Luzerne County population projected at +4% by 2050 — modest demand growth; plan on rents tracking national, not racing it.
- At projected returns (-3.0% appreciation + 6.8% rent growth), your $31k cash investment doubles in ~7 years — after that, you're playing with house money.
Negotiation context
- Only 12 days on market — expect competitive offers; lowballing is unlikely to land.
- 3 sale attempts with the ask held roughly flat each time — persistent listings suggest the price (not the market) is what's stuck; bring a comps-based counter.
Risks & watch-outs
- Watch-outs: built in 1940 — expect roof / HVAC / electrical / plumbing capex.
Questions for the listing agent
- Built in 1940 — when were the roof, HVAC, electrical panel, plumbing, and water heater last replaced?
- Is there a deadline driving the sale (1031 exchange, divorce, estate, relocation)? That informs how much negotiation room exists.
- What's the average days-on-market for RENTAL listings here right now (not sales)? A rising rental-DOM trend means longer vacancies and softer asking-rent achievability than the comps imply.
- What's the recent tenant-quality profile in this submarket — average credit score on applications, eviction rate, late-payment / NSF rate, and stable-employment percentage? A property-management company in the area should have these aggregated.
- How much new for-sale + rental construction is in the pipeline within 1–3 miles? Heavy new supply typically softens prices + rents 12–24 months out; constrained supply supports both.
Investment metrics
- 1% rule
- 1.27% ✓
- Cap rate
- 10.08%
- Cash-on-cash
- 13.54%
- DSCR
- 1.60
- GRM
- 6.5
CMA / ARV
- ARV (median comp)
- $132,429
- List price
- $109,000
- Delta
- -1.91%
- Verdict
- FAIR
- Comps
- 20 within 1.0 mi
Show comp detail 12 sales within ~0.75 mi
| Address | Dist | Beds/Ba | Sqft | Sold | Price | $/sf | Match |
|---|---|---|---|---|---|---|---|
| 10 Laurel St | 0.22mi | 2/1.0 (-1) | 1,197 (-1%) | 8mo | $120,000 | $100 | 77 |
| 97 Kidder St | 0.37mi | 3/1.0 | 1,214 (+1%) | 8mo | $135,000 | $111 | 75 |
| 34 Kidder St | 0.50mi | 3/1.0 | 1,235 (+3%) | 2mo | $140,000 | $113 | 70 |
| 734 Pennsylvania Ave | 0.53mi | 3/1.0 | 1,220 (+1%) | 5mo | $140,000 | $115 | 69 |
| 35 John St | 0.38mi | 3/2.0 | 1,161 (-4%) | 8mo | $184,000 | $158 | 66 |
| 16 Ralph St | 0.38mi | 3/1.5 | 1,280 (+6%) | 5mo | $137,000 | $107 | 65 |
| 279 Wyoming St | 0.47mi | 2/1.0 (-1) | 1,200 (-0%) | 9mo | $99,900 | $83 | 65 |
| 59 Bowman St | 0.50mi | 3/1.0 | 1,300 (+8%) | 3mo | $176,000 | $135 | 61 |
| 124 Wyoming St | 0.64mi | 3/1.0 | 1,274 (+6%) | 0mo | $130,000 | $102 | 60 |
| 86 Wyoming Ave St | 0.70mi | 3/1.0 | 1,192 (-1%) | 9mo | $45,000 | $38 | 58 |
| 400 Madison St | 0.66mi | 3/1.0 | 1,155 (-4%) | 8mo | $135,204 | $117 | 56 |
| 334 Main St | 0.74mi | 3/1.5 | 1,224 (+2%) | 8mo | $120,000 | $98 | 54 |
Match score weights: distance 35% · size 25% · config 20% · recency 20%. Top-matched comps best support the ARV.
Projected returns pro-forma
-3.0% appreciation · 6.84% rent growth · sell at horizon
- IRR
- 7.9%
- Equity multiple
- 1.32×
- Total profit
- $9,860
- Equity at exit
- $16,252
- IRR
- 20.3%
- Equity multiple
- 3.02×
- Total profit
- $61,666
- Equity at exit
- $9,424
Cash invested: $30,520 (down + closing). Projections, not guarantees.
Landlord ↔ Tenant lean methodology
- Overall (STATE)
- 62 Landlord-Friendly
- State Pennsylvania
- 62 Landlord-Friendly · EVEN
- County
- — inherits STATE
- City
- — inherits STATE
ZIP-level market 18702
- Rents YoY
- 6.8%
- Active inventory
- 221
- Price-to-rent
- 6.5×
Monthly cashflow live
- Estimated rent
- $1,389 high interval (Pro) →
- Mortgage (P&I)
- −$572
- Tax est. 1.5%
- −$136 /mo · $1,635/yr
- Insurance
- −$45
- HOA
- −$0
- Vacancy / Maint / Mgmt
- −$292
- Net cashflow
- $344
Break-even live
UW: 25.0% down · 7.5% · 30yr · 1.5% tax · 5.0% vac · 8.0% maint · 8.0% mgmt
Financing live
Cash to close
- Down payment
- $27,250
- Closing costs
- $3,270
- Reserves months
- —
- Total cash needed
- —
Loan-product check · same deal, 3 products live
Conventional
25% down · 7.5% · 30yr
- Down + closing
- —
- Monthly P&I
- —
- Monthly cashflow
- —
- DSCR
- —
- Eligible?
- —
Personal DTI + credit; lowest rate.
DSCR
20% down · 8.5% · 30yr
- Down + closing
- —
- Monthly P&I
- —
- Monthly cashflow
- —
- DSCR
- —
- Eligible?
- —
No personal income docs; deal must DSCR.
Hard money
10% down · 12.0% · 12mo
- Down + closing
- —
- Monthly P&I
- —
- Monthly cashflow
- —
- DSCR
- —
- Eligible?
- —
Short-term bridge; refi at stabilization.
Rent comps 29 comps
| Address | Beds | Baths | Sqft | Rent | $/sqft | DOM | Units | Dist |
|---|---|---|---|---|---|---|---|---|
| 423 Scott St Apt 1 Wilkes-Barre, PA | 3.0 | 1.0 | 1100 | $1,450 | $1.32 | 44d | 1 | 0.03mi |
| 402 Scott St Fl 3 Wilkes-Barre, PA | 2.0 | 1.0 | 761 | $950 | $1.25 | 44d | 1 | 0.08mi |
| 168 Kidder St City of Wilkes Barre, PA | 2.0 | 1.0 | 750 | $1,250 | $1.67 | 21d | 1 | 0.27mi |
| 168-170 Kidder St Wilkes-Barre, PA | 2.0 | 1.0 | 750 | $1,250 | $1.67 | 21d | 1 | 0.29mi |
| 2 N Diamond St Wilkes-Barre, PA | 3.0 | 1.0 | 1000 | $1,500 | $1.50 | 21d | 1 | 0.49mi |
| 273 New Hancock St Unit 2 Wilkes-Barre, PA | 2.0 | 1.0 | 725 | $1,300 | $1.79 | 21d | 1 | 0.58mi |
| 131 Scott St Wilkes-Barre Township, PA | 2.0 | 1.0 | 1144 | $1,300 | $1.14 | 44d | 1 | 0.59mi |
| 268 N Pennsylvania Ave Unit 2 Wilkes-Barre, PA | 3.0 | 1.0 | 758 | $1,300 | $1.72 | 21d | 1 | 0.71mi |
| 535 N Franklin St Wilkes Barre, PA | 3.0 | 1.0 | 1148 | $1,359 | $1.18 | 21d | 1 | 0.74mi |
| 37 Wyoming St Wilkes Barre, PA | 4.0 | 1.0 | 1300 | $2,200 | $1.69 | 21d | 1 | 0.76mi |
| 301 N Main St Unit 2 Wilkes-Barre, PA | 3.0 | 1.0 | 1050 | $1,300 | $1.24 | 21d | 1 | 0.76mi |
| 572 N Franklin St Wilkes Barre, PA | 2.0 | 1.0 | 1042 | $1,100 | $1.06 | 44d | 1 | 0.77mi |
| 572 N Franklin St Wilkes Barre, PA | 2.0 | 1.0 | 1042 | $1,050 | $1.01 | 21d | 1 | 0.77mi |
| 261 N Washington St Wilkes Barre, PA | 3.0 | 1.0 | 1050 | $1,400 | $1.33 | 44d | 1 | 0.77mi |
| 13 E Chestnut St Unit 1 Wilkes-Barre, PA | 3.0 | 1.0 | 900 | $1,195 | $1.33 | 44d | 1 | 0.82mi |
| 36 Logan St Wilkes-Barre, PA | 3.0 | 1.0 | 1200 | $1,125 | $0.94 | 44d | 1 | 1.02mi |
| 2 S Empire St Unit 2R Wilkes-Barre, PA | 2.0 | 1.0 | 850 | $1,250 | $1.47 | 21d | 1 | 1.09mi |
| 9d Princeton Ct Wilkes-Barre, PA | 1.0–2.0 | 1.0–1.5 | 945 | $2,644 | $2.80 | 14d | 8 | 1.12mi |
| 98 N Franklin St Unit 2 Wilkes-Barre, PA | 2.0 | 2.0 | 1254 | $1,650 | $1.32 | 14d | 1 | 1.16mi |
| 51 S Welles St Wilkes Barre, PA | 4.0 | 1.0 | 1344 | $1,600 | $1.19 | 44d | 1 | 1.21mi |
| 48 Saratoga Ct Wilkes Barre, PA | 3.0 | 1.5 | 1240 | $1,650 | $1.33 | 21d | 1 | 1.22mi |
| 60 Saratoga Ct Wilkes Barre, PA | 3.0 | 1.5 | 1240 | $1,850 | $1.49 | 21d | 1 | 1.23mi |
| 67-69 Public Sq Wilkes-Barre, PA | 2.0 | 1.0 | 910 | $1,875 | $2.06 | 44d | 1 | 1.25mi |
| 67-69 Public Sq #1203 Wilkes Barre, PA | 2.0 | 1.0 | 875 | $1,825 | $2.09 | 44d | 1 | 1.26mi |
| 92 S Diamond St Wilkes-Barre, PA | 3.0 | 1.0 | 1150 | $1,400 | $1.22 | 44d | 1 | 1.28mi |
| 19 N River St Unit 308 Wilkes-Barre, PA | 2.0 | 1.5 | 910 | $1,600 | $1.76 | 14d | 1 | 1.31mi |
| 19 N River St Unit 403 Wilkes-Barre, PA | 2.0 | 1.0 | 723 | $1,600 | $2.21 | 14d | 1 | 1.31mi |
| 38 W Market St Unit 3 Wilkes-Barre, PA | 2.0 | 1.0 | 1388 | $1,295 | $0.93 | 14d | 1 | 1.32mi |
| 100 Parkway Blvd Kingston, PA | 2.0 | 1.0 | 650 | $1,400 | $2.15 | 14d | 1 | 1.37mi |
Listing history 16 events
-
2026-06-18days on market $109,000 Active 12 DOM
-
2026-06-17days on market $109,000 Active 11 DOM
-
2026-06-16days on market $109,000 Active 10 DOM
-
2026-06-15days on market $109,000 Active 9 DOM
-
2026-06-14days on market $109,000 Active 7 DOM
-
2026-06-13days on market $109,000 Active 6 DOM
-
2026-06-10pricedays on market $109,000 Active 4 DOM
-
2026-06-09days on market $129,900 Active 53 DOM
-
2026-06-08days on market $129,900 Active 52 DOM
-
2026-06-07days on market $129,900 Active 51 DOM
-
2026-06-02days on market $129,900 Active 46 DOM
-
2026-06-01days on market $129,900 Active 45 DOM
-
2026-05-31days on market $129,900 Active 44 DOM
-
2026-05-30days on market $129,900 Active 43 DOM
-
2026-04-16$139,900 Active 620-char remark
-
2026-04-15$139,900 Active 620-char remark
ⓘ Source: listings_history table (triggers on properties + properties_extension) + one-shot
backfill from property_details.listing_events for pre-trigger history.
Climate risk First Street
- Flood 1/10 Low FEMA zone X (unshaded) · 0% chance over 30 yrs
- Wildfire 3/10 Moderate
- Heat 4/10 Moderate 7 d/yr ≥95°F today · 16 d/yr by 30 yrs out
- Wind 3/10 Moderate 5% chance of damaging wind over 30 yrs
- Air quality 2/10 Low 1 unhealthy d/yr today · 2 by 30 yrs out
Nearby sold comps map
Loading sold comps map…
Walkable amenities ~0.75 mi
Loading nearby amenities…
Taxation est. · year 1
- Rental income
- $16,672
- − Mortgage interest
- −$6,106
- − Property taxes
- −$1,635
- − Insurance
- −$545
- − Repairs & maintenance
- −$1,334
- − Management
- −$1,334
- − Depreciation
- −$3,171
- Taxable income
- $2,548
- Est. tax owed @ 24.0%
- −$611
- After-tax cash flow
- $3,520/yr
For passive investors: Depreciation is non-cash, so a rental often shows a tax loss while cash-flowing — sheltering income. Rental losses are passive: they offset passive income freely, and up to $25,000/yr can offset ordinary (W-2) income if you actively participate and your MAGI is under $100k (phasing out to $0 by $150k); unused losses carry forward. On sale, claimed depreciation is recaptured at up to 25%, and gains may owe capital-gains tax (a 1031 exchange can defer both). Figures are a year-1 estimate at your 24.0% rate — not tax advice; consult a CPA.
Schools (NCES district)
- District
- Wilkes-Barre Area SD
- NCES district ID
- 4226300
- Math proficiency
- 19% ▼ -2.00%
- Reading proficiency
- 32% ▼ -9.00%
- Median HH income
- $37,420
- Composite
- 21.22/100
- National rank
- #8409
- State rank
- #469 of 539 in PA
Livability — Wilkes-Barre
No livability data for this city. (Only ~50 U.S. cities are tracked.)
Census & demographics
- Census place
- Wilkes-Barre, PA
- County
- Luzerne County · 118,885 people
- City population
- 73,981
- Metro
- Scranton--Wilkes-Barre, PA
- Population (ZIP)
- 41,970
- Household income
- $56,378
- Rent vs Own
- Severe rent burden
- 1632.0
Population outlook (Luzerne County) Hauer SSP2
- Today (2025)
- 319,505 people
- By 2030
- 319,943 · +0.1%
- By 2040
- 322,643 · +1.0%
- By 2050
- 330,817 · +3.5%
- By 2075
- 379,145 · +18.7%
- By 2100
- 431,908 · +35.2%
Race, ethnicity, and origin ACS 2023
- Neighborhood character
- Diverse neighborhood (Simpson 0.59)
- Race & ethnicity
- White 58% Hispanic / Latino 25% Black 12% Two or more races 11% Asian 2%
- Hispanic origin (detail)
- Mexican 6% Puerto Rican 6% Dominican 9%
- Common ancestry
- Romanian 14% Scotch-Irish 2% Iranian 1%
- Foreign-born
- 13% · Canada, Jamaica
- Languages at home
- 79% English-only · Spanish 17% Other Asian/Pacific 1% Other Indo-European 1%
Political lean MEDSL · Luzerne
- 2024 margin
- R (+19.2) · D 40.0% · R 59.2%
- 2008→2024 swing
- -27.6pp toward R · 2008: 8.4pp · 2024: -19.2pp
- All cycles
- 2024: R+19.2 2020: R+14.4 2016: R+19.6 2012: D+4.8 2008: D+8.4
Not yet ingested
- Civics
- —
Market trends
- HPI YoY
- ▼ -156.99%
- Current HPI
- 216.9373
- Rent YoY
- ▲ 6.84%
- Metro
- Scranton--Wilkes-Barre, PA
- State GDP YoY
- ▲ 1.68%
- F500 in state
- 34
Industry mix (Fortune 500 HQ in PA)
| Industry | F500 HQs | Revenue |
|---|---|---|
| Healthcare | 2 | $309B |
|
||
| Insurance | 2 | $27B |
|
||
| Telecommunications / Media | 1 | $124B |
|
||
| Industrial Distribution | 1 | $22B |
|
||
| Financial Services | 1 | $20B |
|
||
| Chemicals / Materials | 1 | $18B |
|
||
Price history
-22.1% since first listed6 events — show timeline
- 2026-06-09 Listing Removed — GLVRMLS
- 2026-06-06 Listed $109,000 GSBR as distributed by MLS GRID
- 2026-05-27 Price Changed $129,900 GLVRMLS
- 2026-05-27 Price Changed $129,900 PMAR
- 2026-04-16 Listed $139,900 PMAR
- 2026-04-15 Listed $139,900 GLVRMLS
Property tax history
+20.4%/yrLatest (2026): $7,812 · +0.1% YoY. Source: county tax records.
Cash-flow waterfall
monthlySold comps — $/sqft
last 12 mo · ≤1 miLoading sold comps…