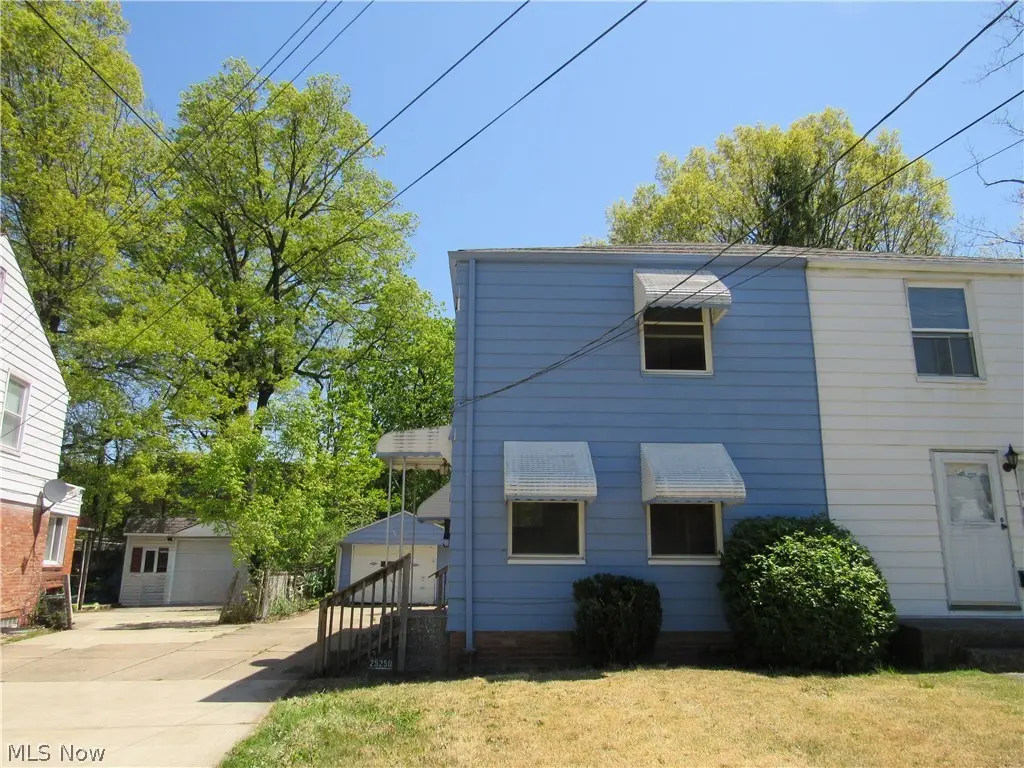
25250 Treadwell Ave · Euclid, OH
Flood risk 4/10 · Minor
- FEMA flood zone
- X (unshaded)
- Chance of flooding over 30 yrs
- 0.22%
- Est. flood insurance / yr
- $473 – $860
Fire risk 1/10 · Minimal
- Est. fire insurance / yr
- $713 – $1,323
Heat risk 3/10 · Minor
- Hot days now (above 95°F)
- 7 days/yr
- Hot days in 30 yrs
- 17 days/yr
Wind risk 1/10 · Minimal
- Chance of severe wind over 30 yrs
- —
Air-quality risk 3/10 · Minor
- Unhealthy air days now
- 3 days/yr
- Unhealthy air days in 30 yrs
- 4 days/yr
Risk factors via First Street. Map © Google.
Why this score? — see what drove the B grade
The composite is a weighted blend of 9 inputs, each scored 0–100. Each bar is that input's sub-score; the figure is the points it added to the 100-point composite (weight × sub-score).
- Cash flow +30.0/30.0
- ARV discount +13.2/15.0
- 1% rule +10.0/10.0
- DSCR +10.0/10.0
- Livability +3.9/5.0
- Rent growth +2.5/5.0
- Condition / age +2.5/5.0
- Schools +1.7/10.0
- Appreciation +0.0/10.0
$59,900
🖨 Deal sheet 📄 Offer letter ✓ Due diligence
Listing remarks MLS
Absolutly Mint! * Newer Kitchen * Beautifully Kept!shows Well!newer Carpeting!finished Rec Rm!clean And Neat!sharp Deck * * * Deep Lot!!
Key facts
- 4,621 sq ft lot
- Garage
- Built 1943
Property features AI
Exterior
- Parking: Detached garage with driveway (1 garage space)
- Utilities: Public water; Public sewer
- Home design: Two-story home; Attached property
- Construction: Aluminum siding; Asphalt/fiberglass roof; Built from public records
- Exterior features: Public water; Public sewer
Interior
- Kitchen: Kitchen on first floor
- Bedrooms: Two first-floor bedrooms
- Bathrooms: One full bathroom
- Heating & cooling: Central air conditioning; Forced air heating
- Interior features: Full basement
Neighborhood map
What this means for you Summary
Snapshot
- This is a 2-bed/1.0-bath single-family listed at $60k.
Deal economics
- At list price, monthly cash flow is $532 ($6k/yr) — positive.
- The deal already cash-flows at list — no discount required.
- Meets the 1% rule at list price ($1k rent vs $60k).
- Recommended offer: $59k (1.5% below list) — sets the bar for market timing.
- Cap rate 16.9% vs local median 6.8% in Euclid — top-decile yield for the area; either an underpriced asset or a hidden risk that comps aren't pricing in. Stress-test before assuming the spread holds.
Location & tenants
- Location reads 77/100 on livability (#204 in OH, #3,149 nationally) — a middle-class / working-renter tenant base. Strengths: cost of living A+, housing A+, crime B+; Watch: schools C-, commute F, employment D-.
- Euclid City (suburban): math 14% / reading 28% proficiency, ranked #625 of 656 in OH (top 95%) — low school quality limits family demand, transient renter base, plan for 1-2y turnover; 70% free/reduced lunch — lower-income household profile, screen leases tightly.
- Market conditions: 33 active listings in the ZIP; 29 comparable units currently listed for rent nearby; rentals at typical pace (median 24d on market — plan ~3-4 weeks tenant-placement turnaround); lower-income renter base — watch delinquency; 1,441 units permitted in Cuyahoga County in 2024 (700 in 5+ unit buildings).
- This rent runs 35% of the median local income ($43k/yr) — at the standard rent-burdened threshold; future hikes will face affordability resistance.
Forward outlook
- Local home prices are declining (-3.0%/yr); year-one equity from $414 of loan paydown is wiped out by about $2k of value loss. Plan a longer hold.
- Cuyahoga County population projected to shrink 8% by 2050 — rents likely to lag national; underwrite the cash flow, not the appreciation.
- At projected returns (-3.0% appreciation + 3.0% rent growth), your $17k cash investment doubles in ~4 years — after that, you're playing with house money.
Negotiation context
- It's been on market 25 days — a 2% lower offer ($59k) is reasonable based on typical stale-listing flexibility.
- 2 sale attempts since 26y ago with the ask held roughly flat each time — persistent listings suggest the price (not the market) is what's stuck; bring a comps-based counter.
Risks & watch-outs
- Watch-outs: property tax is 2.7% of price; built in 1943 — expect roof / HVAC / electrical / plumbing capex.
Questions for the listing agent
- Built in 1943 — when were the roof, HVAC, electrical panel, plumbing, and water heater last replaced?
- Property tax is high relative to price — has the assessment been appealed recently, and will the sale trigger a re-assessment?
- Is there a deadline driving the sale (1031 exchange, divorce, estate, relocation)? That informs how much negotiation room exists.
- What's the average days-on-market for RENTAL listings here right now (not sales)? A rising rental-DOM trend means longer vacancies and softer asking-rent achievability than the comps imply.
- What's the recent tenant-quality profile in this submarket — average credit score on applications, eviction rate, late-payment / NSF rate, and stable-employment percentage? A property-management company in the area should have these aggregated.
- How much new for-sale + rental construction is in the pipeline within 1–3 miles? Heavy new supply typically softens prices + rents 12–24 months out; constrained supply supports both.
Investment metrics
- 1% rule
- 2.12% ✓
- Cap rate
- 16.94%
- Cash-on-cash
- 38.03%
- DSCR
- 2.69
- GRM
- 3.9
CMA / ARV
- ARV (median comp)
- $68,556
- List price
- $59,900
- Delta
- -12.63%
- Verdict
- UNDERPRICED
- Comps
- 20 within 1.0 mi
Show comp detail 11 sales within ~0.75 mi
| Address | Dist | Beds/Ba | Sqft | Sold | Price | $/sf | Match |
|---|---|---|---|---|---|---|---|
| 1527 Babbitt Rd | 0.18mi | 2/1.0 | 858 (0%) | 1mo | $73,000 | $85 | 91 |
| 25170 Treadwell Ave | 0.04mi | 2/1.0 | 832 (-3%) | 13mo | $72,000 | $87 | 82 |
| 24891 Fisher Ave | 0.16mi | 2/1.0 | 858 (0%) | 15mo | $77,000 | $90 | 80 |
| 1551 Babbitt Rd | 0.17mi | 2/1.0 | 884 (+3%) | 9mo | $100,000 | $113 | 79 |
| 1462 E 250th St | 0.11mi | 2/1.0 | 853 (-1%) | 18mo | $65,000 | $76 | 79 |
| 1501 E 248th St | 0.12mi | 2/1.0 | 948 (+10%) | 7mo | $87,000 | $92 | 71 |
| 1461 E 252nd St | 0.10mi | 2/1.0 | 832 (-3%) | 24mo | $62,000 | $75 | 71 |
| 1538 E 256th St | 0.26mi | 2/1.0 | 832 (-3%) | 22mo | $58,000 | $70 | 65 |
| 1477 E 256th St | 0.38mi | 2/1.0 | 858 (0%) | 21mo | $48,500 | $57 | 65 |
| 25550 Tungsten Rd | 0.39mi | 2/1.0 | 958 (+12%) | 6mo | $76,500 | $80 | 57 |
| 1497 E 256th St | 0.36mi | 2/1.5 | 970 (+13%) | 18mo | $76,400 | $79 | 44 |
Match score weights: distance 35% · size 25% · config 20% · recency 20%. Top-matched comps best support the ARV.
Projected returns pro-forma
-3.0% appreciation · 3.0% rent growth · sell at horizon
- IRR
- 34.1%
- Equity multiple
- 2.44×
- Total profit
- $24,203
- Equity at exit
- $8,931
- IRR
- 41.0%
- Equity multiple
- 4.87×
- Total profit
- $64,894
- Equity at exit
- $5,179
Cash invested: $16,772 (down + closing). Projections, not guarantees.
Landlord ↔ Tenant lean methodology
- Overall (STATE)
- 73 Landlord-Friendly
- State Ohio
- 73 Landlord-Friendly · R+6
- County
- — inherits STATE
- City
- — inherits STATE
ZIP-level market 44117
- Home prices YoY
- -9.8%
- Active inventory
- 33
- Price-to-rent
- 3.9×
Monthly cashflow live
- Estimated rent
- $1,271 high interval (Pro) →
- Mortgage (P&I)
- −$314
- Tax from tax record
- −$134 /mo · $1,604/yr
- Insurance
- −$25
- HOA
- −$0
- Vacancy / Maint / Mgmt
- −$267
- Net cashflow
- $532
Break-even live
UW: 25.0% down · 7.5% · 30yr · 1.5% tax · 5.0% vac · 8.0% maint · 8.0% mgmt
Financing live
Cash to close
- Down payment
- $14,975
- Closing costs
- $1,797
- Reserves months
- —
- Total cash needed
- —
Loan-product check · same deal, 3 products live
Conventional
25% down · 7.5% · 30yr
- Down + closing
- —
- Monthly P&I
- —
- Monthly cashflow
- —
- DSCR
- —
- Eligible?
- —
Personal DTI + credit; lowest rate.
DSCR
20% down · 8.5% · 30yr
- Down + closing
- —
- Monthly P&I
- —
- Monthly cashflow
- —
- DSCR
- —
- Eligible?
- —
No personal income docs; deal must DSCR.
Hard money
10% down · 12.0% · 12mo
- Down + closing
- —
- Monthly P&I
- —
- Monthly cashflow
- —
- DSCR
- —
- Eligible?
- —
Short-term bridge; refi at stabilization.
Rent comps 29 comps
| Address | Beds | Baths | Sqft | Rent | $/sqft | DOM | Units | Dist |
|---|---|---|---|---|---|---|---|---|
| 1554 E 256th St Euclid, OH | 2.0 | 2.0 | 1062 | $1,250 | $1.18 | 23d | 1 | 0.22mi |
| 1550 E 256th St Euclid, OH | 3.0 | 1.0 | 1054 | $1,700 | $1.61 | 1d | 1 | 0.22mi |
| 1517 E 256th St Euclid, OH | 3.0 | 1.0 | 1002 | $1,300 | $1.30 | 23d | 1 | 0.32mi |
| 24630 Euclid Ave Euclid, OH | 2.0 | 1.0 | 750 | $1,100 | $1.47 | 10d | 1 | 0.35mi |
| 26251 Brush Ave Euclid, OH | 2.0–3.0 | 1.0 | 769 | $1,200 | $1.56 | 1d | 2 | 0.58mi |
| 24130 Euclid Ave Euclid, OH | 2.0 | 1.0 | 725 | $1,200 | $1.66 | 16d | 2 | 0.62mi |
| 26640 Tungsten Rd Euclid, OH | 2.0 | 1.0 | 779 | $1,100 | $1.41 | 43d | 1 | 0.73mi |
| 26660 Tungsten Rd Apt 102 Euclid, OH | 1.0 | 1.0 | 750 | $1,095 | $1.46 | 4d | 1 | 0.74mi |
| 26660 Tungsten Rd Unit 105 Euclid, OH | 2.0 | 1.0 | 900 | $1,195 | $1.33 | 4d | 1 | 0.74mi |
| 26700 Tungsten Rd Unit TN 202 Euclid, OH | 2.0 | 1.0 | 779 | $1,200 | $1.54 | 43d | 1 | 0.77mi |
| 961 E 224th St Euclid, OH | 3.0 | 1.0 | 1034 | $1,300 | $1.26 | 16d | 1 | 0.90mi |
| 824 E 236th St Euclid, OH | 3.0 | 2.0 | 1100 | $1,720 | $1.56 | 1d | 1 | 0.97mi |
| 22501 Arms Ave Euclid, OH | 3.0 | 1.0 | 1044 | $1,350 | $1.29 | 23d | 1 | 0.98mi |
| 27800 Euclid Ave Unit Euclid 35 -Hillandale Apts-306 Euclid, OH | 2.0 | 1.0 | 750 | $950 | $1.27 | 7d | 1 | 1.12mi |
| 27800 Euclid Ave Unit Euclid 35 Parkhill Apts-5 Euclid, OH | 3.0 | 1.5 | 755 | $1,200 | $1.59 | 43d | 1 | 1.12mi |
| 927 E 216th St Unit 1 Euclid, OH | 2.0 | 1.0 | 850 | $1,147 | $1.35 | 4d | 1 | 1.14mi |
| 681 Babbitt Rd Euclid, OH | 1.0 | 1.0 | 684 | $1,000 | $1.46 | 43d | 1 | 1.16mi |
| 22550 Euclid Ave Unit 212 Euclid, OH | 1.0 | 1.0 | 548 | $1,000 | $1.82 | 43d | 1 | 1.18mi |
| 22550 Euclid Ave Unit 207 Euclid, OH | 2.0 | 1.0 | 888 | $1,279 | $1.44 | 43d | 1 | 1.18mi |
| 27000 Bishop Park Dr Willoughby Hills, OH | 1.0–2.0 | 1.0–1.5 | 805 | $1,255 | $1.56 | 23d | 1 | 1.21mi |
| 871 E 212th St Cleveland, OH | 3.0 | 1.5 | 1092 | $1,399 | $1.28 | 43d | 1 | 1.26mi |
| 22250 Euclid Ave Euclid, OH | 1.0 | 1.0 | 695 | $995 | $1.43 | 23d | 2 | 1.30mi |
| 21301 Arbor Ave Euclid, OH | 3.0 | 1.0 | 1050 | $1,450 | $1.38 | 20d | 1 | 1.34mi |
| 24200 Puritan Rd Euclid, OH | 3.0 | 1.0 | 1100 | $1,199 | $1.09 | 12d | 1 | 1.36mi |
| 22140 Euclid Ave Euclid, OH | 1.0 | 1.0 | 675 | $929 | $1.38 | 43d | 3 | 1.36mi |
| 521 E 222nd St Euclid, OH | 2.0 | 1.0 | 800 | $1,500 | $1.88 | 23d | 1 | 1.45mi |
| 20664 Miller Ave Unit Down Unit Euclid, OH | 3.0 | 2.0 | 1100 | $1,200 | $1.09 | 43d | 1 | 1.48mi |
| 488 E 222nd St Unit Up Euclid, OH | 2.0 | 1.0 | 900 | $1,100 | $1.22 | 21d | 1 | 1.49mi |
| 20990 Morris Ave Euclid, OH | 3.0 | 1.0 | 778 | $1,355 | $1.74 | 43d | 1 | 1.49mi |
Listing history 9 events
-
2026-06-03status $59,900 Pending 25 DOM
-
2026-06-02days on market $59,900 Active 25 DOM
-
2026-06-01days on market $59,900 Active 24 DOM
-
2026-05-31days on market $59,900 Active 23 DOM
-
2026-05-08$59,900 Active 797-char remark
-
2000-05-10soldstatus $56,500 138-char remark
Show marketing remark (138 chars)
Absolutly Mint! * Newer Kitchen * Beautifully Kept!shows Well!newer Carpeting!finished Rec Rm!clean And Neat!sharp Deck * * * Deep Lot!!
-
2000-05-09soldstatus $56,500
-
2000-03-12$56,900 138-char remark
Show marketing remark (138 chars)
Absolutly Mint! * Newer Kitchen * Beautifully Kept!shows Well!newer Carpeting!finished Rec Rm!clean And Neat!sharp Deck * * * Deep Lot!!
-
1976-02-01soldstatus $22,900
ⓘ Source: listings_history table (triggers on properties + properties_extension) + one-shot
backfill from property_details.listing_events for pre-trigger history.
Tax reassessment forecast OH · Partial reset (capped growth)
- Current annual tax
- $1,604 · $134/mo
- Projected year-2 tax
- $1,604 · $134/mo
- Expected delta
- $0/yr ($0/mo · 0.0%)
ⓘ Screening estimate from a state-policy table — verify with the county assessor before closing.
Climate risk First Street
- Flood 4/10 Moderate FEMA zone X (unshaded) · 22% chance over 30 yrs
- Wildfire 1/10 Low
- Heat 3/10 Moderate 7 d/yr ≥95°F today · 17 d/yr by 30 yrs out
- Wind 1/10 Low
- Air quality 3/10 Moderate 3 unhealthy d/yr today · 4 by 30 yrs out
Nearby sold comps map
Loading sold comps map…
Walkable amenities ~0.75 mi
Loading nearby amenities…
Taxation est. · year 1
- Rental income
- $15,255
- − Mortgage interest
- −$3,355
- − Property taxes
- −$1,604
- − Insurance
- −$300
- − Repairs & maintenance
- −$1,220
- − Management
- −$1,220
- − Depreciation
- −$1,743
- Taxable income
- $5,813
- Est. tax owed @ 24.0%
- −$1,395
- After-tax cash flow
- $4,983/yr
For passive investors: Depreciation is non-cash, so a rental often shows a tax loss while cash-flowing — sheltering income. Rental losses are passive: they offset passive income freely, and up to $25,000/yr can offset ordinary (W-2) income if you actively participate and your MAGI is under $100k (phasing out to $0 by $150k); unused losses carry forward. On sale, claimed depreciation is recaptured at up to 25%, and gains may owe capital-gains tax (a 1031 exchange can defer both). Figures are a year-1 estimate at your 24.0% rate — not tax advice; consult a CPA.
Schools (NCES district)
- District
- Euclid City
- NCES district ID
- 3904395
- Math proficiency
- 14% ▼ -19.00%
- Reading proficiency
- 28% ▼ -14.00%
- Median HH income
- $36,385
- Composite
- 17.39/100
- National rank
- #9067
- State rank
- #625 of 656 in OH
Livability — Euclid
- Score
- 77/100
- State rank
- #204
- US rank
- #3149
Category grades
Schools grade is shown separately in the Schools card above.
Census & demographics
- Census place
- Euclid, OH
- County
- Cuyahoga County · 1,090,369 people
- City population
- 41,855
- Metro
- Cleveland-Elyria, OH
- Population (ZIP)
- 9,172
- Household income
- $43,013
- Rent vs Own
- Severe rent burden
- 970.0
Population outlook (Cuyahoga County) Hauer SSP2
- Today (2025)
- 1,244,621 people
- By 2030
- 1,230,093 · -1.2%
- By 2040
- 1,189,108 · -4.5%
- By 2050
- 1,145,706 · -7.9%
- By 2075
- 1,076,557 · -13.5%
- By 2100
- 978,987 · -21.3%
Race, ethnicity, and origin ACS 2023
- Neighborhood character
- Predominantly Black (71%)
- Race & ethnicity
- Black 71% White 22% Two or more races 4% Hispanic / Latino 3%
- Common ancestry
- Lithuanian 2% Romanian 1% Serbian 1%
- Foreign-born
- 2%
- Languages at home
- 96% English-only · Spanish 2% French/Haitian/Cajun 1% Tagalog/Filipino 1%
Political lean MEDSL · Cuyahoga
- 2024 margin
- Solid D (+31.5) · D 65.4% · R 33.9%
- 2008→2024 swing
- -7.4pp toward R · 2008: 38.9pp · 2024: 31.5pp
- All cycles
- 2024: D+31.5 2020: D+34.1 2016: D+35.0 2012: D+38.7 2008: D+38.9
Not yet ingested
- Civics
- —
Market trends
- HPI YoY
- ▼ -23.42%
- Current HPI
- 214.6784
- Rent YoY
- —
- Metro
- Cleveland-Elyria, OH
- State GDP YoY
- ▲ 1.98%
- F500 in state
- 48
Industry mix (Fortune 500 HQ in OH)
| Industry | F500 HQs | Revenue |
|---|---|---|
| Insurance | 3 | $145B |
|
||
| Industrial Machinery | 3 | $49B |
|
||
| Financial Services | 3 | $24B |
|
||
| Consumer Goods | 2 | $93B |
|
||
| Aerospace / Defense | 2 | $47B |
|
||
| Utilities | 2 | $33B |
|
||
Price history
+161.6% since first listed6 events — show timeline
- 2026-06-02 Pending — MLSNOW
- 2026-05-08 Listed $59,900 MLSNOW
- 2000-05-10 Sold (MLS) $56,500 MLSNOW
- 2000-05-09 Sold (Public Records) $56,500 Public Records
- 2000-03-12 Listed $56,900 MLSNOW
- 1976-02-01 Sold (Public Records) $22,900 Public Records
Property tax history
+1.3%/yrLatest (2025): $1,604 · -3.2% YoY. Source: county tax records.
Cash-flow waterfall
monthlySold comps — $/sqft
last 12 mo · ≤1 miLoading sold comps…