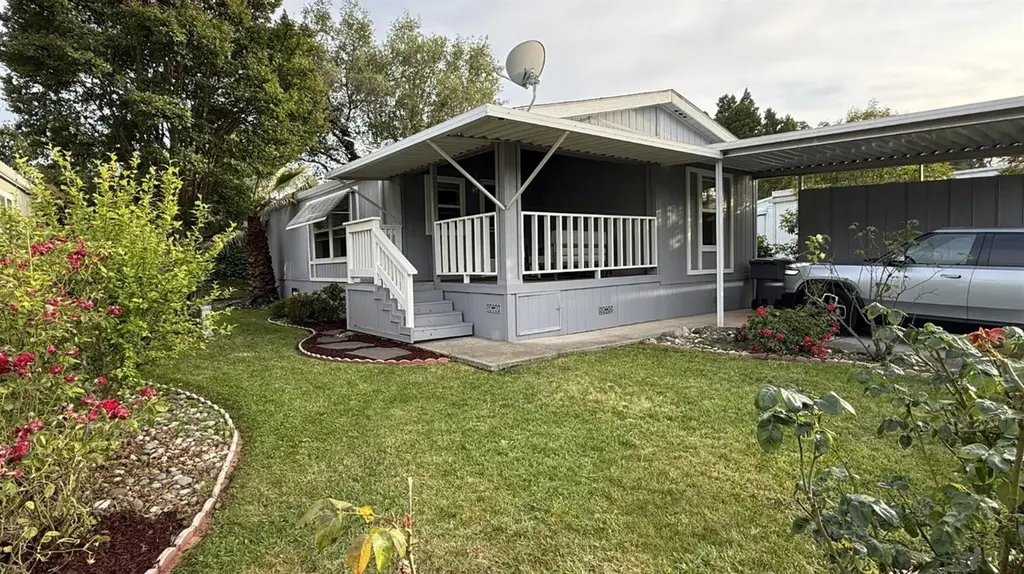
33 Primrose Ave · North Auburn, CA
Flood risk 6/10 · Moderate
- FEMA flood zone
- X (unshaded)
- Chance of flooding over 30 yrs
- 0.72%
- Est. flood insurance / yr
- $507 – $1,088
Fire risk 10/10 · Severe
- Est. fire insurance / yr
- $659 – $1,223
Heat risk 6/10 · Moderate
- Hot days now (above 99°F)
- 6 days/yr
- Hot days in 30 yrs
- 14 days/yr
Wind risk 1/10 · Minimal
- Chance of severe wind over 30 yrs
- —
Air-quality risk 10/10 · Severe
- Unhealthy air days now
- 34 days/yr
- Unhealthy air days in 30 yrs
- 41 days/yr
Risk factors via First Street. Map © Google.
Why this score? — see what drove the B+ grade
The composite is a weighted blend of 9 inputs, each scored 0–100. Each bar is that input's sub-score; the figure is the points it added to the 100-point composite (weight × sub-score).
- Cash flow +30.0/30.0
- ARV discount +12.0/15.0
- 1% rule +10.0/10.0
- DSCR +10.0/10.0
- Schools +4.9/10.0
- Condition / age +3.8/5.0
- Rent growth +3.1/5.0
- Livability +3.1/5.0
- Appreciation +0.0/10.0
$108,000
🖨 Deal sheet 📄 Offer letter ✓ Due diligence
Listing remarks
Edgewood Mobile Home Park is a well maintained park that has recently become an All-Age Community! Welcome to a home with charm and character. The entry to this home offers a delightfully raised deck allowing for outside entertaining or just quietly taking in the nicely landscaped front yard. You enter the home into an open-beamed, vaulted ceiling great room. The bedrooms are nicely located at opposite ends of the home providing privacy. Just over a year ago, the home was painted both inside and out and new vinyl plank flooring added. Approximately three years ago a new HVAC system was installed and kitchen appliances were upgraded. The stack washer/dryer and refrigerator transfer with sale
Key facts
- Raised deck
- New hvac system
- Parking
Tags
Property features AI
Finance
- Other: Land lease: No (listed land lease amount present in source but excluded per instructions)
- HOA & community: No homeowners association; Not a senior community
Exterior
- Parking: Covered parking, no garage
- Utilities: Cable available; Internet available; Master electric meter; 220V in kitchen; 220V in laundry; Public water; Public sewer
- Home design: Manufactured home in park (double wide); Built in 1996
- Construction: Composition roof; Wood skirting; Karsten manufactured home
- Exterior features: Front yard with landscaping; Covered deck
Interior
- Kitchen: Free standing gas range; Free standing refrigerator; Dishwasher; Microwave; Breakfast area
- Bedrooms: 2 bedrooms
- Flooring: Carpet
- Bathrooms: 2 full bathrooms; Tub with shower over
- Heating & cooling: Central heating; Central air; Ceiling fans
- Interior features: Cathedral/vaulted great room; Covered deck; Pantry cabinet; Laminate kitchen counters; Dining bar / dining-living combo; Furnished negotiable; Pets allowed
- Laundry & utility: Stacked washer/dryer included inside the home
Neighborhood map
What this means for you Summary
Snapshot
- This is a 2-bed/2.0-bath manufactured listed at $108k. Condition is rated good.
Deal economics
- At list price, monthly cash flow is $874 ($10k/yr) — positive.
- The deal already cash-flows at list — no discount required.
- Meets the 1% rule at list price ($2k rent vs $108k).
- Cap rate 16.0% vs local median 2.6% in North Auburn — top-decile yield for the area; either an underpriced asset or a hidden risk that comps aren't pricing in. Stress-test before assuming the spread holds.
Location & tenants
- Location reads 61/100 on livability (#519 in CA) — a middle-class / working-renter tenant base. Strengths: employment A-, housing A-; Watch: schools F, crime D-, amenities F.
- Placer Union High (suburban): math 39% / reading 72% proficiency, ranked #98 of 517 in CA (top 19%) — acceptable for families but not a draw, mixed tenant base, ~2y average lease.
- Market conditions: Rents rising (+2.3%/yr); 204 active listings in the ZIP; 8 comparable units currently listed for rent nearby; rentals leasing fast (median 2d on market — plan ~1-2 weeks tenant-placement turnaround); solid renter incomes; 3,535 units permitted in Placer County in 2024 (689 in 5+ unit buildings).
Forward outlook
- Local home prices are declining (-3.0%/yr); year-one equity from $747 of loan paydown is wiped out by about $3k of value loss. Plan a longer hold.
- Placer County population projected at +20% by 2050 — long-run rental-demand tailwind backs the buy-and-hold thesis.
- At projected returns (-3.0% appreciation + 2.3% rent growth), your $30k cash investment doubles in ~4 years — after that, you're playing with house money.
Negotiation context
- Only 8 days on market — expect competitive offers; lowballing is unlikely to land.
Risks & watch-outs
- Climate carrying-cost: major flood risk; severe wildfire risk; extreme-heat days projected 6→14/yr by 2055 (HVAC capex compounding) — expect insurance premiums to compound above CPI over the hold.
Questions for the listing agent
- Is there a deadline driving the sale (1031 exchange, divorce, estate, relocation)? That informs how much negotiation room exists.
- Schools are F-rated, which usually means shorter tenancies and higher turnover. Who's the typical renter profile here, and what's been the actual vacancy rate?
- Crime grade is D in this area — have there been break-ins, vandalism, or insurance claims at this property in the last 3 years? What carrier currently insures it and at what premium?
- What's the average days-on-market for RENTAL listings here right now (not sales)? A rising rental-DOM trend means longer vacancies and softer asking-rent achievability than the comps imply.
- What's the recent tenant-quality profile in this submarket — average credit score on applications, eviction rate, late-payment / NSF rate, and stable-employment percentage? A property-management company in the area should have these aggregated.
- How much new for-sale + rental construction is in the pipeline within 1–3 miles? Heavy new supply typically softens prices + rents 12–24 months out; constrained supply supports both.
Investment metrics
- 1% rule
- 1.90% ✓
- Cap rate
- 16.01%
- Cash-on-cash
- 34.69%
- DSCR
- 2.54
- GRM
- 4.4
CMA / ARV
- ARV (on-the-fly)
- $120,000
- Comps found
- 12
Show comp detail 12 sales within ~0.75 mi
| Address | Dist | Beds/Ba | Sqft | Sold | Price | $/sf | Match |
|---|---|---|---|---|---|---|---|
| 110 Marigold Ave #110 | 0.13mi | 3/— (+1) | 1,190 (-1%) | 6mo | $140,000 | $118 | 82 |
| 99 Marigold Ave #99 | 0.11mi | 2/2.0 | 1,052 (-12%) | 0mo | $125,000 | $119 | 74 |
| 1605 Grass Valley Hwy #84 | 0.35mi | 2/2.0 | 1,246 (+4%) | 14mo | $125,000 | $100 | 66 |
| 1514 Cottonwood Cir #8 | 0.52mi | 2/2.0 | 1,152 (-4%) | 5mo | $99,000 | $86 | 65 |
| 1605 Grass Valley Hwy #46 | 0.33mi | 2/2.0 | 1,344 (+12%) | 2mo | $47,000 | $35 | 63 |
| 12202 Hemlock Dr | 0.59mi | 2/2.0 | 1,152 (-4%) | 6mo | $120,000 | $104 | 61 |
| 12366 Pepperwood Cir #182 | 0.66mi | 2/2.0 | 1,248 (+4%) | 3mo | $110,000 | $88 | 60 |
| 12207 Hemlock Dr #99 | 0.62mi | 2/2.0 | 1,248 (+4%) | 10mo | $120,000 | $96 | 56 |
| 1608 Spruce Ct | 0.62mi | 2/2.0 | 1,152 (-4%) | 10mo | $125,000 | $109 | 56 |
| 12339 Pepperwood #12339 | 0.70mi | 2/2.0 | 1,344 (+12%) | 2mo | $112,000 | $83 | 45 |
| 1524 Tulip Cir #66 | 0.59mi | 2/2.0 | 1,344 (+12%) | 10mo | $150,000 | $112 | 44 |
| 12019 Hemlock Dr #150 | 0.56mi | 3/2.0 (+1) | 1,344 (+12%) | 9mo | $121,000 | $90 | 41 |
Match score weights: distance 35% · size 25% · config 20% · recency 20%. Top-matched comps best support the ARV.
Projected returns pro-forma
-3.0% appreciation · 2.34% rent growth · sell at horizon
- IRR
- 29.4%
- Equity multiple
- 2.22×
- Total profit
- $36,862
- Equity at exit
- $16,103
- IRR
- 36.4%
- Equity multiple
- 4.26×
- Total profit
- $98,447
- Equity at exit
- $9,338
Cash invested: $30,240 (down + closing). Projections, not guarantees.
Landlord ↔ Tenant lean methodology
- Overall (STATE)
- 18 Strongly Tenant-Friendly
- State California
- 18 Strongly Tenant-Friendly · D+13
- County
- — inherits STATE
- City
- — inherits STATE
ZIP-level market 95603
- Rents YoY
- 2.3%
- Active inventory
- 204
- Price-to-rent
- 4.4×
Monthly cashflow live
- Estimated rent
- $2,051 high interval (Pro) →
- Mortgage (P&I)
- −$566
- Tax est. 1.5%
- −$135 /mo · $1,620/yr
- Insurance
- −$45
- HOA
- −$0
- Vacancy / Maint / Mgmt
- −$431
- Net cashflow
- $874
Break-even live
UW: 25.0% down · 7.5% · 30yr · 1.5% tax · 5.0% vac · 8.0% maint · 8.0% mgmt
Financing live
Cash to close
- Down payment
- $27,000
- Closing costs
- $3,240
- Reserves months
- —
- Total cash needed
- —
Loan-product check · same deal, 3 products live
Conventional
25% down · 7.5% · 30yr
- Down + closing
- —
- Monthly P&I
- —
- Monthly cashflow
- —
- DSCR
- —
- Eligible?
- —
Personal DTI + credit; lowest rate.
DSCR
20% down · 8.5% · 30yr
- Down + closing
- —
- Monthly P&I
- —
- Monthly cashflow
- —
- DSCR
- —
- Eligible?
- —
No personal income docs; deal must DSCR.
Hard money
10% down · 12.0% · 12mo
- Down + closing
- —
- Monthly P&I
- —
- Monthly cashflow
- —
- DSCR
- —
- Eligible?
- —
Short-term bridge; refi at stabilization.
Rent comps 8 comps
| Address | Beds | Baths | Sqft | Rent | $/sqft | DOM | Units | Dist |
|---|---|---|---|---|---|---|---|---|
| 731 Mikkelsen Dr Auburn, CA | 2.0 | 2.0 | 1006 | $2,150 | $2.14 | 1d | 1 | 1.03mi |
| 327 Nevada St Apt 4 Auburn, CA | 1.0 | 1.0 | 800 | $1,350 | $1.69 | 1d | 1 | 1.09mi |
| 11754 Jones St Unit 11754 Auburn, CA | 1.0 | 1.0 | 700 | $1,595 | $2.28 | 3d | 1 | 1.16mi |
| 11752 Jones St Unit 11752 Auburn, CA | 2.0 | 1.0 | 815 | $1,795 | $2.20 | 10d | 1 | 1.16mi |
| 630 Shockley Rd Auburn, CA | 3.0 | 2.0 | 1100 | $2,495 | $2.27 | 1d | 1 | 1.20mi |
| 560 Landis Cir Auburn, CA | 2.0 | 1.0 | 1188 | $2,550 | $2.15 | 1d | 1 | 1.23mi |
| 203 E Electric St Auburn, CA | 2.0 | 1.0 | 1100 | $1,625 | $1.48 | 1d | 1 | 1.30mi |
| 356 Chamberlain Ave Unit A Auburn, CA | 2.0 | 1.0 | 700 | $2,100 | $3.00 | 16d | 1 | 1.45mi |
Climate risk First Street
- Flood 6/10 Major FEMA zone X (unshaded) · 72% chance over 30 yrs
- Wildfire 10/10 Extreme
- Heat 6/10 Major 6 d/yr ≥99°F today · 14 d/yr by 30 yrs out
- Wind 1/10 Low
- Air quality 10/10 Extreme 34 unhealthy d/yr today · 41 by 30 yrs out
Nearby sold comps map
Loading sold comps map…
Walkable amenities ~0.75 mi
Loading nearby amenities…
Taxation est. · year 1
- Rental income
- $24,618
- − Mortgage interest
- −$6,050
- − Property taxes
- −$1,620
- − Insurance
- −$540
- − Repairs & maintenance
- −$1,969
- − Management
- −$1,969
- − Depreciation
- −$3,142
- Taxable income
- $9,327
- Est. tax owed @ 24.0%
- −$2,239
- After-tax cash flow
- $8,253/yr
For passive investors: Depreciation is non-cash, so a rental often shows a tax loss while cash-flowing — sheltering income. Rental losses are passive: they offset passive income freely, and up to $25,000/yr can offset ordinary (W-2) income if you actively participate and your MAGI is under $100k (phasing out to $0 by $150k); unused losses carry forward. On sale, claimed depreciation is recaptured at up to 25%, and gains may owe capital-gains tax (a 1031 exchange can defer both). Figures are a year-1 estimate at your 24.0% rate — not tax advice; consult a CPA.
Condition & rehab AI · 12 photos
This mobile home is in good condition with recent updates, including new flooring and appliances. It has a well-maintained exterior and landscaping, making it a good candidate for a cosmetic rehab to enhance its resale and rental value.
Value-add opportunities
- Resale Painting the exterior — Enhances curb appeal and value
- Resale Landscaping improvements — Enhances curb appeal and value
- Both Kitchen backsplash — Improves aesthetics and functionality
- Both New lighting fixtures — Enhances curb appeal and functionality
Renovation cost estimate screening
Value-add ROI direction
- Resale Painting the exterior — Enhances curb appeal and value ↑
- Resale Landscaping improvements — Enhances curb appeal and value ↑
- Both Kitchen backsplash — Improves aesthetics and functionality ↑
- Both New lighting fixtures — Enhances curb appeal and functionality ↑
ⓘ Cost ranges are severity-bucket heuristics (US national rule-of-thumb). Get contractor quotes + a written scope before underwriting a rehab budget.
Schools (NCES district)
- District
- Placer Union High
- NCES district ID
- 0630750
- Math proficiency
- 39% ▲ 1.00%
- Reading proficiency
- 72% ▲ 3.00%
- Median HH income
- $69,119
- Composite
- 49.04/100
- National rank
- #2060
- State rank
- #98 of 517 in CA
Livability — North Auburn
- Score
- 61/100
- State rank
- #519
- US rank
- #17512
Category grades
Schools grade is shown separately in the Schools card above.
Census & demographics
- Census place
- North Auburn, CA
- County
- Placer County · 390,510 people
- City population
- 28,195
- Metro
- Sacramento-Roseville-Folsom, CA
- Population (ZIP)
- 28,432
- Household income
- $85,357
- Rent vs Own
- Severe rent burden
- 1017.0
Population outlook (Placer County) Hauer SSP2
- Today (2025)
- 422,709 people
- By 2030
- 444,249 · +5.1%
- By 2040
- 480,192 · +13.6%
- By 2050
- 506,390 · +19.8%
- By 2075
- 550,219 · +30.2%
- By 2100
- 547,760 · +29.6%
Race, ethnicity, and origin ACS 2023
- Neighborhood character
- Predominantly White (73%)
- Race & ethnicity
- White 73% Hispanic / Latino 17% Two or more races 11% Asian 3%
- Hispanic origin (detail)
- Mexican 12%
- Common ancestry
- Italian 3% Slovak 3% Lithuanian 2%
- Foreign-born
- 9% · Canada, South Korea
- Languages at home
- 88% English-only · Spanish 10% Other Indo-European 1% Tagalog/Filipino 1%
Political lean MEDSL · Placer
- 2024 margin
- Lean R (+8.5) · D 44.3% · R 52.8% · Other 2.9%
- 2008→2024 swing
- +2.8pp toward D · 2008: -11.3pp · 2024: -8.5pp
- All cycles
- 2024: R+8.5 2020: R+6.7 2016: R+11.3 2012: R+20.1 2008: R+11.3
Not yet ingested
- Civics
- —
Market trends
- HPI YoY
- ▼ -500.89%
- Current HPI
- 251.4573
- Rent YoY
- ▲ 2.34%
- Metro
- Sacramento-Roseville-Folsom, CA
- State GDP YoY
- ▲ 3.21%
- F500 in state
- 116
Industry mix (Fortune 500 HQ in CA)
| Industry | F500 HQs | Revenue |
|---|---|---|
| Technology | 27 | $1,492B |
|
||
| Financial Services | 3 | $174B |
|
||
| Retail | 3 | $44B |
|
||
| Insurance | 3 | $26B |
|
||
| Media / Entertainment | 2 | $115B |
|
||
| Pharmaceuticals / Biotech | 2 | $62B |
|
||
Cash-flow waterfall
monthlySold comps — $/sqft
last 12 mo · ≤1 miLoading sold comps…