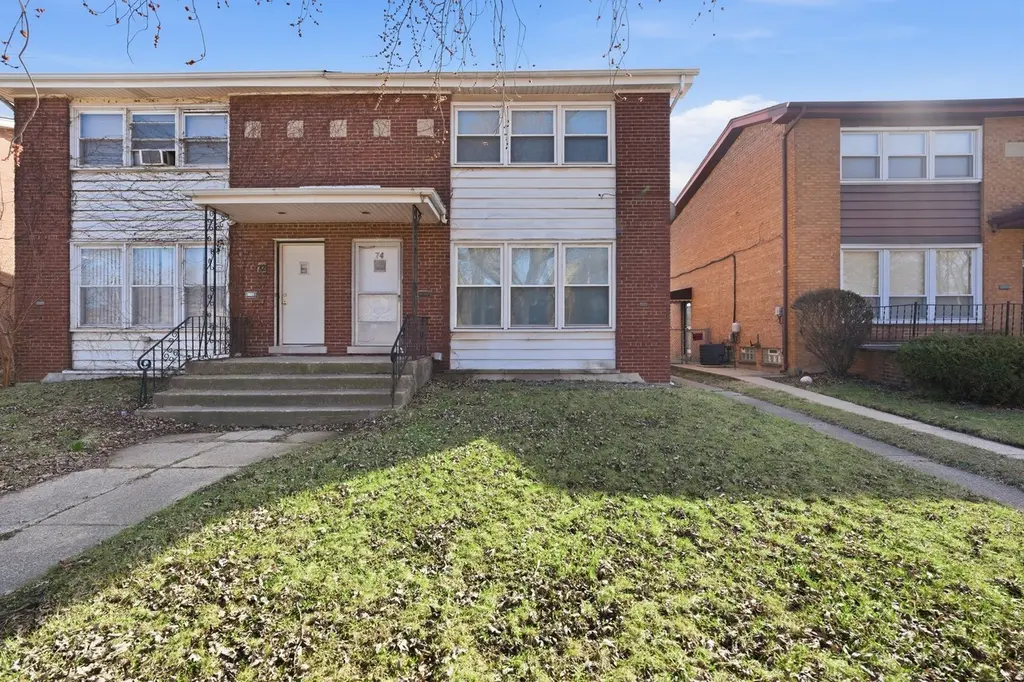
74 W 140th St · Riverdale, IL
Flood risk 1/10 · Minimal
- FEMA flood zone
- X (unshaded)
- Chance of flooding over 30 yrs
- 0.0%
- Est. flood insurance / yr
- $473 – $860
Fire risk 1/10 · Minimal
- Est. fire insurance / yr
- $804 – $1,492
Heat risk 3/10 · Minor
- Hot days now (above 101°F)
- 7 days/yr
- Hot days in 30 yrs
- 15 days/yr
Wind risk 2/10 · Minimal
- Chance of severe wind over 30 yrs
- —
Air-quality risk 4/10 · Minor
- Unhealthy air days now
- 4 days/yr
- Unhealthy air days in 30 yrs
- 5 days/yr
Risk factors via First Street. Map © Google.
Why this score? — see what drove the B- grade
The composite is a weighted blend of 9 inputs, each scored 0–100. Each bar is that input's sub-score; the figure is the points it added to the 100-point composite (weight × sub-score).
- Cash flow +30.0/30.0
- 1% rule +10.0/10.0
- DSCR +10.0/10.0
- ARV discount +7.5/15.0
- Rent growth +4.5/5.0
- Livability +3.5/5.0
- Condition / age +2.5/5.0
- Schools +0.7/10.0
- Appreciation +0.0/10.0
$118,000
🖨 Deal sheet 📄 Offer letter ✓ Due diligence
Listing remarks
Comfort and style on this 3 bedroom and 1.5 bath updated townhome. Spacious living room with tons of natural light and beautiful hardwood floors. Large eat in kitchen with beautiful white cabinets with lots of storage, appliances from 2021, new countertops and island. Large Master Bedroom with 2 closets and 2 nice size bedrooms with hardwood floors throughout. Basement for storage and laundry, new sump pump. Large fenced yard. NO HOA. Close to Metra station. Shopping & retail. Parks & forest preserves, Little Calumet River. Access to 57 / 94 / 294 that'll take you to the surrounding suburbs, or the city. PROPERTY IS BEING SOLD AS-IS
Key facts
- White cabinets
- Fenced yard
- Eat in kitchen
Tags
Property features AI
Finance
- Other: Two-unit building; Estimated living area; School bus service available
- HOA & community: Master association fee not required; Pets allowed (cats and dogs), maximum pet weight 100 lbs
Exterior
- Utilities: Water source: Lake Michigan; Public sewer
- Home design: Attached single, 1/2 duplex; Entry level on level 1; Fee simple ownership; Rehabilitated in 2021
- Construction: Brick construction; Built 61-70 years ago; Property built before 1978
- Exterior features: Common grounds
Interior
- Kitchen: Stone flooring in the kitchen; Kitchen on the main level
- Bedrooms: Three bedrooms (master and two additional bedrooms on the second level)
- Flooring: Stone flooring (kitchen)
- Bathrooms: One full bathroom; One half bathroom
- Heating & cooling: Natural gas heating
- Interior features: Unfinished partial basement; Five total rooms; All windows have window treatments
- Laundry & utility: Laundry room
Neighborhood map
What this means for you Summary
Snapshot
- This is a 3-bed/1.5-bath townhouse listed at $118k.
Deal economics
- At list price, monthly cash flow is $563 ($7k/yr) — positive.
- The deal already cash-flows at list — no discount required.
- Meets the 1% rule at list price ($2k rent vs $118k).
- Cap rate 12.0% vs local median 9.5% in Riverdale — meaningfully above typical; check what's discounted (condition, days-on-market, listing class) to confirm the premium yield is real.
Location & tenants
- Location reads 69/100 on livability (#434 in IL) — a middle-class / working-renter tenant base. Strengths: commute A+, cost of living A+, housing A-; Watch: health & safety C-, schools F, crime F.
- Thornton Twp Hsd 205 (suburban): math 7% / reading 8% proficiency, ranked #594 of 620 in IL (top 96%) — low school quality limits family demand, transient renter base, plan for 1-2y turnover.
- Market conditions: Rents rising fast (+7.8%/yr); 76 active listings in the ZIP; 7 comparable units currently listed for rent nearby; rentals at typical pace (median 25d on market — plan ~3-4 weeks tenant-placement turnaround); lower-income renter base — watch delinquency; 6,272 units permitted in Cook County in 2024 (4,658 in 5+ unit buildings).
- At $1,882/mo this rent would consume 61% of the median local household income ($37k/yr) (locally 1868% of renters already pay >50% of income on rent) — very limited rent-growth headroom before tenants either downsize or default.
Forward outlook
- Local home prices are declining (-3.0%/yr); year-one equity from $816 of loan paydown is wiped out by about $4k of value loss. Plan a longer hold.
- At projected returns (-3.0% appreciation + 7.8% rent growth), your $33k cash investment doubles in ~5 years — after that, you're playing with house money.
Negotiation context
- Only 14 days on market — expect competitive offers; lowballing is unlikely to land.
- 3 sale attempts since 10y ago; this cycle's ask is 37% above the opening price — seller raised mid-cycle; expect resistance to lowballs.
- Current owner paid $96k; 23% above their basis — modest negotiation headroom, anchor on the comps not their cost.
Risks & watch-outs
- Watch-outs: property tax is 2.6% of price.
Questions for the listing agent
- Built in 1961 — when were the roof, HVAC, electrical panel, plumbing, and water heater last replaced?
- Property tax is high relative to price — has the assessment been appealed recently, and will the sale trigger a re-assessment?
- Is there a deadline driving the sale (1031 exchange, divorce, estate, relocation)? That informs how much negotiation room exists.
- Schools are F-rated, which usually means shorter tenancies and higher turnover. Who's the typical renter profile here, and what's been the actual vacancy rate?
- Crime grade is F in this area — have there been break-ins, vandalism, or insurance claims at this property in the last 3 years? What carrier currently insures it and at what premium?
- What's the average days-on-market for RENTAL listings here right now (not sales)? A rising rental-DOM trend means longer vacancies and softer asking-rent achievability than the comps imply.
- What's the recent tenant-quality profile in this submarket — average credit score on applications, eviction rate, late-payment / NSF rate, and stable-employment percentage? A property-management company in the area should have these aggregated.
- How much new for-sale + rental construction is in the pipeline within 1–3 miles? Heavy new supply typically softens prices + rents 12–24 months out; constrained supply supports both.
Investment metrics
- 1% rule
- 1.59% ✓
- Cap rate
- 12.02%
- Cash-on-cash
- 20.44%
- DSCR
- 1.91
- GRM
- 5.2
CMA / ARV
- ARV (on-the-fly)
- $41,664
- Comps found
- 3
Show comp detail 3 sales within ~0.75 mi
| Address | Dist | Beds/Ba | Sqft | Sold | Price | $/sf | Match |
|---|---|---|---|---|---|---|---|
| 13936 S Clark St | 0.05mi | 3/1.5 | 1,350 (+0%) | 14mo | $65,000 | $48 | 85 |
| 13710 S Wallace Ave #0 | 0.71mi | 3/1.5 | 1,363 (+1%) | 6mo | $35,000 | $26 | 59 |
| 462 W Pacesetter Pkwy | 0.57mi | 3/1.5 | 1,243 (-8%) | 20mo | $38,000 | $31 | 44 |
Match score weights: distance 35% · size 25% · config 20% · recency 20%. Top-matched comps best support the ARV.
Projected returns pro-forma
-3.0% appreciation · 7.82% rent growth · sell at horizon
- IRR
- 18.5%
- Equity multiple
- 1.80×
- Total profit
- $26,382
- Equity at exit
- $17,594
- IRR
- 30.3%
- Equity multiple
- 4.42×
- Total profit
- $112,894
- Equity at exit
- $10,202
Cash invested: $33,040 (down + closing). Projections, not guarantees.
Landlord ↔ Tenant lean methodology
- Overall (STATE)
- 43 Moderately Tenant-Leaning
- State Illinois
- 43 Moderately Tenant-Leaning · D+7
- County
- — inherits STATE
- City
- — inherits STATE
ZIP-level market 60827
- Home prices YoY
- -31.8%
- Rents YoY
- 7.8%
- Active inventory
- 76
- Price-to-rent
- 5.2×
Monthly cashflow live
- Estimated rent
- $1,882 high interval (Pro) →
- Mortgage (P&I)
- −$619
- Tax from tax record
- −$256 /mo · $3,070/yr
- Insurance
- −$49
- HOA
- −$0
- Vacancy / Maint / Mgmt
- −$395
- Net cashflow
- $563
Break-even live
UW: 25.0% down · 7.5% · 30yr · 1.5% tax · 5.0% vac · 8.0% maint · 8.0% mgmt
Financing live
Cash to close
- Down payment
- $29,500
- Closing costs
- $3,540
- Reserves months
- —
- Total cash needed
- —
Loan-product check · same deal, 3 products live
Conventional
25% down · 7.5% · 30yr
- Down + closing
- —
- Monthly P&I
- —
- Monthly cashflow
- —
- DSCR
- —
- Eligible?
- —
Personal DTI + credit; lowest rate.
DSCR
20% down · 8.5% · 30yr
- Down + closing
- —
- Monthly P&I
- —
- Monthly cashflow
- —
- DSCR
- —
- Eligible?
- —
No personal income docs; deal must DSCR.
Hard money
10% down · 12.0% · 12mo
- Down + closing
- —
- Monthly P&I
- —
- Monthly cashflow
- —
- DSCR
- —
- Eligible?
- —
Short-term bridge; refi at stabilization.
Rent comps 7 comps
| Address | Beds | Baths | Sqft | Rent | $/sqft | DOM | Units | Dist |
|---|---|---|---|---|---|---|---|---|
| 13708 S Wentworth Ave Riverdale, IL | 3.0 | 1.5 | 1500 | $2,200 | $1.47 | 22d | 1 | 0.37mi |
| 13604 S Wentworth Ave Riverdale, IL | 3.0 | 1.0 | 1100 | $1,200 | $1.09 | 24d | 1 | 0.48mi |
| 14124 Manor Ave Dolton, IL | 3.0 | 2.0 | 1440 | $2,390 | $1.66 | 24d | 1 | 0.52mi |
| 13841 Forest Ave Dolton, IL | 3.0 | 1.0 | 930 | $1,895 | $2.04 | 24d | 1 | 0.69mi |
| 14844 Wabash Ave Dolton, IL | 3.0 | 1.5 | 1277 | $2,320 | $1.82 | 24d | 1 | 1.14mi |
| 14305 Irving Ave Unit 2 Dolton, IL | 3.0 | 1.0 | 1100 | $2,200 | $2.00 | 24d | 1 | 1.19mi |
| 14500 Cottage Grove Ave Unit 3 Dolton, IL | 2.0 | 1.0 | 1000 | $1,475 | $1.48 | 24d | 1 | 1.47mi |
Listing history 10 events
-
2026-06-18days on market $118,000 Active 14 DOM
-
2026-06-17days on market $118,000 Active 13 DOM
-
2026-06-16days on market $118,000 Active 12 DOM
-
2026-06-15days on market $118,000 Active 11 DOM
-
2026-06-13days on market $118,000 Active 9 DOM
-
2026-06-13days on market $118,000 Active 8 DOM
-
2026-06-09days on market $118,000 Active 5 DOM
-
2026-06-08days on market $118,000 Active 4 DOM
-
2026-06-07remarks 644-char remark
-
2026-06-07$118,000 Active 3 DOM
ⓘ Source: listings_history table (triggers on properties + properties_extension) + one-shot
backfill from property_details.listing_events for pre-trigger history.
Tax reassessment forecast IL · Partial reset (capped growth)
- Current annual tax
- $3,070 · $256/mo
- Projected year-2 tax
- $3,070 · $256/mo
- Expected delta
- $0/yr ($0/mo · 0.0%)
ⓘ Screening estimate from a state-policy table — verify with the county assessor before closing.
Climate risk First Street
- Flood 1/10 Low FEMA zone X (unshaded) · 0% chance over 30 yrs
- Wildfire 1/10 Low
- Heat 3/10 Moderate 7 d/yr ≥101°F today · 15 d/yr by 30 yrs out
- Wind 2/10 Low
- Air quality 4/10 Moderate 4 unhealthy d/yr today · 5 by 30 yrs out
Nearby sold comps map
Loading sold comps map…
Walkable amenities ~0.75 mi
Loading nearby amenities…
Taxation est. · year 1
- Rental income
- $22,580
- − Mortgage interest
- −$6,610
- − Property taxes
- −$3,070
- − Insurance
- −$590
- − Repairs & maintenance
- −$1,806
- − Management
- −$1,806
- − Depreciation
- −$3,433
- Taxable income
- $5,264
- Est. tax owed @ 24.0%
- −$1,263
- After-tax cash flow
- $5,489/yr
For passive investors: Depreciation is non-cash, so a rental often shows a tax loss while cash-flowing — sheltering income. Rental losses are passive: they offset passive income freely, and up to $25,000/yr can offset ordinary (W-2) income if you actively participate and your MAGI is under $100k (phasing out to $0 by $150k); unused losses carry forward. On sale, claimed depreciation is recaptured at up to 25%, and gains may owe capital-gains tax (a 1031 exchange can defer both). Figures are a year-1 estimate at your 24.0% rate — not tax advice; consult a CPA.
Schools (NCES district)
- District
- Thornton Twp Hsd 205
- NCES district ID
- 1738970
- Math proficiency
- 7% ▬ 0.00%
- Reading proficiency
- 8% ▼ -2.00%
- Median HH income
- $43,392
- Composite
- 6.92/100
- National rank
- #9976
- State rank
- #594 of 620 in IL
Livability — Riverdale
- Score
- 69/100
- State rank
- #434
- US rank
- #8867
Category grades
Schools grade is shown separately in the Schools card above.
Census & demographics
- Census place
- Riverdale, IL
- County
- Cook County · 4,486,803 people
- City population
- 24,713
- Metro
- Chicago-Naperville-Elgin, IL-IN-WI
- Population (ZIP)
- 24,713
- Household income
- $37,217
- Rent vs Own
- Severe rent burden
- 1868.0
Population outlook (Cook County) Hauer SSP2
- Today (2025)
- 5,347,519 people
- By 2030
- 5,357,703 · +0.2%
- By 2040
- 5,324,924 · -0.4%
- By 2050
- 5,230,762 · -2.2%
- By 2075
- 4,785,735 · -10.5%
- By 2100
- 4,188,836 · -21.7%
Race, ethnicity, and origin ACS 2023
- Neighborhood character
- Predominantly Black (88%)
- Race & ethnicity
- Black 88% Two or more races 5% Hispanic / Latino 5% White 2%
- Common ancestry
- Iranian 1%
- Foreign-born
- 2% · Canada
- Languages at home
- 96% English-only · Spanish 3%
Political lean MEDSL · Cook
- 2024 margin
- Solid D (+42.0) · D 70.4% · R 28.4% · Other 1.2%
- 2008→2024 swing
- -11.4pp toward R · 2008: 53.4pp · 2024: 42.0pp
- All cycles
- 2024: D+42.0 2020: D+50.3 2016: D+53.0 2012: D+49.4 2008: D+53.4
Not yet ingested
- Civics
- —
Market trends
- HPI YoY
- ▼ -76.39%
- Current HPI
- 163.7725
- Rent YoY
- ▲ 7.82%
- Metro
- Chicago-Naperville-Elgin, IL-IN-WI
- State GDP YoY
- ▲ 1.59%
- F500 in state
- 60
Industry mix (Fortune 500 HQ in IL)
| Industry | F500 HQs | Revenue |
|---|---|---|
| Insurance | 4 | $201B |
|
||
| Consumer Goods | 4 | $87B |
|
||
| Industrial Machinery | 3 | $64B |
|
||
| Healthcare | 2 | $55B |
|
||
| Retail / Pharmacy | 1 | $148B |
|
||
| Agriculture / Food | 1 | $86B |
|
||
Price history
+284.0% since first listed13 events — show timeline
- 2026-05-26 Listing Removed — MRED as Distributed by MLS Grid
- 2026-04-21 Contingent — MRED as Distributed by MLS Grid
- 2026-04-20 Listing Removed — MRED as Distributed by MLS Grid
- 2026-03-16 Listed — MRED as Distributed by MLS Grid
- 2021-11-30 Sold (Public Records) $96,000 Public Records
- 2021-11-19 Sold (MLS) $96,000 MRED as Distributed by MLS Grid
- 2021-08-30 Pending — MRED as Distributed by MLS Grid
- 2021-08-25 Listing Removed — MRED as Distributed by MLS Grid
- 2021-08-16 Listed $86,000 MRED as Distributed by MLS Grid
- 2016-09-21 Sold (MLS) $16,500 MRED as Distributed by MLS Grid
- 2016-08-30 Contingent — MRED as Distributed by MLS Grid
- 2016-08-04 Price Changed $19,000 MRED as Distributed by MLS Grid
- 2016-07-18 Listed $25,000 MRED as Distributed by MLS Grid
Property tax history
-0.9%/yrLatest (2023): $3,070 · -35.5% YoY. Source: county tax records.
Cash-flow waterfall
monthlySold comps — $/sqft
last 12 mo · ≤1 miLoading sold comps…