 Duplex
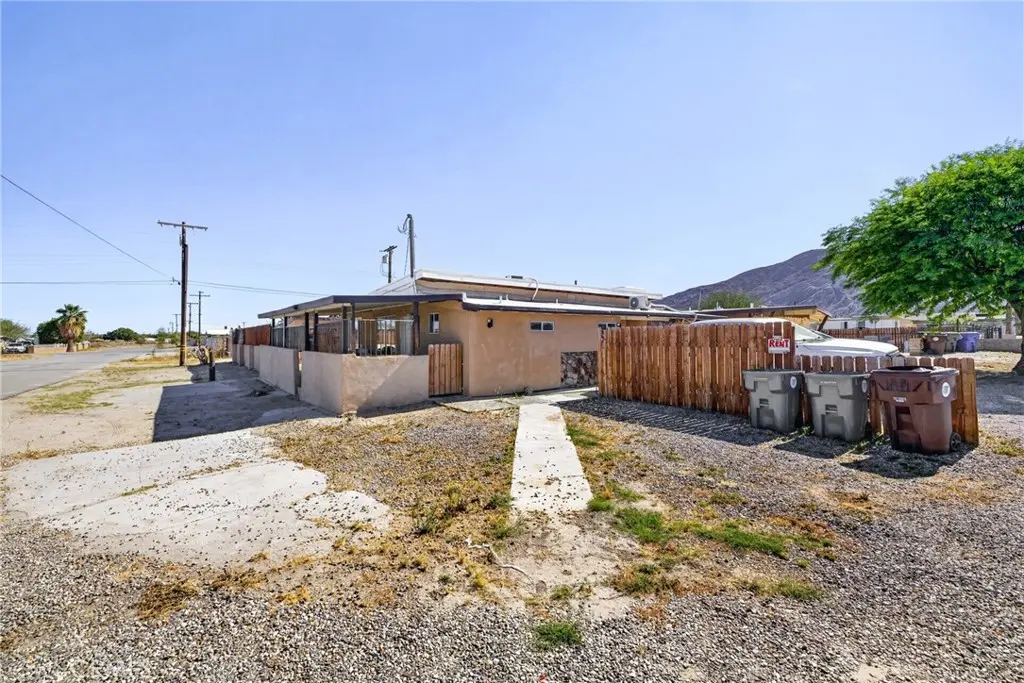
81 Panorama · Desert Shores, CA
Flood risk 1/10 · Minimal
- FEMA flood zone
- X (unshaded)
- Chance of flooding over 30 yrs
- 0.0%
- Est. flood insurance / yr
- $507 – $1,088
Fire risk 3/10 · Minor
- Est. fire insurance / yr
- $659 – $1,223
Heat risk 10/10 · Severe
- Hot days now (above 114°F)
- 7 days/yr
- Hot days in 30 yrs
- 21 days/yr
Wind risk 1/10 · Minimal
- Chance of severe wind over 30 yrs
- —
Air-quality risk 2/10 · Minimal
- Unhealthy air days now
- 2 days/yr
- Unhealthy air days in 30 yrs
- 2 days/yr
Risk factors via First Street. Map © Google.
Why this score? — see what drove the B grade
The composite is a weighted blend of 9 inputs, each scored 0–100. Each bar is that input's sub-score; the figure is the points it added to the 100-point composite (weight × sub-score).
- Cash flow +30.0/30.0
- DSCR +10.0/10.0
- Appreciation +10.0/10.0
- 1% rule +8.7/10.0
- ARV discount +7.5/15.0
- Rent growth +2.5/5.0
- Condition / age +2.5/5.0
- Schools +1.5/10.0
- Livability +1.4/5.0
$325,000
🖨 Deal sheet 📄 Offer letter ✓ Due diligence
Multi-family units
County records classify this as Multi-Family (5+ Unit). Listing-text estimate: 2 units. estimate disagrees with records
5+ unit building — per-unit beds/baths from public records are typically unavailable; the breakdown below (if shown) is an estimate from the listing text.
Listing remarks MLS
Rare Multi-Property Investment Opportunity – 2 Adjacent Income-Producing Properties Near Salton Sea! Don’t miss this unique opportunity to acquire two side-by-side income properties offering strong cash flow and long-term upside. 81 Panorama Dr features 4 studio units plus a 2-bedroom, 1-bath unit, totaling 6 bedrooms, along with 4 separate electric meters. 83 Panorama Dr includes one 2-bedroom, 1-bath unit, one 1-bedroom, 1-bath unit, and one studio unit, serviced by 1 electric meter. Combined, this portfolio delivers a diverse unit mix ideal for maximizing occupancy and rental income across multiple tenant profiles. Located near the Salton Sea, a well-known tourist destination, and within close proximity to casinos, golf courses, and major local employers, these properties are perfectly positioned for employee housing and long-term rentals. High demand from workers in nearby hospitality, service, and resort industries makes this an attractive and stable income investment. Ideal for investors looking to scale their portfolio with a multi-property acquisition, or for owner-users seeking to live in one unit while generating income from the rest. Opportunities like this—two adjacent, income-producing properties—are rare. Don’t miss out!
Key facts
- Diverse unit mix
- Proximity to casinos
- Long-term rentals
Tags
Neighborhood map
What this means for you Summary
Snapshot
- This is a 2 × 3-bed/?-bath units multifamily listed at $325k.
Deal economics
- At list price, monthly cash flow is $1k ($15k/yr) — positive. Per door: $644/mo.
- The deal already cash-flows at list — no discount required.
- Meets the 1% rule at list price ($4k rent vs $325k).
- Recommended offer: $315k (3.0% below list) — sets the bar for market timing.
Location & tenants
- Location reads 28/100 on livability (#1,479 in CA) — a limited-amenity area; tenant pool skews transient or value-seeking. Strengths: crime A; Watch: cost of living D, schools F, amenities F.
- Coachella Valley Unified (rural): math 12% / reading 23% proficiency, ranked #481 of 517 in CA (top 93%) — low school quality limits family demand, transient renter base, plan for 1-2y turnover; 79% free/reduced lunch — lower-income household profile, screen leases tightly.
- Market conditions: 492 active listings in the ZIP; 271 units permitted in Imperial County in 2024 (112 in 5+ unit buildings).
Forward outlook
- In year one you build about $35k of equity ($2k loan paydown + $32k appreciation (10.0% local appreciation)).
- Imperial County population projected at +7% by 2050 — modest demand growth; plan on rents tracking national, not racing it.
- At projected returns (10.0% appreciation + 3.0% rent growth), your $91k cash investment doubles in ~2 years — after that, you're playing with house money.
- By year 2, paydown + projected appreciation supports a ~$56k cash-out refi (75% LTV) — recoverable capital for the next deal without selling this one.
Negotiation context
- It's been on market 57 days — a 3% lower offer ($315k) is reasonable based on typical stale-listing flexibility.
- 6 sale attempts since 12y ago; this cycle's ask has dropped $25k (7%) from the opening price — seller is motivated, your offer sets the floor, not the list.
- Current owner paid $70k; list at $325k implies a 364% gain — meaningful room to come down on a strong offer.
Risks & watch-outs
- Climate carrying-cost: extreme-heat days projected 7→21/yr by 2055 (HVAC capex compounding) — expect insurance premiums to compound above CPI over the hold.
Questions for the listing agent
- It's been on market 57 days. Have you received any prior offers? Is the seller open to a 3% concession, seller financing, or rate buy-down credit?
- Can we see the unit-by-unit rent roll, current vacancy, and any below-market leases? What's the average tenancy length?
- What capital expenditures (roof, boiler, parking lot, exteriors) have been made in the last 5 years, and what's planned in the next 2?
- Built in 1965 — when were the roof, HVAC, electrical panel, plumbing, and water heater last replaced?
- Is there a deadline driving the sale (1031 exchange, divorce, estate, relocation)? That informs how much negotiation room exists.
- Schools are F-rated, which usually means shorter tenancies and higher turnover. Who's the typical renter profile here, and what's been the actual vacancy rate?
- What's the average days-on-market for RENTAL listings here right now (not sales)? A rising rental-DOM trend means longer vacancies and softer asking-rent achievability than the comps imply.
- What's the recent tenant-quality profile in this submarket — average credit score on applications, eviction rate, late-payment / NSF rate, and stable-employment percentage? A property-management company in the area should have these aggregated.
- How much new apartment / multifamily construction is in the pipeline within 1–3 miles? Heavy new supply (>2% of stock underway) typically softens rents 12–24 months out; light construction supports rent growth.
Investment metrics
- 1% rule
- 1.37% ✓
- Cap rate
- 11.05%
- Cash-on-cash
- 16.98%
- DSCR
- 1.76
- GRM
- 6.1
CMA / ARV
No comps found within radius.
Projected returns pro-forma
10.0% appreciation · 3.0% rent growth · sell at horizon
- IRR
- 36.9%
- Equity multiple
- 3.85×
- Total profit
- $259,067
- Equity at exit
- $292,786
- IRR
- 31.8%
- Equity multiple
- 8.68×
- Total profit
- $698,543
- Equity at exit
- $631,404
Cash invested: $91,000 (down + closing). Projections, not guarantees.
Landlord ↔ Tenant lean methodology
- Overall (STATE)
- 18 Strongly Tenant-Friendly
- State California
- 18 Strongly Tenant-Friendly · D+13
- County
- — inherits STATE
- City
- — inherits STATE
ZIP-level market 92274
- Home prices YoY
- 31.9%
- Active inventory
- 492
- Price-to-rent
- 12.1×
Monthly cashflow live
- Estimated rent
- $4,459 medium interval (Pro) →
- Mortgage (P&I)
- −$1,704
- Tax from tax record
- −$395 /mo · $4,744/yr
- Insurance
- −$135
- HOA
- −$0
- Vacancy / Maint / Mgmt
- −$936
- Net cashflow
- $1,288
Break-even live
2-unit breakdown (identical units grouped — click to expand)
| Units | Beds | Baths | Est. rent |
|---|---|---|---|
| 2× units | 3 | — | $4,460 |
| #1 | 3 | — | $2,230 |
| #2 | 3 | — | $2,230 |
| Total (2 units) | $4,459 | ||
UW: 25.0% down · 7.5% · 30yr · 1.5% tax · 5.0% vac · 8.0% maint · 8.0% mgmt
Financing live
Cash to close
- Down payment
- $81,250
- Closing costs
- $9,750
- Reserves months
- —
- Total cash needed
- —
Loan-product check · same deal, 3 products live
Conventional
25% down · 7.5% · 30yr
- Down + closing
- —
- Monthly P&I
- —
- Monthly cashflow
- —
- DSCR
- —
- Eligible?
- —
Personal DTI + credit; lowest rate.
DSCR
20% down · 8.5% · 30yr
- Down + closing
- —
- Monthly P&I
- —
- Monthly cashflow
- —
- DSCR
- —
- Eligible?
- —
No personal income docs; deal must DSCR.
Hard money
10% down · 12.0% · 12mo
- Down + closing
- —
- Monthly P&I
- —
- Monthly cashflow
- —
- DSCR
- —
- Eligible?
- —
Short-term bridge; refi at stabilization.
Listing history 27 events
-
2026-06-18days on market $325,000 Active 57 DOM
-
2026-06-17days on market $325,000 Active 56 DOM
-
2026-06-16days on market $325,000 Active 55 DOM
-
2026-06-15days on market $325,000 Active 54 DOM
-
2026-06-13days on market $325,000 Active 52 DOM
-
2026-06-13days on market $325,000 Active 51 DOM
-
2026-06-09days on market $325,000 Active 48 DOM
-
2026-06-08days on market $325,000 Active 47 DOM
-
2026-06-07days on market $325,000 Active 46 DOM
-
2026-06-04days on market $325,000 Active 43 DOM
-
2026-06-03days on market $325,000 Active 42 DOM
-
2026-06-02days on market $325,000 Active 41 DOM
-
2026-06-01days on market $325,000 Active 40 DOM
-
2026-05-31days on market $325,000 Active 39 DOM
-
2026-04-22$350,000 Active 1287-char remark
Show marketing remark (1287 chars)
Rare Multi-Property Investment Opportunity – 2 Adjacent Income-Producing Properties Near Salton Sea! Don’t miss this unique opportunity to acquire two side-by-side income properties offering strong cash flow and long-term upside. 81 Panorama Dr features 4 studio units plus a 2-bedroom, 1-bath unit, totaling 6 bedrooms, along with 4 separate electric meters. 83 Panorama Dr includes one 2-bedroom, 1-bath unit, one 1-bedroom, 1-bath unit, and one studio unit, serviced by 1 electric meter. Combined, this portfolio delivers a diverse unit mix ideal for maximizing occupancy and rental income across multiple tenant profiles. Located near the Salton Sea, a well-known tourist destination, and within close proximity to casinos, golf courses, and major local employers, these properties are perfectly positioned for employee housing and long-term rentals. High demand from workers in nearby hospitality, service, and resort industries makes this an attractive and stable income investment. Ideal for investors looking to scale their portfolio with a multi-property acquisition, or for owner-users seeking to live in one unit while generating income from the rest. Opportunities like this—two adjacent, income-producing properties—are rare. Don’t miss out!
-
2025-10-16historical
-
2025-04-24$715,000 Active
-
2021-07-01historical
-
2021-03-26$299,000
-
2020-10-07historical
-
2019-10-23historical
-
2019-09-26$220,000
-
2019-09-24historical Hold
-
2019-09-06$330,000 Active
-
2014-07-17$130,000
-
2014-04-04soldstatus $70,000
-
1991-05-06soldstatus $48,000
ⓘ Source: listings_history table (triggers on properties + properties_extension) + one-shot
backfill from property_details.listing_events for pre-trigger history.
Tax reassessment forecast CA · Resets to sale price
- Current annual tax
- $4,744 · $395/mo
- Projected year-2 tax
- $4,744 · $395/mo
- Expected delta
- $0/yr ($0/mo · 0.0%)
ⓘ Screening estimate from a state-policy table — verify with the county assessor before closing.
Climate risk First Street
- Flood 1/10 Low FEMA zone X (unshaded) · 0% chance over 30 yrs
- Wildfire 3/10 Moderate
- Heat 10/10 Extreme 7 d/yr ≥114°F today · 21 d/yr by 30 yrs out
- Wind 1/10 Low
- Air quality 2/10 Low 2 unhealthy d/yr today · 2 by 30 yrs out
Nearby sold comps map
Loading sold comps map…
Walkable amenities ~0.75 mi
Loading nearby amenities…
Taxation est. · year 1
- Rental income
- $53,508
- − Mortgage interest
- −$18,205
- − Property taxes
- −$4,744
- − Insurance
- −$1,625
- − Repairs & maintenance
- −$4,281
- − Management
- −$4,281
- − Depreciation
- −$9,455
- Taxable income
- $10,918
- Est. tax owed @ 24.0%
- −$2,620
- After-tax cash flow
- $12,830/yr
For passive investors: Depreciation is non-cash, so a rental often shows a tax loss while cash-flowing — sheltering income. Rental losses are passive: they offset passive income freely, and up to $25,000/yr can offset ordinary (W-2) income if you actively participate and your MAGI is under $100k (phasing out to $0 by $150k); unused losses carry forward. On sale, claimed depreciation is recaptured at up to 25%, and gains may owe capital-gains tax (a 1031 exchange can defer both). Figures are a year-1 estimate at your 24.0% rate — not tax advice; consult a CPA.
Schools (NCES district)
- District
- Coachella Valley Unified
- NCES district ID
- 0609070
- Math proficiency
- 12% ▼ -8.00%
- Reading proficiency
- 23% ▼ -6.00%
- Median HH income
- $37,683
- Composite
- 14.62/100
- National rank
- #9408
- State rank
- #481 of 517 in CA
Livability — Desert Shores
- Score
- 28/100
- State rank
- #1479
- US rank
- #27964
Category grades
Schools grade is shown separately in the Schools card above.
Census & demographics
- Census place
- Desert Shores, CA
- Population (ZIP)
- 17,909
Population outlook (Imperial County) Hauer SSP2
- Today (2025)
- 186,713 people
- By 2030
- 190,022 · +1.8%
- By 2040
- 195,993 · +5.0%
- By 2050
- 199,534 · +6.9%
- By 2075
- 216,878 · +16.2%
- By 2100
- 352,705 · +88.9%
Race, ethnicity, and origin ACS 2023
- Neighborhood character
- Predominantly Hispanic (88%)
- Race & ethnicity
- Hispanic / Latino 88% Two or more races 49% White 10%
- Hispanic origin (detail)
- Mexican 87%
- Common ancestry
- Italian 1% Portuguese 1%
- Foreign-born
- 42% · Canada
- Languages at home
- 24% English-only · Spanish 76%
Political lean MEDSL · Imperial
- 2024 margin
- Toss-up / Even · D 48.3% · R 49.1% · Other 2.6%
- 2008→2024 swing
- -27.0pp toward R · 2008: 26.2pp · 2024: -0.9pp
- All cycles
- 2024: R+0.9 2020: D+24.4 2016: D+41.1 2012: D+28.8 2008: D+26.2
Not yet ingested
- Civics
- —
Market trends
- HPI YoY
- ▲ 179.97%
- Current HPI
- 744.8454
- Rent YoY
- —
- Metro
- —
- State GDP YoY
- ▲ 3.21%
- F500 in state
- 116
Industry mix (Fortune 500 HQ in CA)
| Industry | F500 HQs | Revenue |
|---|---|---|
| Technology | 27 | $1,492B |
|
||
| Financial Services | 3 | $174B |
|
||
| Retail | 3 | $44B |
|
||
| Insurance | 3 | $26B |
|
||
| Media / Entertainment | 2 | $115B |
|
||
| Pharmaceuticals / Biotech | 2 | $62B |
|
||
Price history
+629.2% since first listed13 events — show timeline
- 2026-04-22 Listed $350,000 CRMLS
- 2025-10-16 Listing Removed — GPSMLS
- 2025-04-24 Listed $715,000 GPSMLS
- 2021-07-01 Listing Removed — GPSMLS
- 2021-03-26 Listed $299,000 GPSMLS
- 2020-10-07 Listing Removed — GPSMLS
- 2019-10-23 Listing Removed — GPSMLS
- 2019-09-26 Listed $220,000 GPSMLS
- 2019-09-24 Delisted — GPSMLS
- 2019-09-06 Listed $330,000 GPSMLS
- 2014-07-17 Listed $130,000 GPSMLS
- 2014-04-04 Sold (Public Records) $70,000 Public Records
- 1991-05-06 Sold (Public Records) $48,000 Public Records
Property tax history
+8.3%/yrLatest (2025): $4,744 · +3.6% YoY. Source: county tax records.
Cash-flow waterfall
monthlySold comps — $/sqft
last 12 mo · ≤1 miLoading sold comps…