 🏗️ New Construction
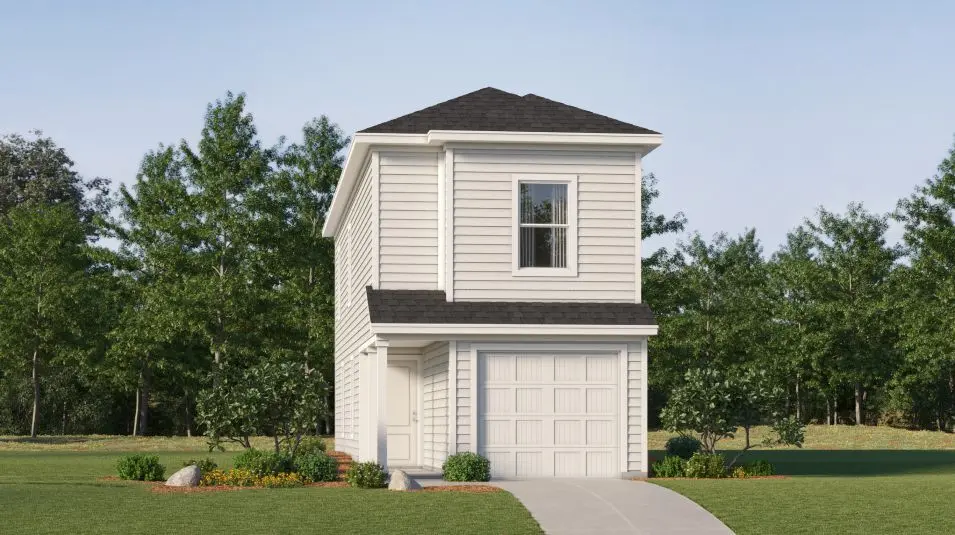
Baja Plan · San Antonio, TX
Flood risk 1/10 · Minimal
- FEMA flood zone
- X (unshaded)
- Chance of flooding over 30 yrs
- 0.0%
- Est. flood insurance / yr
- $507 – $1,088
Fire risk 2/10 · Minimal
- Est. fire insurance / yr
- $1,222 – $2,270
Heat risk 8/10 · Major
- Hot days now (above 109°F)
- 7 days/yr
- Hot days in 30 yrs
- 23 days/yr
Wind risk 8/10 · Major
- Chance of severe wind over 30 yrs
- 80.0%
Air-quality risk 1/10 · Minimal
- Unhealthy air days now
- 0 days/yr
- Unhealthy air days in 30 yrs
- 0 days/yr
Risk factors via First Street. Map © Google.
Why this score? — see what drove the F grade
The composite is a weighted blend of 9 inputs, each scored 0–100. Each bar is that input's sub-score; the figure is the points it added to the 100-point composite (weight × sub-score).
- ARV discount +7.5/15.0
- Cash flow +6.3/30.0
- Livability +4.0/5.0
- Condition / age +3.8/5.0
- Schools +1.9/10.0
- Rent growth +1.7/5.0
- 1% rule +1.5/10.0
- DSCR +0.7/10.0
- Appreciation +0.0/10.0
$158,999
🖨 Deal sheet (PDF) 📄 Offer letter ✓ Due diligence
Listing remarks MLS
This two-story home features a classic layout ideal for young families and working professionals. The living area is located on the primary floor and consists of a family room and fully-equipped kitchen. There are three bedrooms on the second level, including the spacious owner's suite, which is situated at the back of the home for optimal privacy and comfort.
Key facts
- Garage
- Listed 118 days
Neighborhood map
What this means for you Summary
Snapshot
- This is a 3-bed/2.5-bath single-family listed at $159k. Condition is rated good.
Deal economics
- At list price, monthly cash flow is $-459 ($-6k/yr) — negative.
- The deal already cash-flows at list — no discount required.
- Meets the 1% rule at list price ($2k rent vs $159k).
- Recommended offer: $145k (9.0% below list) — sets the bar for market timing.
Location & tenants
- Location reads 80/100 on livability (#31 in TX, #1,616 nationally) — a professional / high-income tenant draw. Strengths: amenities A+, commute A+, cost of living A+; Watch: schools C-, crime F.
- East Central ISD (rural): math 16% / reading 25% proficiency, ranked #758 of 826 in TX (top 92%) — low school quality limits family demand, transient renter base, plan for 1-2y turnover; 61% free/reduced lunch — lower-income household profile, screen leases tightly.
- Market conditions: Rents falling (-3.4%/yr); 325 active listings in the ZIP; 5 comparable units currently listed for rent nearby; rentals at typical pace (median 25d on market — plan ~3-4 weeks tenant-placement turnaround); 8,308 units permitted in Bexar County in 2024 (2,506 in 5+ unit buildings).
- This rent runs 39% of the median local income ($52k/yr) — at the standard rent-burdened threshold; future hikes will face affordability resistance.
Forward outlook
- Local home prices are declining (-3.0%/yr); year-one equity from $2k of loan paydown is wiped out by about $8k of value loss. Plan a longer hold.
- Bexar County population projected at +50% by 2050 — long-run rental-demand tailwind backs the buy-and-hold thesis.
Negotiation context
- It's been on market 118 days — a 9% lower offer ($145k) is reasonable based on typical stale-listing flexibility.
Risks & watch-outs
- Climate carrying-cost: severe wind risk, 80% chance of damaging wind over 30y; extreme-heat days projected 7→23/yr by 2055 (HVAC capex compounding) — expect insurance premiums to compound above CPI over the hold.
Questions for the listing agent
- What do current leases actually rent for vs. the listed asking? Can we see a recent rent roll and the last 12 months of T-12 income?
- It's been on market 118 days. Have you received any prior offers? Is the seller open to a 9% concession, seller financing, or rate buy-down credit?
- Why hasn't it sold? Are there any deal-killer items the seller is aware of (foundation, flood, title, zoning, code violations)?
- Is there a deadline driving the sale (1031 exchange, divorce, estate, relocation)? That informs how much negotiation room exists.
- Crime grade is F in this area — have there been break-ins, vandalism, or insurance claims at this property in the last 3 years? What carrier currently insures it and at what premium?
- The area grade is low — what's the realistic commute time and amenity access for the typical tenant pool here? Any planned neighborhood developments (good or bad) we should know about?
- What's the average days-on-market for RENTAL listings here right now (not sales)? A rising rental-DOM trend means longer vacancies and softer asking-rent achievability than the comps imply.
- What's the recent tenant-quality profile in this submarket — average credit score on applications, eviction rate, late-payment / NSF rate, and stable-employment percentage? A property-management company in the area should have these aggregated.
- How much new for-sale + rental construction is in the pipeline within 1–3 miles? Heavy new supply typically softens prices + rents 12–24 months out; constrained supply supports both.
Investment metrics
- 1% rule
- 0.65% ✗
- Cap rate
- 4.19%
- Cash-on-cash
- -7.52%
- DSCR
- 0.67
- GRM
- 12.8
CMA / ARV
- ARV (median comp)
- $261,276
- List price
- $158,999
- Delta
- -39.15%
- Verdict
- UNDERPRICED
- Comps
- 20 within 1.0 mi
Show comp detail 12 sales within ~0.75 mi
| Address | Dist | Beds/Ba | Sqft | Sold | Price | $/sf | Match |
|---|---|---|---|---|---|---|---|
| 4975 Mala Vida | 0.11mi | 3/2.0 | 1,253 (+5%) | 7mo | $259,900 | $207 | 78 |
| 8433 Roadrunner Psge | 0.20mi | 3/2.0 | 1,286 (+8%) | 8mo | $263,990 | $205 | 68 |
| 5039 Agave Blue Ln | 0.33mi | 3/2.0 | 1,292 (+9%) | 9mo | $264,990 | $205 | 60 |
| 8579 Redhawk Loop | 0.36mi | 3/2.0 | 1,335 (+12%) | 14mo | $199,990 | $150 | 49 |
| 8550 Redhawk Loop | 0.42mi | 3/2.0 | 1,346 (+13%) | 10mo | $276,834 | $206 | 48 |
| 8938 Caracara Crst | 0.74mi | 3/2.0 | 1,266 (+6%) | 8mo | $192,999 | $152 | 46 |
| 8910 Caracara Crst | 0.74mi | 3/2.0 | 1,266 (+6%) | 8mo | $195,999 | $155 | 46 |
| 8806 Caracara Crst | 0.74mi | 3/2.0 | 1,266 (+6%) | 9mo | $199,999 | $158 | 46 |
| 5215 Falcon Vly | 0.40mi | 3/2.0 | 1,362 (+15%) | 12mo | $270,040 | $198 | 45 |
| 8719 Caracara Crst | 0.72mi | 3/2.0 | 1,125 (-5%) | 12mo | $179,256 | $159 | 45 |
| 8715 Caracara Crst | 0.73mi | 3/2.0 | 1,125 (-5%) | 13mo | $172,584 | $153 | 44 |
| 4735 Sahara Vlys | 0.54mi | 3/2.0 | 1,358 (+14%) | 12mo | $255,200 | $188 | 39 |
Match score weights: distance 35% · size 25% · config 20% · recency 20%. Top-matched comps best support the ARV.
Projected returns pro-forma
-3.0% appreciation · 0.0% rent growth · sell at horizon
- IRR
- -32.8%
- Equity multiple
- -0.05×
- Total profit
- $-76,518
- Equity at exit
- $38,957
- IRR
- -60.8%
- Equity multiple
- -0.69×
- Total profit
- $-123,449
- Equity at exit
- $22,590
Cash invested: $73,157 (down + closing). Projections, not guarantees.
Landlord ↔ Tenant lean methodology
- Overall (STATE)
- 87 Strongly Landlord-Friendly
- State Texas
- 87 Strongly Landlord-Friendly · R+5
- County
- — inherits STATE
- City
- — inherits STATE
ZIP-level market 78223
- Home prices YoY
- -16.4%
- Rents YoY
- -3.4%
- Active inventory
- 325
- Price-to-rent
- 7.8×
Monthly cashflow live
- Estimated rent
- $1,705 high interval (Pro) →
- Mortgage (P&I)
- −$1,370
- Tax est. 1.5%
- −$327 /mo · $3,919/yr
- Insurance
- −$109
- HOA
- −$0
- Vacancy / Maint / Mgmt
- −$358
- Net cashflow
- $-459
Break-even live
Sensitivity live
| Price | -10% $-278 | -5% $-368 | +0% $-459 | +5% $-549 | +10% $-639 |
|---|---|---|---|---|---|
| Rent | -10% $-593 | -5% $-526 | +0% $-459 | +5% $-391 | +10% $-324 |
| Rate | -1.0pp $-327 | -0.5pp $-392 | base $-459 | +0.5pp $-526 | +1.0pp $-595 |
UW: 25.0% down · 7.5% · 30yr · 1.5% tax · 5.0% vac · 8.0% maint · 8.0% mgmt
Financing live
Cash to close
- Down payment
- $65,319
- Closing costs
- $7,838
- Reserves months
- —
- Total cash needed
- —
Loan-product check · same deal, 3 products live
Conventional
25% down · 7.5% · 30yr
- Down + closing
- —
- Monthly P&I
- —
- Monthly cashflow
- —
- DSCR
- —
- Eligible?
- —
Personal DTI + credit; lowest rate.
DSCR
20% down · 8.5% · 30yr
- Down + closing
- —
- Monthly P&I
- —
- Monthly cashflow
- —
- DSCR
- —
- Eligible?
- —
No personal income docs; deal must DSCR.
Hard money
10% down · 12.0% · 12mo
- Down + closing
- —
- Monthly P&I
- —
- Monthly cashflow
- —
- DSCR
- —
- Eligible?
- —
Short-term bridge; refi at stabilization.
Rent comps 5 comps
| Address | Beds | Baths | Sqft | Rent | $/sqft | DOM | Units | Dist |
|---|---|---|---|---|---|---|---|---|
| 7814 Annex St San Antonio, TX | 3.0 | 2.0 | 1459 | $1,600 | $1.10 | 24d | 1 | 0.72mi |
| 7722 Blue Gulf Dr San Antonio, TX | 3.0 | 2.0 | 1464 | $1,575 | $1.08 | 24d | 1 | 0.84mi |
| 5727 Coopers Xing San Antonio, TX | 3.0 | 2.0 | 1127 | $2,400 | $2.13 | 22d | 1 | 0.87mi |
| 7246 Meadow Acres San Antonio, TX | 3.0 | 2.0 | 1450 | $1,470 | $1.01 | 24d | 1 | 0.91mi |
| 3618 Booker Trl San Antonio, TX | 3.0 | 2.0 | 1217 | $1,475 | $1.21 | 44d | 1 | 1.49mi |
Listing history 14 events
-
2026-06-18days on market $158,999 Active 118 DOM
-
2026-06-17days on market $158,999 Active 117 DOM
-
2026-06-16days on market $158,999 Active 116 DOM
-
2026-06-15days on market $158,999 Active 115 DOM
-
2026-06-13days on market $158,999 Active 113 DOM
-
2026-06-09days on market $158,999 Active 109 DOM
-
2026-06-08days on market $158,999 Active 108 DOM
-
2026-06-07days on market $158,999 Active 107 DOM
-
2026-06-04days on market $158,999 Active 104 DOM
-
2026-06-03days on market $158,999 Active 103 DOM
-
2026-06-02pricedays on market $158,999 Active 102 DOM
-
2026-06-01days on market $159,999 Active 101 DOM
-
2026-05-31days on market $159,999 Active 100 DOM
-
2026-02-20$159,999 Active 362-char remark
Show marketing remark (362 chars)
This two-story home features a classic layout ideal for young families and working professionals. The living area is located on the primary floor and consists of a family room and fully-equipped kitchen. There are three bedrooms on the second level, including the spacious owner's suite, which is situated at the back of the home for optimal privacy and comfort.
ⓘ Source: listings_history table (triggers on properties + properties_extension) + one-shot
backfill from property_details.listing_events for pre-trigger history.
Climate risk First Street
- Flood 1/10 Low FEMA zone X (unshaded) · 0% chance over 30 yrs
- Wildfire 2/10 Low
- Heat 8/10 Severe 7 d/yr ≥109°F today · 23 d/yr by 30 yrs out
- Wind 8/10 Severe 80% chance of damaging wind over 30 yrs
- Air quality 1/10 Low 0 unhealthy d/yr today · 0 by 30 yrs out
Nearby sold comps map
Loading sold comps map…
Walkable amenities ~0.75 mi
Loading nearby amenities…
Taxation est. · year 1
- Rental income
- $20,461
- − Mortgage interest
- −$14,635
- − Property taxes
- −$3,919
- − Insurance
- −$1,306
- − Repairs & maintenance
- −$1,637
- − Management
- −$1,637
- − Depreciation
- −$7,601
- Taxable loss
- −$10,275
- Est. tax savings @ 24.0%
- +$2,466
- After-tax cash flow
- $-3,037/yr
For passive investors: Depreciation is non-cash, so a rental often shows a tax loss while cash-flowing — sheltering income. Rental losses are passive: they offset passive income freely, and up to $25,000/yr can offset ordinary (W-2) income if you actively participate and your MAGI is under $100k (phasing out to $0 by $150k); unused losses carry forward. On sale, claimed depreciation is recaptured at up to 25%, and gains may owe capital-gains tax (a 1031 exchange can defer both). Figures are a year-1 estimate at your 24.0% rate — not tax advice; consult a CPA.
Condition & rehab AI · 3 photos
This two-story home is in good condition with a classic layout ideal for young families and working professionals. It has a good exterior, interior, and systems, and is move-in ready with minor maintenance items to address.
Value-add opportunities
- Both Paint exterior siding — Fresh paint can enhance curb appeal and the home's overall appearance.
- Both Replace or clean gutters — Clean gutters improve drainage and prevent water damage, enhancing the home's value.
- Both Update landscaping — Fresh landscaping can improve curb appeal and add value to the home.
- Both Install smart home technology — Smart home features can increase convenience and appeal to potential buyers/renters.
- Resale Upgrade kitchen appliances — Upgraded appliances can attract more buyers and increase the home's resale value.
- Rental Install smart thermostat — A smart thermostat can help reduce energy costs and attract renters who value energy efficiency.
Renovation cost estimate screening
Value-add ROI direction
- Both Paint exterior siding — Fresh paint can enhance curb appeal and the home's overall appearance. ↑
- Both Replace or clean gutters — Clean gutters improve drainage and prevent water damage, enhancing the home's value. ↑
- Both Update landscaping — Fresh landscaping can improve curb appeal and add value to the home. ↑
- Both Install smart home technology — Smart home features can increase convenience and appeal to potential buyers/renters. ↑
- Resale Upgrade kitchen appliances — Upgraded appliances can attract more buyers and increase the home's resale value. ↑
- Rental Install smart thermostat — A smart thermostat can help reduce energy costs and attract renters who value energy efficiency. ↑
ⓘ Cost ranges are severity-bucket heuristics (US national rule-of-thumb). Get contractor quotes + a written scope before underwriting a rehab budget.
Schools (NCES district)
- District
- East Central ISD
- NCES district ID
- 4817850
- Math proficiency
- 16% ▼ -12.00%
- Reading proficiency
- 25% ▼ -6.00%
- Median HH income
- $53,941
- Composite
- 18.67/100
- National rank
- #8887
- State rank
- #758 of 826 in TX
Livability — San Antonio
- Score
- 80/100
- State rank
- #31
- US rank
- #1616
Category grades
Schools grade is shown separately in the Schools card above.
Census & demographics
- County
- Bexar County · 1,990,555 people
- City population
- 1,806,925
- Metro
- San Antonio-New Braunfels, TX
- Population (ZIP)
- 58,983
- Household income
- $52,088
- Rent vs Own
- Severe rent burden
- 2809.0
Population outlook (Bexar County) Hauer SSP2
- Today (2025)
- 2,336,851 people
- By 2030
- 2,560,728 · +9.6%
- By 2040
- 3,020,569 · +29.3%
- By 2050
- 3,493,522 · +49.5%
- By 2075
- 4,668,459 · +99.8%
- By 2100
- 5,533,242 · +136.8%
Race, ethnicity, and origin ACS 2023
- Neighborhood character
- Predominantly Hispanic (76%)
- Race & ethnicity
- Hispanic / Latino 76% Two or more races 28% White 16% Black 5% Asian 2% Native American 1%
- Hispanic origin (detail)
- Mexican 67%
- Common ancestry
- Lithuanian 2% Romanian 1% Slovak 1%
- Foreign-born
- 10% · Canada, Vietnam
- Languages at home
- 63% English-only · Spanish 36%
Political lean MEDSL · Bexar
- 2024 margin
- Lean D (+9.8) · D 54.3% · R 44.6% · Other 1.1%
- 2008→2024 swing
- +4.2pp toward D · 2008: 5.6pp · 2024: 9.8pp
- All cycles
- 2024: D+9.8 2020: D+18.2 2016: D+13.5 2012: D+4.6 2008: D+5.6
Not yet ingested
- Civics
- —
Market trends
- HPI YoY
- ▼ -52.06%
- Current HPI
- 265.2235
- Rent YoY
- ▼ -3.36%
- Metro
- San Antonio-New Braunfels, TX
- State GDP YoY
- ▲ 3.95%
- F500 in state
- 110
Industry mix (Fortune 500 HQ in TX)
| Industry | F500 HQs | Revenue |
|---|---|---|
| Energy | 16 | $1,198B |
|
||
| Technology | 5 | $198B |
|
||
| Engineering / Construction | 4 | $72B |
|
||
| Energy Services | 3 | $60B |
|
||
| Utilities | 3 | $41B |
|
||
| Healthcare | 2 | $330B |
|
||
Price history
1 event — show timeline
- 2026-02-20 Listed $159,999 Zillow
Cash-flow waterfall
monthlySold comps — $/sqft
last 12 mo · ≤1 miLoading sold comps…