 🏷️ Likely Rental
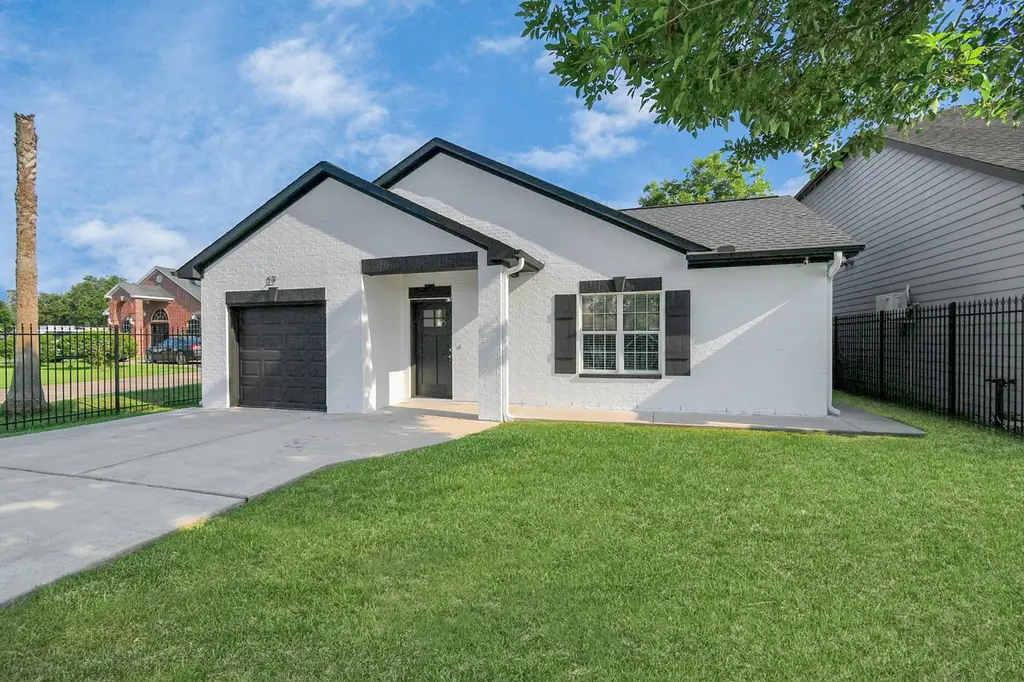
9006 Ledge St · Houston, TX
Flood risk 1/10 · Minimal
- FEMA flood zone
- X (unshaded)
- Chance of flooding over 30 yrs
- 0.0%
- Est. flood insurance / yr
- $507 – $1,088
Fire risk 1/10 · Minimal
- Est. fire insurance / yr
- $1,222 – $2,270
Heat risk 9/10 · Severe
- Hot days now (above 109°F)
- 7 days/yr
- Hot days in 30 yrs
- 24 days/yr
Wind risk 9/10 · Severe
- Chance of severe wind over 30 yrs
- 99.0%
Air-quality risk 2/10 · Minimal
- Unhealthy air days now
- 1 days/yr
- Unhealthy air days in 30 yrs
- 2 days/yr
Risk factors via First Street. Map © Google.
Why this score? — see what drove the D grade
The composite is a weighted blend of 9 inputs, each scored 0–100. Each bar is that input's sub-score; the figure is the points it added to the 100-point composite (weight × sub-score).
- Cash flow +15.0/30.0
- ARV discount +7.5/15.0
- 1% rule +5.0/10.0
- DSCR +5.0/10.0
- Livability +3.7/5.0
- Rent growth +3.0/5.0
- Schools +2.6/10.0
- Condition / age +2.5/5.0
- Appreciation +0.0/10.0
$2,200
🖨 Deal sheet 📄 Offer letter ✓ Due diligence
Listing remarks MLS
This nice house is waiting for your buyers, open concept nice size of bedrooms, bring an offer, owner will install a new carpet
Key facts
- Large backyard
- Ample cabinet space
- Open concept layout
Tags
Property features AI
Finance
- Financial info: Lease considered
Exterior
- Parking: Attached 2-car garage
- Security: Smoke detector(s)
- Utilities: Public sewer
- Home design: Residential property; Built in 2004
- Construction: Composition roof; Slab foundation
- Exterior features: Back yard fence; Property is cleared
Interior
- Kitchen: Convection oven; Refrigerator
- Bedrooms: Primary bedroom on the first floor (15 x 13); Two additional bedrooms on the first floor (12 x 11; 10 x 11)
- Flooring: Engineered hardwood floors
- Bathrooms: 2 full bathrooms
- Heating & cooling: Central heating (gas); Central electric air conditioning
- Interior features: Smoke detectors installed; Convection oven included
- Laundry & utility: Washer and dryer included
Neighborhood map
What this means for you Summary
Snapshot
- This is a 3-bed/2.0-bath single-family listed at $2k.
Deal economics
- At list price, monthly cash flow is $1k ($14k/yr) — positive.
- The deal already cash-flows at list — no discount required.
- Meets the 1% rule at list price ($1k rent vs $2k).
- Cap rate 638.9% vs local median 3.2% in Houston — top-decile yield for the area; either an underpriced asset or a hidden risk that comps aren't pricing in. Stress-test before assuming the spread holds.
Location & tenants
- Location reads 74/100 on livability (#184 in TX, #4,771 nationally) — a middle-class / working-renter tenant base. Strengths: amenities A+, cost of living A+, housing A+; Watch: crime F.
- Pasadena ISD (suburban): math 29% / reading 32% proficiency, ranked #612 of 826 in TX (top 74%) — families likely to look elsewhere, expect single-tenant / working-renter base with shorter leases; 71% free/reduced lunch — lower-income household profile, screen leases tightly.
- Zoned schools: Rick Schneider Middle (math 12% / reading 18%, grade F, #1,569 of 1,662 statewide, top 95%, 575 students, 92% FRL); South Houston H S (math 50% / reading 33%, grade F, #767 of 1,632 statewide, top 47%, 2,213 students, 87% FRL) — zoned schools average 90% FRL vs 71% district-wide (18 pts higher); higher-poverty schools than district average — tighter screening recommended.
- Market conditions: Rents rising (+2.2%/yr); 146 active listings in the ZIP; 40 comparable units currently listed for rent nearby; rentals leasing fast (median 11d on market — plan ~1-2 weeks tenant-placement turnaround); 29,883 units permitted in Harris County in 2024 (8,621 in 5+ unit buildings).
Forward outlook
- Local home prices are declining (-3.0%/yr); year-one equity from $15 of loan paydown is wiped out by about $66 of value loss. Plan a longer hold.
- Harris County population projected at +47% by 2050 — long-run rental-demand tailwind backs the buy-and-hold thesis.
- At projected returns (-3.0% appreciation + 2.2% rent growth), your $616 cash investment doubles in ~1 year — after that, you're playing with house money.
Negotiation context
- Only 1 days on market — expect competitive offers; lowballing is unlikely to land.
- 4 sale attempts since 22y ago with the ask held roughly flat each time — persistent listings suggest the price (not the market) is what's stuck; bring a comps-based counter.
Risks & watch-outs
- Climate carrying-cost: severe wind risk, 99% chance of damaging wind over 30y; extreme-heat days projected 7→24/yr by 2055 (HVAC capex compounding) — expect insurance premiums to compound above CPI over the hold.
Questions for the listing agent
- Is there a deadline driving the sale (1031 exchange, divorce, estate, relocation)? That informs how much negotiation room exists.
- Schools are D-rated, which usually means shorter tenancies and higher turnover. Who's the typical renter profile here, and what's been the actual vacancy rate?
- Crime grade is F in this area — have there been break-ins, vandalism, or insurance claims at this property in the last 3 years? What carrier currently insures it and at what premium?
- The area grade is low — what's the realistic commute time and amenity access for the typical tenant pool here? Any planned neighborhood developments (good or bad) we should know about?
- What's the average days-on-market for RENTAL listings here right now (not sales)? A rising rental-DOM trend means longer vacancies and softer asking-rent achievability than the comps imply.
- What's the recent tenant-quality profile in this submarket — average credit score on applications, eviction rate, late-payment / NSF rate, and stable-employment percentage? A property-management company in the area should have these aggregated.
- How much new for-sale + rental construction is in the pipeline within 1–3 miles? Heavy new supply typically softens prices + rents 12–24 months out; constrained supply supports both.
Investment metrics
- 1% rule
- 67.61% ✓
- Cap rate
- 638.93%
- Cash-on-cash
- 2259.42%
- DSCR
- 101.53
- GRM
- 0.1
CMA / ARV
- ARV (on-the-fly)
- $246,456
- Comps found
- 12
Show comp detail 12 sales within ~0.75 mi
| Address | Dist | Beds/Ba | Sqft | Sold | Price | $/sf | Match |
|---|---|---|---|---|---|---|---|
| 8830 Ledge St | 0.16mi | 3/2.0 | 1,456 (-1%) | 9mo | $224,900 | $154 | 84 |
| 9001 Judwin St | 0.12mi | 3/2.5 | 1,350 (-8%) | 4mo | $246,999 | $183 | 76 |
| 8903 Freeland St | 0.33mi | 4/2.5 (+1) | 1,458 (-1%) | 4mo | $225,000 | $154 | 73 |
| 8906 Judwin St | 0.15mi | 3/1.5 | 1,640 (+12%) | 4mo | $215,000 | $131 | 68 |
| 9119 Edgebrook St | 0.38mi | 3/2.0 | 1,303 (-11%) | 10mo | $224,500 | $172 | 55 |
| 8842 Barton St | 0.49mi | 3/2.0 | 1,272 (-13%) | 2mo | $185,000 | $145 | 54 |
| 8842 Conger St | 0.45mi | 3/2.0 | 1,303 (-11%) | 9mo | $188,500 | $145 | 53 |
| 9119 Barton St | 0.52mi | 3/1.5 | 1,272 (-13%) | 7mo | $214,000 | $168 | 46 |
| 9515 Lower Ridgeway | 0.68mi | 3/2.0 | 1,326 (-10%) | 10mo | $221,500 | $167 | 44 |
| 8678 Easthaven Blvd | 0.73mi | 3/2.5 | 1,651 (+12%) | 0mo | $354,990 | $215 | 43 |
| 8676 Easthaven Blvd | 0.73mi | 3/2.5 | 1,651 (+12%) | 0mo | $339,990 | $206 | 43 |
| 8672 Easthaven Blvd | 0.74mi | 3/2.5 | 1,651 (+12%) | 3mo | $354,990 | $215 | 40 |
Match score weights: distance 35% · size 25% · config 20% · recency 20%. Top-matched comps best support the ARV.
Projected returns pro-forma
-3.0% appreciation · 2.17% rent growth · sell at horizon
- IRR
- —
- Equity multiple
- 118.38×
- Total profit
- $72,304
- Equity at exit
- $328
- IRR
- —
- Equity multiple
- 249.70×
- Total profit
- $153,201
- Equity at exit
- $190
Cash invested: $616 (down + closing). Projections, not guarantees.
Landlord ↔ Tenant lean methodology
- Overall (STATE)
- 87 Strongly Landlord-Friendly
- State Texas
- 87 Strongly Landlord-Friendly · R+5
- County
- — inherits STATE
- City
- — inherits STATE
ZIP-level market 77075
- Home prices YoY
- -25.3%
- Rents YoY
- 2.2%
- Active inventory
- 146
- Price-to-rent
- 0.1×
Monthly cashflow live
- Estimated rent
- $1,487 high interval (Pro) →
- Mortgage (P&I)
- −$12
- Tax est. 1.5%
- −$3 /mo · $33/yr
- Insurance
- −$1
- HOA
- −$0
- Vacancy / Maint / Mgmt
- −$312
- Net cashflow
- $1,160
Break-even live
UW: 25.0% down · 7.5% · 30yr · 1.5% tax · 5.0% vac · 8.0% maint · 8.0% mgmt
Financing live
Cash to close
- Down payment
- $550
- Closing costs
- $66
- Reserves months
- —
- Total cash needed
- —
Loan-product check · same deal, 3 products live
Conventional
25% down · 7.5% · 30yr
- Down + closing
- —
- Monthly P&I
- —
- Monthly cashflow
- —
- DSCR
- —
- Eligible?
- —
Personal DTI + credit; lowest rate.
DSCR
20% down · 8.5% · 30yr
- Down + closing
- —
- Monthly P&I
- —
- Monthly cashflow
- —
- DSCR
- —
- Eligible?
- —
No personal income docs; deal must DSCR.
Hard money
10% down · 12.0% · 12mo
- Down + closing
- —
- Monthly P&I
- —
- Monthly cashflow
- —
- DSCR
- —
- Eligible?
- —
Short-term bridge; refi at stabilization.
Rent comps 40 comps
| Address | Beds | Baths | Sqft | Rent | $/sqft | DOM | Units | Dist |
|---|---|---|---|---|---|---|---|---|
| 9130 Arledge St Houston, TX | 3.0 | 2.0 | 1253 | $1,700 | $1.36 | 43d | 1 | 0.54mi |
| 9465 Clearwood Dr Unit 2162 Houston, TX | 2.0 | 2.0 | 1029 | $1,240 | $1.21 | 5d | 1 | 0.68mi |
| 9465 Clearwood Dr Unit 9498 Houston, TX | 3.0 | 2.0 | 1232 | $1,375 | $1.12 | 43d | 1 | 0.68mi |
| 9465 Clearwood Dr Unit 9522 Houston, TX | 2.0 | 2.0 | 1029 | $1,265 | $1.23 | 43d | 1 | 0.68mi |
| 9465 Clearwood Dr Unit 2174 Houston, TX | 2.0 | 2.0 | 1029 | $1,232 | $1.20 | 3d | 1 | 0.68mi |
| 9465 Clearwood Dr Unit 3174 Houston, TX | 3.0 | 2.0 | 1232 | $1,332 | $1.08 | 3d | 1 | 0.68mi |
| 13 Ledge St Houston, TX | 3.0 | 2.0 | 1200 | $1,079 | $0.90 | 20d | 1 | 0.69mi |
| 9220 Nathaniel St Unit 9253 Houston, TX | 3.0 | 2.0 | 1200 | $1,302 | $1.08 | 3d | 1 | 0.71mi |
| 9800 Hollock St Houston, TX | 1.0–2.0 | 1.0–2.0 | 820 | $1,315 | $1.60 | 2d | 33 | 0.77mi |
| 9806 Hollock St Houston, TX | 2.0 | 2.0 | 965 | $1,111 | $1.15 | 24d | 1 | 0.87mi |
| 9815 Almeda-Genoa Rd Unit 510 Houston, TX | 3.0 | 2.0 | 1290 | $1,773 | $1.37 | 12d | 1 | 0.94mi |
| 9815 Almeda-Genoa Rd Unit 9842 Houston, TX | 2.0 | 2.0 | 956 | $1,471 | $1.54 | 3d | 1 | 0.94mi |
| 9815 Almeda-Genoa Rd Unit 9848 Houston, TX | 3.0 | 2.0 | 1290 | $1,781 | $1.38 | 3d | 1 | 0.94mi |
| 9757 Windwater Dr Unit 2047 Houston, TX | 2.0 | 2.0 | 1017 | $1,290 | $1.27 | 11d | 1 | 0.97mi |
| 9757 Windwater Dr Unit 9814 Houston, TX | 2.0 | 2.0 | 1017 | $1,247 | $1.23 | 3d | 1 | 0.98mi |
| 9763 Windwater Dr Houston, TX | 2.0 | 1.0 | 916 | $1,149 | $1.25 | 43d | 1 | 0.98mi |
| 9750 Windwater Dr Houston, TX | 1.0–2.0 | 1.0–2.0 | 856 | $1,662 | $1.94 | 1d | 13 | 1.02mi |
| 1227 Redford St Houston, TX | 2.0 | 2.0 | 966 | $1,184 | $1.23 | 24d | 1 | 1.11mi |
| 9150 Blackhawk Blvd Houston, TX | 1.0–2.0 | 1.0–2.0 | 834 | $1,550 | $1.86 | 2d | 1 | 1.11mi |
| 10915 Gulf Fwy Houston, TX | 3.0 | 3.0 | 1286 | $1,400 | $1.09 | 43d | 1 | 1.13mi |
| 10915 Gulf Fwy Houston, TX | 3.0 | 3.0 | 1286 | $1,400 | $1.09 | 20d | 1 | 1.13mi |
| 10915 Gulf Fwy Houston, TX | 2.0 | 2.0 | 1060 | $1,110 | $1.05 | 22d | 1 | 1.13mi |
| 10915 Gulf Fwy Houston, TX | 2.0 | 2.0 | 1060 | $1,110 | $1.05 | 19d | 1 | 1.13mi |
| 1221 Redford St Houston, TX | 1.0–3.0 | 1.0–2.0 | 877 | $1,308 | $1.49 | 2d | 60 | 1.14mi |
| 1223 Shawnee St Houston, TX | 3.0 | 1.0 | 1101 | $1,695 | $1.54 | 43d | 1 | 1.15mi |
| 9988 Windmill Lakes Blvd Unit 10045 Houston, TX | 2.0 | 2.0 | 1047 | $1,125 | $1.07 | 17d | 1 | 1.15mi |
| 9988 Windmill Lakes Blvd Houston, TX | 1.0–2.0 | 1.0–2.0 | 859 | $1,290 | $1.50 | 2d | 15 | 1.17mi |
| 9994 Windmill Lakes Blvd Unit 817 Houston, TX | 2.0 | 2.0 | 1047 | $1,280 | $1.22 | 43d | 1 | 1.24mi |
| 10909 Gulf Fwy Houston, TX | 1.0–2.0 | 1.0–2.0 | 816 | $1,430 | $1.75 | 2d | 154 | 1.27mi |
| 10100 Almeda-Genoa Rd Unit 2047 Houston, TX | 2.0 | 2.0 | 1052 | $1,502 | $1.43 | 11d | 1 | 1.31mi |
| 8020 Botany Ln Unit 1546255P Houston, TX | 3.0 | 2.0 | 1388 | $3,226 | $2.32 | 17d | 1 | 1.32mi |
| 10100 Almeda-Genoa Rd Unit 10137 Houston, TX | 2.0 | 2.0 | 1052 | $1,491 | $1.42 | 10d | 1 | 1.34mi |
| 10100 Almeda-Genoa Rd Unit 10133 Houston, TX | 3.0 | 2.0 | 1230 | $1,978 | $1.61 | 10d | 1 | 1.34mi |
| 10100 Almeda-Genoa Rd Unit 2112 Houston, TX | 2.0 | 2.0 | 1052 | $1,459 | $1.39 | 3d | 1 | 1.34mi |
| 10100 Almeda-Genoa Rd Unit 10157 Houston, TX | 2.0 | 2.0 | 1052 | $1,467 | $1.39 | 43d | 1 | 1.34mi |
| 10100 Almeda-Genoa Rd Unit 3165 Houston, TX | 3.0 | 2.0 | 1230 | $1,946 | $1.58 | 3d | 1 | 1.34mi |
| 8600 Theta St Houston, TX | 1.0–2.0 | 1.0–2.0 | 766 | $1,179 | $1.54 | 2d | 25 | 1.34mi |
| 10280 Windmill Lakes Blvd Houston, TX | 1.0–2.0 | 1.0–2.0 | 780 | $1,410 | $1.81 | 2d | 9 | 1.35mi |
| 10121 Windmill Lakes Blvd Unit 2047 Houston, TX | 2.0 | 2.0 | 914 | $1,445 | $1.58 | 11d | 1 | 1.36mi |
| 10121 Windmill Lakes Blvd Houston, TX | 1.0–2.0 | 1.0–2.0 | 814 | $1,491 | $1.83 | 20d | 17 | 1.37mi |
Listing history 2 events
-
2026-06-16remarks 521-char remark
-
2026-06-16$2,200 Active 1 DOM
ⓘ Source: listings_history table (triggers on properties + properties_extension) + one-shot
backfill from property_details.listing_events for pre-trigger history.
Climate risk First Street
- Flood 1/10 Low FEMA zone X (unshaded) · 0% chance over 30 yrs
- Wildfire 1/10 Low
- Heat 9/10 Extreme 7 d/yr ≥109°F today · 24 d/yr by 30 yrs out
- Wind 9/10 Extreme 99% chance of damaging wind over 30 yrs
- Air quality 2/10 Low 1 unhealthy d/yr today · 2 by 30 yrs out
Nearby sold comps map
Loading sold comps map…
Walkable amenities ~0.75 mi
Loading nearby amenities…
Taxation est. · year 1
- Rental income
- $17,849
- − Mortgage interest
- −$123
- − Property taxes
- −$33
- − Insurance
- −$11
- − Repairs & maintenance
- −$1,428
- − Management
- −$1,428
- − Depreciation
- −$64
- Taxable income
- $14,762
- Est. tax owed @ 24.0%
- −$3,543
- After-tax cash flow
- $10,375/yr
For passive investors: Depreciation is non-cash, so a rental often shows a tax loss while cash-flowing — sheltering income. Rental losses are passive: they offset passive income freely, and up to $25,000/yr can offset ordinary (W-2) income if you actively participate and your MAGI is under $100k (phasing out to $0 by $150k); unused losses carry forward. On sale, claimed depreciation is recaptured at up to 25%, and gains may owe capital-gains tax (a 1031 exchange can defer both). Figures are a year-1 estimate at your 24.0% rate — not tax advice; consult a CPA.
Schools (NCES district)
- District
- Pasadena ISD
- NCES district ID
- 4834320
- Math proficiency
- 29% ▼ -17.00%
- Reading proficiency
- 32% ▼ -9.00%
- Median HH income
- $45,163
- Composite
- 26.15/100
- National rank
- #7275
- State rank
- #612 of 826 in TX
Livability — Houston
- Score
- 74/100
- State rank
- #184
- US rank
- #4771
Category grades
Schools grade is shown separately in the Schools card above.
Census & demographics
- Census place
- Houston, TX
- County
- Harris County · 4,702,590 people
- City population
- 3,226,434
- Metro
- Houston-The Woodlands-Sugar Land, TX
- Population (ZIP)
- 40,626
- Household income
- $69,191
- Rent vs Own
- Severe rent burden
- 1573.0
Population outlook (Harris County) Hauer SSP2
- Today (2025)
- 5,571,493 people
- By 2030
- 6,089,821 · +9.3%
- By 2040
- 7,142,806 · +28.2%
- By 2050
- 8,185,864 · +46.9%
- By 2075
- 10,574,329 · +89.8%
- By 2100
- 12,109,958 · +117.4%
Race, ethnicity, and origin ACS 2023
- Neighborhood character
- Predominantly Hispanic (71%)
- Race & ethnicity
- Hispanic / Latino 71% Two or more races 34% Black 14% White 7% Asian 6% Native American 1%
- Hispanic origin (detail)
- Mexican 53%
- Common ancestry
- Lithuanian 1%
- Foreign-born
- 30% · Canada, Vietnam, Jamaica
- Languages at home
- 34% English-only · Spanish 60% Vietnamese 6%
Political lean MEDSL · Harris
- 2024 margin
- Lean D (+5.5) · D 52.0% · R 46.4% · Other 1.6%
- 2008→2024 swing
- +3.9pp toward D · 2008: 1.6pp · 2024: 5.5pp
- All cycles
- 2024: D+5.5 2020: D+13.3 2016: D+12.4 2012: D+0.1 2008: D+1.6
Not yet ingested
- Civics
- —
Market trends
- HPI YoY
- ▼ -88.33%
- Current HPI
- 260.3733
- Rent YoY
- ▲ 2.17%
- Metro
- Houston-The Woodlands-Sugar Land, TX
- State GDP YoY
- ▲ 3.95%
- F500 in state
- 110
Industry mix (Fortune 500 HQ in TX)
| Industry | F500 HQs | Revenue |
|---|---|---|
| Energy | 16 | $1,198B |
|
||
| Technology | 5 | $198B |
|
||
| Engineering / Construction | 4 | $72B |
|
||
| Energy Services | 3 | $60B |
|
||
| Utilities | 3 | $41B |
|
||
| Healthcare | 2 | $330B |
|
||
Price history
-98.1% since first listed12 events — show timeline
- 2026-06-15 Listed $2,200 HARMLS
- 2024-08-02 Rental Removed $1,950 HARMLS
- 2024-06-25 Price Changed $1,950 HARMLS
- 2024-06-16 Listed for Rent $2,100 HARMLS
- 2017-08-02 Sold (MLS) — HARMLS
- 2017-07-31 Sold (Public Records) — Public Records
- 2017-07-08 Pending — HARMLS
- 2017-06-27 Pending — HARMLS
- 2017-06-14 Listed $157,500 HARMLS
- 2004-08-10 Sold (Public Records) — Public Records
- 2004-06-17 Listing Removed — HARMLS
- 2004-03-17 Listed $117,900 HARMLS
Property tax history
+7.6%/yrLatest (2025): $5,671 · +1.2% YoY. Source: county tax records.
Cash-flow waterfall
monthlySold comps — $/sqft
last 12 mo · ≤1 miLoading sold comps…