 🏗️ New Construction
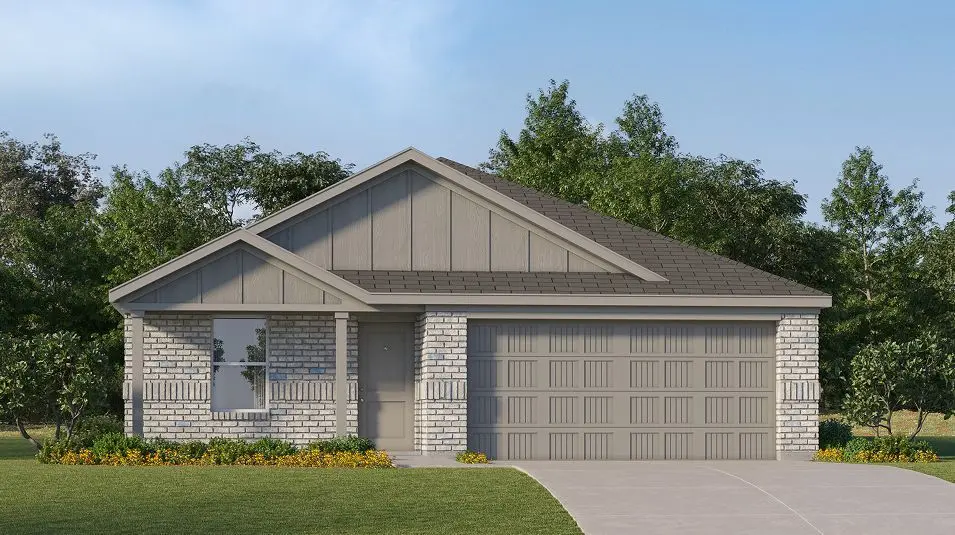
Ramsey Plan · Cleburne, TX
Flood risk No data
- FEMA flood zone
- —
- Chance of flooding over 30 yrs
- —
- Est. flood insurance / yr
- —
Fire risk No data
- Est. fire insurance / yr
- —
Heat risk No data
- Hot days now (above threshold)
- —
- Hot days in 30 yrs
- —
Wind risk No data
- Chance of severe wind over 30 yrs
- —
Air-quality risk No data
- Unhealthy air days now
- —
- Unhealthy air days in 30 yrs
- —
Risk factors via First Street. Map © Google.
Why this score? — see what drove the F grade
The composite is a weighted blend of 9 inputs, each scored 0–100. Each bar is that input's sub-score; the figure is the points it added to the 100-point composite (weight × sub-score).
- ARV discount +7.5/15.0
- Cash flow +4.0/30.0
- Livability +3.4/5.0
- Schools +2.9/10.0
- Rent growth +2.5/5.0
- Condition / age +2.2/5.0
- 1% rule +0.2/10.0
- DSCR +0.0/10.0
- Appreciation +0.0/10.0
$270,999
🖨 Deal sheet (PDF) 📄 Offer letter ✓ Due diligence
Listing remarks MLS
This new single-story design makes smart use of the space available. At the front are all three secondary bedrooms arranged near a convenient full-sized bathroom. Down the foyer is a modern layout connecting a peninsula-style kitchen made for inspired meals, an intimate dining area and a family room ideal for gatherings. Tucked in a quiet corner is the owner's suite with an attached bathroom and walk-in closet.
Key facts
- 2 garage spots
- Listed 125 days
Tags
Neighborhood map
What this means for you Summary
Snapshot
- This is a 4-bed/2.0-bath single-family listed at $271k. Condition is rated fair.
Deal economics
- At list price, monthly cash flow is $-1k ($-14k/yr) — negative.
- To cash-flow at today's rent, offer at most $258k (4.9% below list).
- To meet the 1% rule (rent ≥ 1% of price), the offer needs to be $225k (16.8% below list).
- Recommended offer: $225k (16.8% below list) — sets the bar for 1% rule.
Location & tenants
- Location reads 68/100 on livability (#460 in TX) — a middle-class / working-renter tenant base. Strengths: cost of living A+, housing A+, health & safety A+; Watch: employment C-, amenities F, commute F.
- Cleburne ISD (town): math 34% / reading 33% proficiency, ranked #537 of 826 in TX (top 65%) — families likely to look elsewhere, expect single-tenant / working-renter base with shorter leases.
- Zoned schools: Marti El (math 32% / reading 29%, grade F, #2,464 of 4,322 statewide, top 58%, 495 students, 70% FRL); Ad Wheat Middle (math 31% / reading 29%, grade F, #1,056 of 1,662 statewide, top 65%, 703 students, 76% FRL); Cleburne H S (math 46% / reading 38%, grade F, #730 of 1,632 statewide, top 47%, 1,976 students, 67% FRL) — zoned schools average 71% FRL vs 56% district-wide (15 pts higher); higher-poverty schools than district average — tighter screening recommended.
- Market conditions: 421 active listings in the ZIP; 2,152 units permitted in Johnson County in 2024 (76 in 5+ unit buildings).
Forward outlook
- Local home prices are declining (-3.0%/yr); year-one equity from $3k of loan paydown is wiped out by about $13k of value loss. Plan a longer hold.
- Johnson County population projected at +24% by 2050 — long-run rental-demand tailwind backs the buy-and-hold thesis.
Negotiation context
- It's been on market 125 days — a 12% lower offer ($238k) is reasonable based on typical stale-listing flexibility.
Questions for the listing agent
- What do current leases actually rent for vs. the listed asking? Can we see a recent rent roll and the last 12 months of T-12 income?
- It's been on market 125 days. Have you received any prior offers? Is the seller open to a 17% concession, seller financing, or rate buy-down credit?
- Have any recent inspections been done? Can we get a copy of the seller's disclosures and any deferred-maintenance estimates?
- Why hasn't it sold? Are there any deal-killer items the seller is aware of (foundation, flood, title, zoning, code violations)?
- Is there a deadline driving the sale (1031 exchange, divorce, estate, relocation)? That informs how much negotiation room exists.
- Schools are F-rated, which usually means shorter tenancies and higher turnover. Who's the typical renter profile here, and what's been the actual vacancy rate?
- The area grade is low — what's the realistic commute time and amenity access for the typical tenant pool here? Any planned neighborhood developments (good or bad) we should know about?
- What's the average days-on-market for RENTAL listings here right now (not sales)? A rising rental-DOM trend means longer vacancies and softer asking-rent achievability than the comps imply.
- What's the recent tenant-quality profile in this submarket — average credit score on applications, eviction rate, late-payment / NSF rate, and stable-employment percentage? A property-management company in the area should have these aggregated.
- How much new for-sale + rental construction is in the pipeline within 1–3 miles? Heavy new supply typically softens prices + rents 12–24 months out; constrained supply supports both.
Investment metrics
- 1% rule
- 0.52% ✗
- Cap rate
- 2.95%
- Cash-on-cash
- -11.96%
- DSCR
- 0.47
- GRM
- 16.0
CMA / ARV
- ARV (median comp)
- $431,969
- List price
- $270,999
- Delta
- -37.26%
- Verdict
- UNDERPRICED
- Comps
- 7 within 1.0 mi
Show comp detail 1 sale within ~0.75 mi
| Address | Dist | Beds/Ba | Sqft | Sold | Price | $/sf | Match |
|---|---|---|---|---|---|---|---|
| 1616 County Road 904 Rd | 0.57mi | 3/2.0 (-1) | 1,498 (-13%) | 15mo | $299,900 | $200 | 34 |
Match score weights: distance 35% · size 25% · config 20% · recency 20%. Top-matched comps best support the ARV.
Projected returns pro-forma
-3.0% appreciation · 3.0% rent growth · sell at horizon
- IRR
- -38.3%
- Equity multiple
- -0.21×
- Total profit
- $-146,711
- Equity at exit
- $64,408
- IRR
- -57.6%
- Equity multiple
- -0.87×
- Total profit
- $-226,440
- Equity at exit
- $37,349
Cash invested: $120,951 (down + closing). Projections, not guarantees.
Landlord ↔ Tenant lean methodology
- Overall (STATE)
- 87 Strongly Landlord-Friendly
- State Texas
- 87 Strongly Landlord-Friendly · R+5
- County
- — inherits STATE
- City
- — inherits STATE
ZIP-level market 76058
- Home prices YoY
- -24.5%
- Active inventory
- 421
- Price-to-rent
- 10.0×
Monthly cashflow live
- Estimated rent
- $2,253 medium interval (Pro) →
- Mortgage (P&I)
- −$2,265
- Tax est. 1.5%
- −$540 /mo · $6,480/yr
- Insurance
- −$180
- HOA
- −$0
- Vacancy / Maint / Mgmt
- −$473
- Net cashflow
- $-1,205
Break-even live
Sensitivity live
| Price | -10% $-906 | -5% $-1,056 | +0% $-1,205 | +5% $-1,354 | +10% $-1,504 |
|---|---|---|---|---|---|
| Rent | -10% $-1,383 | -5% $-1,294 | +0% $-1,205 | +5% $-1,116 | +10% $-1,027 |
| Rate | -1.0pp $-987 | -0.5pp $-1,095 | base $-1,205 | +0.5pp $-1,317 | +1.0pp $-1,431 |
UW: 25.0% down · 7.5% · 30yr · 1.5% tax · 5.0% vac · 8.0% maint · 8.0% mgmt
Financing live
Cash to close
- Down payment
- $107,992
- Closing costs
- $12,959
- Reserves months
- —
- Total cash needed
- —
Loan-product check · same deal, 3 products live
Conventional
25% down · 7.5% · 30yr
- Down + closing
- —
- Monthly P&I
- —
- Monthly cashflow
- —
- DSCR
- —
- Eligible?
- —
Personal DTI + credit; lowest rate.
DSCR
20% down · 8.5% · 30yr
- Down + closing
- —
- Monthly P&I
- —
- Monthly cashflow
- —
- DSCR
- —
- Eligible?
- —
No personal income docs; deal must DSCR.
Hard money
10% down · 12.0% · 12mo
- Down + closing
- —
- Monthly P&I
- —
- Monthly cashflow
- —
- DSCR
- —
- Eligible?
- —
Short-term bridge; refi at stabilization.
Listing history 15 events
-
2026-06-21days on market $270,999 Active 125 DOM
-
2026-06-18days on market $270,999 Active 122 DOM
-
2026-06-17days on market $270,999 Active 121 DOM
-
2026-06-16days on market $270,999 Active 120 DOM
-
2026-06-15days on market $270,999 Active 119 DOM
-
2026-06-13days on market $270,999 Active 117 DOM
-
2026-06-09days on market $270,999 Active 113 DOM
-
2026-06-08days on market $270,999 Active 112 DOM
-
2026-06-07days on market $270,999 Active 111 DOM
-
2026-06-04days on market $270,999 Active 108 DOM
-
2026-06-03days on market $270,999 Active 107 DOM
-
2026-06-02days on market $270,999 Active 106 DOM
-
2026-06-01days on market $270,999 Active 105 DOM
-
2026-05-31days on market $270,999 Active 104 DOM
-
2026-02-16$270,999 Active 414-char remark
Show marketing remark (414 chars)
This new single-story design makes smart use of the space available. At the front are all three secondary bedrooms arranged near a convenient full-sized bathroom. Down the foyer is a modern layout connecting a peninsula-style kitchen made for inspired meals, an intimate dining area and a family room ideal for gatherings. Tucked in a quiet corner is the owner's suite with an attached bathroom and walk-in closet.
ⓘ Source: listings_history table (triggers on properties + properties_extension) + one-shot
backfill from property_details.listing_events for pre-trigger history.
Nearby sold comps map
Loading sold comps map…
Walkable amenities ~0.75 mi
Loading nearby amenities…
Taxation est. · year 1
- Rental income
- $27,042
- − Mortgage interest
- −$24,197
- − Property taxes
- −$6,480
- − Insurance
- −$2,160
- − Repairs & maintenance
- −$2,163
- − Management
- −$2,163
- − Depreciation
- −$12,566
- Taxable loss
- −$22,688
- Est. tax savings @ 24.0%
- +$5,445
- After-tax cash flow
- $-9,015/yr
For passive investors: Depreciation is non-cash, so a rental often shows a tax loss while cash-flowing — sheltering income. Rental losses are passive: they offset passive income freely, and up to $25,000/yr can offset ordinary (W-2) income if you actively participate and your MAGI is under $100k (phasing out to $0 by $150k); unused losses carry forward. On sale, claimed depreciation is recaptured at up to 25%, and gains may owe capital-gains tax (a 1031 exchange can defer both). Figures are a year-1 estimate at your 24.0% rate — not tax advice; consult a CPA.
Condition & rehab AI · 3 photos
The home requires significant repairs to the roof and siding, as well as exterior painting. These repairs will improve the home's value and curb appeal.
Repairs flagged
- Major roof — Significant damage to the roof with missing shingles
- Major siding — Peeling paint and possible rot on the siding
- Major exterior paint — Significant wear and tear on the exterior paint
Value-add opportunities
- Both repair roof — Fixing the roof will prevent further water damage and improve the home's appearance
- Both repair siding — Repairing the siding will improve the home's curb appeal and prevent further structural damage
- Both paint exterior — Painting the exterior will improve the home's curb appeal and protect the siding
Renovation cost estimate screening
| Repair item | Severity | Est. cost |
|---|---|---|
| roof · Significant damage to the roof with missing shingles | Major | $15,000–50,000 |
| siding · Peeling paint and possible rot on the siding | Major | $15,000–50,000 |
| exterior paint · Significant wear and tear on the exterior paint | Major | $15,000–50,000 |
| Total estimated repair cost · 3 items | $45,000–150,000 |
Value-add ROI direction
- Both repair roof — Fixing the roof will prevent further water damage and improve the home's appearance ↑
- Both repair siding — Repairing the siding will improve the home's curb appeal and prevent further structural damage ↑
- Both paint exterior — Painting the exterior will improve the home's curb appeal and protect the siding ↑
ⓘ Cost ranges are severity-bucket heuristics (US national rule-of-thumb). Get contractor quotes + a written scope before underwriting a rehab budget.
Schools (NCES district)
- District
- Cleburne ISD
- NCES district ID
- 4814310
- Math proficiency
- 34% ▼ -2.00%
- Reading proficiency
- 33% ▼ -2.00%
- Median HH income
- $48,788
- Composite
- 29.0/100
- National rank
- #6618
- State rank
- #537 of 826 in TX
Livability — Cleburne
- Score
- 68/100
- State rank
- #460
- US rank
- #9292
Category grades
Schools grade is shown separately in the Schools card above.
Census & demographics
- City population
- 29,538
- Population (ZIP)
- 21,531
Population outlook (Johnson County) Hauer SSP2
- Today (2025)
- 179,678 people
- By 2030
- 189,208 · +5.3%
- By 2040
- 207,261 · +15.4%
- By 2050
- 223,064 · +24.1%
- By 2075
- 259,979 · +44.7%
- By 2100
- 275,395 · +53.3%
Race, ethnicity, and origin ACS 2023
- Neighborhood character
- Predominantly White (67%)
- Race & ethnicity
- White 67% Hispanic / Latino 28% Two or more races 11% Black 2%
- Hispanic origin (detail)
- Mexican 26%
- Common ancestry
- Italian 2% Slovak 2% Portuguese 1%
- Foreign-born
- 7% · Canada
- Languages at home
- 80% English-only · Spanish 18% German/W. Germanic 1%
Political lean MEDSL · Johnson
- 2024 margin
- Solid R (+51.4) · D 23.9% · R 75.3%
- 2008→2024 swing
- -3.9pp toward R · 2008: -47.5pp · 2024: -51.4pp
- All cycles
- 2024: R+51.4 2020: R+53.0 2016: R+58.3 2012: R+55.6 2008: R+47.5
Not yet ingested
- Civics
- —
Market trends
- HPI YoY
- ▼ -86.22%
- Current HPI
- 265.6513
- Rent YoY
- —
- Metro
- —
- State GDP YoY
- ▲ 3.95%
- F500 in state
- 110
Industry mix (Fortune 500 HQ in TX)
| Industry | F500 HQs | Revenue |
|---|---|---|
| Energy | 16 | $1,198B |
|
||
| Technology | 5 | $198B |
|
||
| Engineering / Construction | 4 | $72B |
|
||
| Energy Services | 3 | $60B |
|
||
| Utilities | 3 | $41B |
|
||
| Healthcare | 2 | $330B |
|
||
Price history
1 event — show timeline
- 2026-02-16 Listed $270,999 Zillow
Cash-flow waterfall
monthlySold comps — $/sqft
last 12 mo · ≤1 miLoading sold comps…