 🏗️ New Construction
6404 Pregonero Ln · Houston, TX
Flood risk 1/10 · Minimal
- FEMA flood zone
- X (unshaded)
- Chance of flooding over 30 yrs
- 0.0%
- Est. flood insurance / yr
- $507 – $1,088
Fire risk 4/10 · Minor
- Est. fire insurance / yr
- $1,222 – $2,270
Heat risk 9/10 · Severe
- Hot days now (above 108°F)
- 7 days/yr
- Hot days in 30 yrs
- 24 days/yr
Wind risk 9/10 · Severe
- Chance of severe wind over 30 yrs
- 99.0%
Air-quality risk 2/10 · Minimal
- Unhealthy air days now
- 1 days/yr
- Unhealthy air days in 30 yrs
- 2 days/yr
Risk factors via First Street. Map © Google.
Why this score? — see what drove the D- grade
The composite is a weighted blend of 9 inputs, each scored 0–100. Each bar is that input's sub-score; the figure is the points it added to the 100-point composite (weight × sub-score).
- Cash flow +8.4/30.0
- ARV discount +7.5/15.0
- Appreciation +6.3/10.0
- Livability +3.7/5.0
- Rent growth +2.8/5.0
- Schools +2.7/10.0
- Condition / age +2.5/5.0
- DSCR +2.3/10.0
- 1% rule +2.0/10.0
$274,900
🖨 Deal sheet 📄 Offer letter ✓ Due diligence
Listing remarks
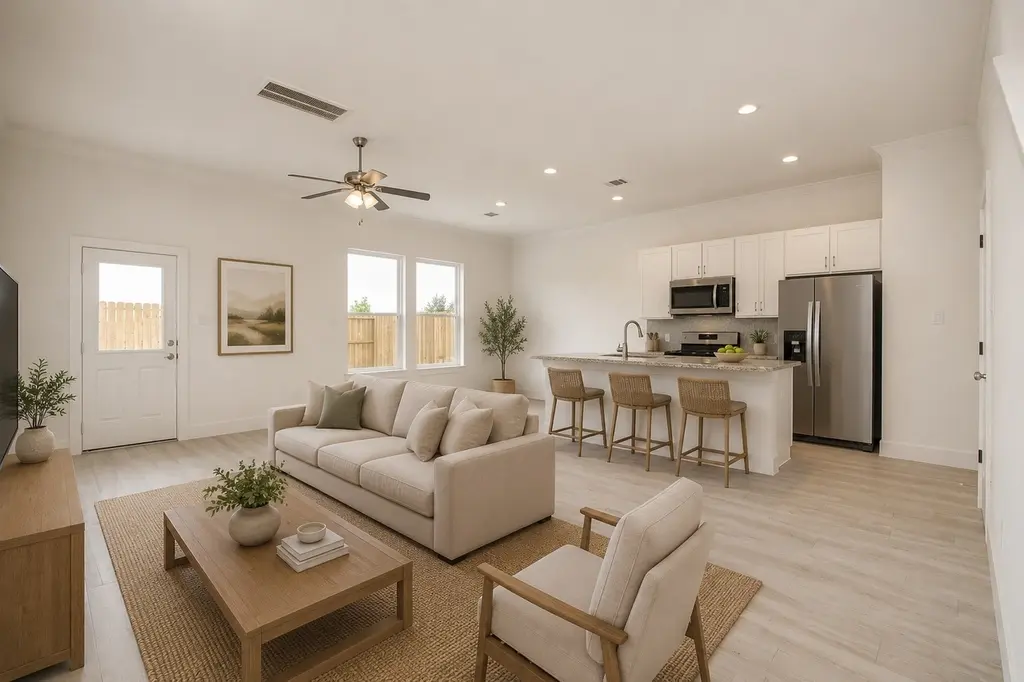
With immaculate precision and craftsmanship, 6404 Pregonero Lane offers the 'Canary' plan in the pre-construction stage. With 1662 sq ft of living space, three bedrooms, and a sizable flex space. Recessed lighting is combined with oversized windows, allowing the easy flow of natural light. A well-executed kitchen offers a sizable granite island. With a gray mosaic tile backsplash. The utility room and a well-executed flex space are central to all bedrooms atop the stair landing. The grand owner's escape offers his & her closets, with a generous soaking tub and a separate shower. Two secondary bedrooms share a jack & jill style bath and round out this space. Thomas Homes is locat
Key facts
- 2,772 sq ft lot
- 2 garage spots
- Built 2026
Property features AI
Finance
- Other: Curbs in community
- HOA & community: Association: Beacon Residential Management; Gated community; Annual association fee covering common areas
Exterior
- Parking: Attached garage; 2-car garage
- Security: Prewired security; Smoke detector(s)
- Utilities: Public water; Public sewer
- Home design: Residential property; Under construction (new construction); Full ownership; Slab foundation; Composition roof; Living area of approximately 1,662; Builder: AGIC
- Construction: Brick and cement siding exterior; Year built: 2026
- Exterior features: Covered patio; Patio; Deck; Fence (back yard); Private yard; Subdivision location; Backs to greenbelt/park; Side yard
Interior
- Kitchen: Dishwasher; Free-standing range; Disposal; Gas oven; Gas range; Microwave
- Bedrooms: Primary bedroom (Second level); Bedroom (Second level); Bedroom (Second level); Office (Second level)
- Flooring: Plank; Tile; Vinyl
- Bathrooms: 2 full bathrooms; 1 half bathroom
- Heating & cooling: Central heating (gas); Central air (electric)
- Interior features: Breakfast bar; Crown molding; Double vanity; Granite counters; High ceilings; Kitchen island; Kitchen/family room combo; Primary bedroom with bath; Pots & pan drawers; Pantry; Soaking tub; Separate shower; Tub/shower combo; Kitchen/dining combo; Living/dining room; Programmable thermostat; Insulated doors; Low emissivity windows
- Laundry & utility: Washer hookup; Electric dryer hookup; Gas dryer hookup
Neighborhood map
What this means for you Summary
Snapshot
- This is a 3-bed/2.5-bath single-family listed at $275k.
Deal economics
- At list price, monthly cash flow is $-250 ($-3k/yr) — negative.
- To cash-flow at today's rent, offer at most $236k (14.2% below list).
- To meet the 1% rule (rent ≥ 1% of price), the offer needs to be $195k (29.1% below list).
- Recommended offer: $195k (29.1% below list) — sets the bar for 1% rule.
- Cap rate 5.2% vs local median 3.2% in Houston — top-decile yield for the area; either an underpriced asset or a hidden risk that comps aren't pricing in. Stress-test before assuming the spread holds.
Location & tenants
- Location reads 74/100 on livability (#184 in TX, #4,771 nationally) — a middle-class / working-renter tenant base. Strengths: amenities A+, cost of living A+, housing A+; Watch: crime F.
- Houston ISD (urban): math 27% / reading 35% proficiency, ranked #593 of 826 in TX (top 72%) — families likely to look elsewhere, expect single-tenant / working-renter base with shorter leases; 71% free/reduced lunch — lower-income household profile, screen leases tightly.
- Zoned schools: Thomas Middle (math 3% / reading 13%, grade F, #1,654 of 1,662 statewide, top 100%, 526 students, 98% FRL); Sterling H S (math 16% / reading 27%, grade F, #1,377 of 1,632 statewide, top 85%, 1,421 students, 92% FRL) — zoned schools average 95% FRL vs 71% district-wide (24 pts higher); higher-poverty schools than district average — tighter screening recommended.
- Zoned-school proficiency averages 15% at this address vs 31% district-wide (-16 pts) — the specific schools serving this property underperform the Houston ISD average; the district grade overstates school quality for this exact location.
- Market conditions: Rents rising (+1.2%/yr); 303 active listings in the ZIP; 5 comparable units currently listed for rent nearby; rentals at typical pace (median 19d on market — plan ~3-4 weeks tenant-placement turnaround); 40% of comp listings sitting > 30 days — soft ceiling on asking rent; 29,883 units permitted in Harris County in 2024 (8,621 in 5+ unit buildings).
- This rent runs 41% of the median local income ($57k/yr) — at the standard rent-burdened threshold; future hikes will face affordability resistance.
Forward outlook
- In year one you build about $9k of equity ($2k loan paydown + $7k appreciation (2.6% local appreciation)).
- Harris County population projected at +47% by 2050 — long-run rental-demand tailwind backs the buy-and-hold thesis.
- By year 4, paydown + projected appreciation supports a ~$32k cash-out refi (75% LTV) — recoverable capital for the next deal without selling this one.
Negotiation context
- It's been on market 44 days — a 3% lower offer ($267k) is reasonable based on typical stale-listing flexibility.
- 6 sale attempts with the ask held roughly flat each time — persistent listings suggest the price (not the market) is what's stuck; bring a comps-based counter.
Risks & watch-outs
- Climate carrying-cost: severe wind risk, 99% chance of damaging wind over 30y; extreme-heat days projected 7→24/yr by 2055 (HVAC capex compounding) — expect insurance premiums to compound above CPI over the hold.
Questions for the listing agent
- What do current leases actually rent for vs. the listed asking? Can we see a recent rent roll and the last 12 months of T-12 income?
- It's been on market 44 days. Have you received any prior offers? Is the seller open to a 29% concession, seller financing, or rate buy-down credit?
- What does the HOA fee cover, when was the last increase, and are there any pending special assessments or reserve-fund shortfalls?
- Is there a deadline driving the sale (1031 exchange, divorce, estate, relocation)? That informs how much negotiation room exists.
- Schools are D-rated, which usually means shorter tenancies and higher turnover. Who's the typical renter profile here, and what's been the actual vacancy rate?
- Crime grade is F in this area — have there been break-ins, vandalism, or insurance claims at this property in the last 3 years? What carrier currently insures it and at what premium?
- The area grade is low — what's the realistic commute time and amenity access for the typical tenant pool here? Any planned neighborhood developments (good or bad) we should know about?
- What's the average days-on-market for RENTAL listings here right now (not sales)? A rising rental-DOM trend means longer vacancies and softer asking-rent achievability than the comps imply.
- What's the recent tenant-quality profile in this submarket — average credit score on applications, eviction rate, late-payment / NSF rate, and stable-employment percentage? A property-management company in the area should have these aggregated.
- How much new for-sale + rental construction is in the pipeline within 1–3 miles? Heavy new supply typically softens prices + rents 12–24 months out; constrained supply supports both.
Investment metrics
- 1% rule
- 0.70% ✗
- Cap rate
- 5.22%
- Cash-on-cash
- -3.83%
- DSCR
- 0.83
- GRM
- 12.0
CMA / ARV
- ARV (median comp)
- $280,045
- List price
- $274,900
- Delta
- -1.84%
- Verdict
- FAIR
- Comps
- 20 within 1.0 mi
Show comp detail 12 sales within ~0.75 mi
| Address | Dist | Beds/Ba | Sqft | Sold | Price | $/sf | Match |
|---|---|---|---|---|---|---|---|
| 6408 Pregonero Ln | 0.01mi | 3/3.5 | 1,971 (+10%) | 3mo | $319,900 | $162 | 76 |
| 6715 Cortenridge Ln | 0.33mi | 3/2.0 | 1,704 (-5%) | 7mo | $269,000 | $158 | 68 |
| 6518 Macroom Meadows Ln | 0.36mi | 3/2.5 | 1,656 (-8%) | 6mo | $254,950 | $154 | 66 |
| 6534 Brimridge Ln | 0.27mi | 3/2.0 | 1,605 (-10%) | 5mo | $262,000 | $163 | 64 |
| 6121 Perth St | 0.53mi | 3/2.0 | 1,859 (+4%) | 7mo | $229,999 | $124 | 61 |
| 13323 Ardery Meadow Dr | 0.46mi | 4/2.5 (+1) | 1,918 (+7%) | 2mo | $289,000 | $151 | 60 |
| 6508 Macroom Meadows Ln | 0.34mi | 3/2.0 | 1,567 (-13%) | 3mo | $240,000 | $153 | 59 |
| 13315 Colina Meadows Ln | 0.51mi | 3/2.5 | 1,636 (-9%) | 6mo | $245,000 | $150 | 57 |
| 6418 Macroom Meadows Ln | 0.27mi | 3/2.0 | 1,537 (-14%) | 8mo | $234,900 | $153 | 55 |
| 13309 Myrtle Meadows Ln | 0.50mi | 3/2.5 | 2,029 (+13%) | 1mo | $265,000 | $131 | 54 |
| 6734 Brimridge Ln | 0.35mi | 3/3.0 | 1,528 (-15%) | 4mo | $260,900 | $171 | 53 |
| 6730 Dayridge Ln | 0.44mi | 3/2.0 | 1,536 (-14%) | 7mo | $259,900 | $169 | 47 |
Match score weights: distance 35% · size 25% · config 20% · recency 20%. Top-matched comps best support the ARV.
Projected returns pro-forma
2.61% appreciation · 1.17% rent growth · sell at horizon
- IRR
- 1.9%
- Equity multiple
- 1.11×
- Total profit
- $8,511
- Equity at exit
- $119,844
- IRR
- 4.9%
- Equity multiple
- 1.71×
- Total profit
- $55,332
- Equity at exit
- $180,101
Cash invested: $78,413 (down + closing). Projections, not guarantees.
Landlord ↔ Tenant lean methodology
- Overall (STATE)
- 87 Strongly Landlord-Friendly
- State Texas
- 87 Strongly Landlord-Friendly · R+5
- County
- — inherits STATE
- City
- — inherits STATE
ZIP-level market 77048
- Home prices YoY
- 1.0%
- Rents YoY
- 1.2%
- Active inventory
- 303
- Price-to-rent
- 11.7×
Monthly cashflow live
- Estimated rent
- $1,950 high interval (Pro) →
- Mortgage (P&I)
- −$1,469
- Tax from tax record
- −$84 /mo · $1,011/yr
- Insurance
- −$117
- HOA
- −$121
- Vacancy / Maint / Mgmt
- −$409
- Net cashflow
- $-250
Break-even live
UW: 25.0% down · 7.5% · 30yr · 1.5% tax · 5.0% vac · 8.0% maint · 8.0% mgmt
Financing live
Cash to close
- Down payment
- $70,011
- Closing costs
- $8,401
- Reserves months
- —
- Total cash needed
- —
Loan-product check · same deal, 3 products live
Conventional
25% down · 7.5% · 30yr
- Down + closing
- —
- Monthly P&I
- —
- Monthly cashflow
- —
- DSCR
- —
- Eligible?
- —
Personal DTI + credit; lowest rate.
DSCR
20% down · 8.5% · 30yr
- Down + closing
- —
- Monthly P&I
- —
- Monthly cashflow
- —
- DSCR
- —
- Eligible?
- —
No personal income docs; deal must DSCR.
Hard money
10% down · 12.0% · 12mo
- Down + closing
- —
- Monthly P&I
- —
- Monthly cashflow
- —
- DSCR
- —
- Eligible?
- —
Short-term bridge; refi at stabilization.
Rent comps 5 comps
| Address | Beds | Baths | Sqft | Rent | $/sqft | DOM | Units | Dist |
|---|---|---|---|---|---|---|---|---|
| 6450 Dayridge Ln Houston, TX | 3.0 | 2.0 | 1415 | $1,820 | $1.29 | 18d | 1 | 0.38mi |
| 6543 Castle Loch Ct Houston, TX | 3.0 | 2.5 | 1709 | $1,995 | $1.17 | 15d | 1 | 0.47mi |
| 5919 Allison Rd Unit B Houston, TX | 4.0 | 2.5 | 1450 | $1,850 | $1.28 | 43d | 1 | 0.68mi |
| 14220 S Wayside Dr Houston, TX | 1.0–4.0 | 1.0–2.0 | 1093 | $1,431 | $1.31 | 10d | 12 | 0.87mi |
| 10647 Cashew Run Ln Houston, TX | 3.0 | 2.0 | 1515 | $2,100 | $1.39 | 43d | 1 | 1.12mi |
HOA detail
- Monthly dues
- $121 · $1,452/yr
Listing history 24 events
-
2026-06-18days on market $274,900 Active 44 DOM
-
2026-06-17days on market $274,900 Active 43 DOM
-
2026-06-16days on market $274,900 Active 42 DOM
-
2026-06-15days on market $274,900 Active 41 DOM
-
2026-06-13days on market $274,900 Active 39 DOM
-
2026-06-10pricedays on market $274,900 Active 35 DOM
-
2026-06-08days on market $278,900 Active 34 DOM
-
2026-06-07days on market $278,900 Active 33 DOM
-
2026-06-04days on market $278,900 Active 30 DOM
-
2026-06-01days on market $278,900 Active 27 DOM
-
2026-05-31days on market $278,900 Active 26 DOM
-
2026-05-13price $278,900 752-char remark
-
2026-05-05$288,900 Active 752-char remark
-
2026-05-05historical
-
2026-01-19price $288,900
-
2026-01-05$299,900 Active
-
2026-01-05historical
-
2025-10-01$299,900 Active
-
2025-09-23historical
-
2025-08-28$269,900 Active
-
2025-08-28historical
-
2025-08-28$269,900 Active
-
2025-08-27historical
-
2025-03-11$269,900 Active
ⓘ Source: listings_history table (triggers on properties + properties_extension) + one-shot
backfill from property_details.listing_events for pre-trigger history.
Tax reassessment forecast TX · Resets to sale price
- Current annual tax
- $1,011 · $84/mo
- Projected year-2 tax
- $5,031 · $419/mo
- Expected delta
- +$4,020/yr (+$335/mo · 397.8%)
ⓘ Screening estimate from a state-policy table — verify with the county assessor before closing.
Climate risk First Street
- Flood 1/10 Low FEMA zone X (unshaded) · 0% chance over 30 yrs
- Wildfire 4/10 Moderate
- Heat 9/10 Extreme 7 d/yr ≥108°F today · 24 d/yr by 30 yrs out
- Wind 9/10 Extreme 99% chance of damaging wind over 30 yrs
- Air quality 2/10 Low 1 unhealthy d/yr today · 2 by 30 yrs out
Nearby sold comps map
Loading sold comps map…
Walkable amenities ~0.75 mi
Loading nearby amenities…
Taxation est. · year 1
- Rental income
- $23,399
- − Mortgage interest
- −$15,687
- − Property taxes
- −$1,011
- − Insurance
- −$1,400
- − Repairs & maintenance
- −$1,872
- − Management
- −$1,872
- − HOA
- −$1,452
- − Depreciation
- −$8,147
- Taxable loss
- −$8,041
- Est. tax savings @ 24.0%
- +$1,930
- After-tax cash flow
- $-1,071/yr
For passive investors: Depreciation is non-cash, so a rental often shows a tax loss while cash-flowing — sheltering income. Rental losses are passive: they offset passive income freely, and up to $25,000/yr can offset ordinary (W-2) income if you actively participate and your MAGI is under $100k (phasing out to $0 by $150k); unused losses carry forward. On sale, claimed depreciation is recaptured at up to 25%, and gains may owe capital-gains tax (a 1031 exchange can defer both). Figures are a year-1 estimate at your 24.0% rate — not tax advice; consult a CPA.
Schools (NCES district)
- District
- Houston ISD
- NCES district ID
- 4823640
- Math proficiency
- 27% ▼ -18.00%
- Reading proficiency
- 35% ▼ -6.00%
- Median HH income
- $46,054
- Composite
- 26.63/100
- National rank
- #7173
- State rank
- #593 of 826 in TX
Livability — Houston
- Score
- 74/100
- State rank
- #184
- US rank
- #4771
Category grades
Schools grade is shown separately in the Schools card above.
Census & demographics
- Census place
- Houston, TX
- County
- Harris County · 4,702,590 people
- City population
- 3,226,434
- Metro
- Houston-The Woodlands-Sugar Land, TX
- Population (ZIP)
- 21,151
- Household income
- $56,747
- Rent vs Own
- Severe rent burden
- 1117.0
Population outlook (Harris County) Hauer SSP2
- Today (2025)
- 5,571,493 people
- By 2030
- 6,089,821 · +9.3%
- By 2040
- 7,142,806 · +28.2%
- By 2050
- 8,185,864 · +46.9%
- By 2075
- 10,574,329 · +89.8%
- By 2100
- 12,109,958 · +117.4%
Race, ethnicity, and origin ACS 2023
- Neighborhood character
- Predominantly Black (69%)
- Race & ethnicity
- Black 69% Hispanic / Latino 24% Two or more races 6% Asian 3% White 2%
- Hispanic origin (detail)
- Mexican 17% Puerto Rican 1%
- Foreign-born
- 12% · Canada, Vietnam
- Languages at home
- 76% English-only · Spanish 20% Tagalog/Filipino 2% Vietnamese 1%
Political lean MEDSL · Harris
- 2024 margin
- Lean D (+5.5) · D 52.0% · R 46.4% · Other 1.6%
- 2008→2024 swing
- +3.9pp toward D · 2008: 1.6pp · 2024: 5.5pp
- All cycles
- 2024: D+5.5 2020: D+13.3 2016: D+12.4 2012: D+0.1 2008: D+1.6
Not yet ingested
- Civics
- —
Market trends
- HPI YoY
- ▲ 2.61%
- Current HPI
- 266.4468
- Rent YoY
- ▲ 1.17%
- Metro
- Houston-The Woodlands-Sugar Land, TX
- State GDP YoY
- ▲ 3.95%
- F500 in state
- 110
Industry mix (Fortune 500 HQ in TX)
| Industry | F500 HQs | Revenue |
|---|---|---|
| Energy | 16 | $1,198B |
|
||
| Technology | 5 | $198B |
|
||
| Engineering / Construction | 4 | $72B |
|
||
| Energy Services | 3 | $60B |
|
||
| Utilities | 3 | $41B |
|
||
| Healthcare | 2 | $330B |
|
||
Price history
+1.9% since first listed14 events — show timeline
- 2026-06-09 Price Changed $274,900 HARMLS
- 2026-05-13 Price Changed $278,900 HARMLS
- 2026-05-05 Listing Removed — HARMLS
- 2026-05-05 Listed $288,900 HARMLS
- 2026-01-19 Price Changed $288,900 HARMLS
- 2026-01-05 Listing Removed — HARMLS
- 2026-01-05 Listed $299,900 HARMLS
- 2025-10-01 Listed $299,900 HARMLS
- 2025-09-23 Listing Removed — HARMLS
- 2025-08-28 Listed $269,900 HARMLS
- 2025-08-28 Listing Removed — HARMLS
- 2025-08-28 Listed $269,900 HARMLS
- 2025-08-27 Listing Removed — HARMLS
- 2025-03-11 Listed $269,900 HARMLS
Property tax history
+40.9%/yrLatest (2025): $1,011 · +21.9% YoY. Source: county tax records.
Cash-flow waterfall
monthlySold comps — $/sqft
last 12 mo · ≤1 miLoading sold comps…