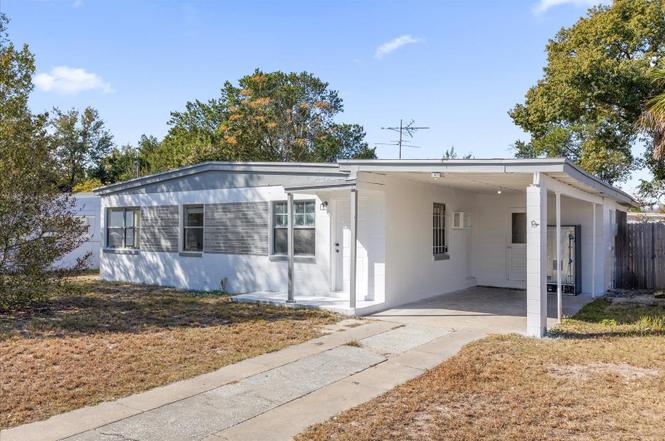
920 Hacienda Ct · Pine Hills, FL
Flood risk 1/10 · Minimal
- FEMA flood zone
- X (unshaded)
- Chance of flooding over 30 yrs
- 0.0%
- Est. flood insurance / yr
- $507 – $1,088
Fire risk 1/10 · Minimal
- Est. fire insurance / yr
- $947 – $1,759
Heat risk 9/10 · Severe
- Hot days now (above 108°F)
- 7 days/yr
- Hot days in 30 yrs
- 25 days/yr
Wind risk 9/10 · Severe
- Chance of severe wind over 30 yrs
- 99.0%
Air-quality risk 1/10 · Minimal
- Unhealthy air days now
- 0 days/yr
- Unhealthy air days in 30 yrs
- 0 days/yr
Risk factors via First Street. Map © Google.
Why this score? — see what drove the D grade
The composite is a weighted blend of 9 inputs, each scored 0–100. Each bar is that input's sub-score; the figure is the points it added to the 100-point composite (weight × sub-score).
- Cash flow +13.7/30.0
- ARV discount +7.5/15.0
- DSCR +4.1/10.0
- Schools +4.1/10.0
- Livability +3.7/5.0
- 1% rule +3.5/10.0
- Condition / age +2.5/5.0
- Rent growth +2.4/5.0
- Appreciation +0.0/10.0
$225,000
🖨 Deal sheet 📄 Offer letter ✓ Due diligence
Listing remarks
One or more photo(s) has been virtually staged. Tucked away in an established Orlando neighborhood, this well-located home offers both comfort and convenience. Enjoy easy access to major roadways, shopping, dining, and everyday essentials, all just minutes away. Located close to downtown Orlando, local parks, and area schools, this property provides effortless commutes throughout Central Florida. Whether you’re searching for a primary residence or a smart investment opportunity, this home delivers outstanding potential in a growing area. Don’t miss your chance—schedule your private showing today!
Key facts
- Area schools
- Local parks
- Growing area
Tags
Property features AI
Finance
- Other: Zoning: R-1A; Lot surfaced with asphalt road access
- Financial info: No lease restrictions; Unfurnished
- HOA & community: No HOA association indicated
Exterior
- Parking: Carport (1 space)
- Utilities: Public water; Public sewer; Broadband/high-speed internet available
- Home design: Single family residence; Residential property; One story; Faces east
- Construction: Block and stucco construction; Other roof; Slab foundation; Built on a 0.15 acre lot
- Exterior features: Sidewalk
Interior
- Kitchen: Range; Refrigerator
- Bedrooms: 3 bedrooms
- Flooring: Tile; Vinyl
- Bathrooms: 1 full bathroom
- Heating & cooling: Central heating; Central air conditioning
- Interior features: Ceiling fans
- Laundry & utility: Washer hookup; Electric dryer hookup
Neighborhood map
What this means for you Summary
Snapshot
- This is a 3-bed/1.0-bath single-family listed at $225k.
Deal economics
- At list price, monthly cash flow is $17 ($206/yr) — positive.
- The deal already cash-flows at list — no discount required.
- To meet the 1% rule (rent ≥ 1% of price), the offer needs to be $191k (15.1% below list).
- Recommended offer: $191k (15.1% below list) — sets the bar for 1% rule.
- Cap rate 6.4% vs local median 4.9% in Pine Hills — top-decile yield for the area; either an underpriced asset or a hidden risk that comps aren't pricing in. Stress-test before assuming the spread holds.
Location & tenants
- Location reads 73/100 on livability (#317 in FL) — a middle-class / working-renter tenant base. Strengths: commute A+, cost of living A+, housing A+; Watch: crime D+, employment D, amenities F.
- Orange (suburban): math 46% / reading 51% proficiency, ranked #43 of 73 in FL (top 59%) — families likely to look elsewhere, expect single-tenant / working-renter base with shorter leases.
- Zoned schools: Pine Hills Elementary (math 21% / reading 20%, grade F, #2,094 of 2,144 statewide, top 98%, 669 students, 83% FRL); Maynard Evans High (math 12% / reading 27%, grade F, #562 of 667 statewide, top 85%, 2,417 students, 69% FRL) — zoned schools average 76% FRL vs 56% district-wide (20 pts higher); higher-poverty schools than district average — tighter screening recommended.
- Zoned-school proficiency averages 20% at this address vs 48% district-wide (-28 pts) — the specific schools serving this property underperform the Orange average; the district grade overstates school quality for this exact location.
- Market conditions: Rents soft (-0.3%/yr); 246 active listings in the ZIP; 16 comparable units currently listed for rent nearby; rentals at typical pace (median 24d on market — plan ~3-4 weeks tenant-placement turnaround); 8,053 units permitted in Orange County in 2024 (3,133 in 5+ unit buildings).
Forward outlook
- Local home prices are declining (-3.0%/yr); year-one equity from $2k of loan paydown is wiped out by about $7k of value loss. Plan a longer hold.
- Orange County population projected at +52% by 2050 — long-run rental-demand tailwind backs the buy-and-hold thesis.
Negotiation context
- It's been on market 120 days — a 9% lower offer ($205k) is reasonable based on typical stale-listing flexibility.
- 8 sale attempts since 19y ago; this cycle's ask is 11150% above the opening price — seller raised mid-cycle; expect resistance to lowballs.
- Current owner paid $41k; list at $225k implies a 450% gain — meaningful room to come down on a strong offer.
Risks & watch-outs
- Watch-outs: built in 1955 — expect roof / HVAC / electrical / plumbing capex.
- Climate carrying-cost: severe wind risk, 99% chance of damaging wind over 30y; extreme-heat days projected 7→25/yr by 2055 (HVAC capex compounding) — expect insurance premiums to compound above CPI over the hold.
Questions for the listing agent
- It's been on market 120 days. Have you received any prior offers? Is the seller open to a 15% concession, seller financing, or rate buy-down credit?
- Built in 1955 — when were the roof, HVAC, electrical panel, plumbing, and water heater last replaced?
- Why hasn't it sold? Are there any deal-killer items the seller is aware of (foundation, flood, title, zoning, code violations)?
- Is there a deadline driving the sale (1031 exchange, divorce, estate, relocation)? That informs how much negotiation room exists.
- Schools are B-rated — typically a magnet for longer-tenancy family renters. What's the average tenant stay here, and is there a school-zone premium baked into asking?
- Crime grade is D in this area — have there been break-ins, vandalism, or insurance claims at this property in the last 3 years? What carrier currently insures it and at what premium?
- The area grade is low — what's the realistic commute time and amenity access for the typical tenant pool here? Any planned neighborhood developments (good or bad) we should know about?
- What's the average days-on-market for RENTAL listings here right now (not sales)? A rising rental-DOM trend means longer vacancies and softer asking-rent achievability than the comps imply.
- What's the recent tenant-quality profile in this submarket — average credit score on applications, eviction rate, late-payment / NSF rate, and stable-employment percentage? A property-management company in the area should have these aggregated.
- How much new for-sale + rental construction is in the pipeline within 1–3 miles? Heavy new supply typically softens prices + rents 12–24 months out; constrained supply supports both.
Investment metrics
- 1% rule
- 0.85% ✗
- Cap rate
- 6.38%
- Cash-on-cash
- 0.33%
- DSCR
- 1.01
- GRM
- 9.8
CMA / ARV
No comps found within radius.
Projected returns pro-forma
-3.0% appreciation · 0.0% rent growth · sell at horizon
- IRR
- -19.1%
- Equity multiple
- 0.35×
- Total profit
- $-40,977
- Equity at exit
- $33,548
- IRR
- -19.1%
- Equity multiple
- 0.11×
- Total profit
- $-55,957
- Equity at exit
- $19,454
Cash invested: $63,000 (down + closing). Projections, not guarantees.
Landlord ↔ Tenant lean methodology
- Overall (STATE)
- 87 Strongly Landlord-Friendly
- State Florida
- 87 Strongly Landlord-Friendly · R+3
- County
- — inherits STATE
- City
- — inherits STATE
ZIP-level market 32808
- Home prices YoY
- -22.6%
- Rents YoY
- -0.3%
- Active inventory
- 246
- Price-to-rent
- 9.8×
Monthly cashflow live
- Estimated rent
- $1,911 high interval (Pro) →
- Mortgage (P&I)
- −$1,180
- Tax from tax record
- −$219 /mo · $2,625/yr
- Insurance
- −$94
- HOA
- −$0
- Vacancy / Maint / Mgmt
- −$401
- Net cashflow
- $17
Break-even live
UW: 25.0% down · 7.5% · 30yr · 1.5% tax · 5.0% vac · 8.0% maint · 8.0% mgmt
Financing live
Cash to close
- Down payment
- $56,250
- Closing costs
- $6,750
- Reserves months
- —
- Total cash needed
- —
Loan-product check · same deal, 3 products live
Conventional
25% down · 7.5% · 30yr
- Down + closing
- —
- Monthly P&I
- —
- Monthly cashflow
- —
- DSCR
- —
- Eligible?
- —
Personal DTI + credit; lowest rate.
DSCR
20% down · 8.5% · 30yr
- Down + closing
- —
- Monthly P&I
- —
- Monthly cashflow
- —
- DSCR
- —
- Eligible?
- —
No personal income docs; deal must DSCR.
Hard money
10% down · 12.0% · 12mo
- Down + closing
- —
- Monthly P&I
- —
- Monthly cashflow
- —
- DSCR
- —
- Eligible?
- —
Short-term bridge; refi at stabilization.
Rent comps 16 comps
| Address | Beds | Baths | Sqft | Rent | $/sqft | DOM | Units | Dist |
|---|---|---|---|---|---|---|---|---|
| 520 Hacienda Ct Pine Hills, FL | 3.0 | 1.0 | 825 | $1,850 | $2.24 | 23d | 1 | 0.07mi |
| 1020 barnett villas Dr Orlando, FL | 1.0–3.0 | 1.0–2.0 | 934 | $1,930 | $2.07 | 23d | 1 | 0.29mi |
| 812 N Hudson St Pine Hills, FL | 2.0 | 2.0 | 950 | $1,600 | $1.68 | 23d | 1 | 0.38mi |
| 1214 N Pine Hills Rd Unit 1 Orlando, FL | 4.0 | 2.0 | 1069 | $3,900 | $3.65 | 20d | 1 | 0.62mi |
| 5505 Hernandes Dr #113 Orlando, FL | 2.0 | 1.0 | 728 | $1,175 | $1.61 | 23d | 1 | 0.90mi |
| 1407 Sunridge Rd Orlando, FL | 3.0 | 2.0 | 1124 | $1,945 | $1.73 | 7d | 1 | 0.91mi |
| 6119 Melbourne Ave Orlando, FL | 3.0 | 2.0 | 1109 | $1,999 | $1.80 | 20d | 1 | 0.92mi |
| 4901 Hernandes Dr Orlando, FL | 4.0 | 2.0 | 1124 | $1,830 | $1.63 | 23d | 1 | 0.93mi |
| 1529 Ridge Pointe Dr Orlando, FL | 3.0 | 2.0 | 1108 | $1,995 | $1.80 | 7d | 1 | 0.94mi |
| 1537 Ridge Pointe Dr Orlando, FL | 3.0 | 2.0 | 1108 | $2,200 | $1.99 | 23d | 1 | 0.95mi |
| 2203 Silver Pines Pl #601 Orlando, FL | 2.0 | 1.0 | 962 | $1,500 | $1.56 | 23d | 1 | 1.08mi |
| 5402 Pine Chase Dr Orlando, FL | 2.0–3.0 | 2.0 | 1133 | $1,695 | $1.50 | 1d | 4 | 1.15mi |
| 5600 Silver Star Rd Orlando, FL | 1.0–3.0 | 1.0–2.0 | 850 | $1,545 | $1.82 | 14d | 6 | 1.32mi |
| 1216 Lawne Blvd Orlando, FL | 3.0 | 2.0 | 1000 | $1,800 | $1.80 | 23d | 1 | 1.36mi |
| 7097 Balboa Dr #7097 Orlando, FL | 2.0 | 1.0 | 1042 | $1,500 | $1.44 | 23d | 1 | 1.38mi |
| 6872 Alta Westgate Dr Orlando, FL | 2.0–3.0 | 2.0 | 1190 | $1,700 | $1.43 | 7d | 1 | 1.49mi |
Listing history 29 events
-
2026-06-18days on market $225,000 Active 120 DOM
-
2026-06-17days on market $225,000 Active 119 DOM
-
2026-06-16days on market $225,000 Active 118 DOM
-
2026-06-15days on market $225,000 Active 117 DOM
-
2026-06-13days on market $225,000 Active 115 DOM
-
2026-06-13days on market $225,000 Active 114 DOM
-
2026-06-09days on market $225,000 Active 111 DOM
-
2026-06-08days on market $225,000 Active 110 DOM
-
2026-06-07days on market $225,000 Active 109 DOM
-
2026-06-04days on market $225,000 Active 106 DOM
-
2026-06-03days on market $225,000 Active 105 DOM
-
2026-06-02days on market $225,000 Active 104 DOM
-
2026-06-02days on market $225,000 Active 103 DOM
-
2026-05-31days on market $225,000 Active 102 DOM
-
2026-05-08$2,000
-
2026-02-18$225,000 Active
-
2025-11-19historical
-
2025-09-22status Active
-
2025-09-11status Pending
-
2025-09-03price $200,000
-
2025-08-27status Active
-
2025-08-22status Pending
-
2025-08-08status Active
-
2025-07-10status Active
-
2025-06-12status Pending
-
2025-06-12$215,000 Active
-
2007-03-26$165,000
-
1996-03-11soldstatus $40,900
-
1971-06-01soldstatus $13,500
ⓘ Source: listings_history table (triggers on properties + properties_extension) + one-shot
backfill from property_details.listing_events for pre-trigger history.
Tax reassessment forecast FL · Resets to sale price
- Current annual tax
- $2,625 · $219/mo
- Projected year-2 tax
- $2,625 · $219/mo
- Expected delta
- $0/yr ($0/mo · 0.0%)
ⓘ Screening estimate from a state-policy table — verify with the county assessor before closing.
Climate risk First Street
- Flood 1/10 Low FEMA zone X (unshaded) · 0% chance over 30 yrs
- Wildfire 1/10 Low
- Heat 9/10 Extreme 7 d/yr ≥108°F today · 25 d/yr by 30 yrs out
- Wind 9/10 Extreme 99% chance of damaging wind over 30 yrs
- Air quality 1/10 Low 0 unhealthy d/yr today · 0 by 30 yrs out
Nearby sold comps map
Loading sold comps map…
Walkable amenities ~0.75 mi
Loading nearby amenities…
Taxation est. · year 1
- Rental income
- $22,930
- − Mortgage interest
- −$12,603
- − Property taxes
- −$2,625
- − Insurance
- −$1,125
- − Repairs & maintenance
- −$1,834
- − Management
- −$1,834
- − Depreciation
- −$6,545
- Taxable loss
- −$3,638
- Est. tax savings @ 24.0%
- +$873
- After-tax cash flow
- $1,079/yr
For passive investors: Depreciation is non-cash, so a rental often shows a tax loss while cash-flowing — sheltering income. Rental losses are passive: they offset passive income freely, and up to $25,000/yr can offset ordinary (W-2) income if you actively participate and your MAGI is under $100k (phasing out to $0 by $150k); unused losses carry forward. On sale, claimed depreciation is recaptured at up to 25%, and gains may owe capital-gains tax (a 1031 exchange can defer both). Figures are a year-1 estimate at your 24.0% rate — not tax advice; consult a CPA.
Schools (NCES district)
- District
- Orange
- NCES district ID
- 1201440
- Math proficiency
- 46% ▼ -9.00%
- Reading proficiency
- 51% ▼ -2.00%
- Median HH income
- $49,350
- Composite
- 41.47/100
- National rank
- #3461
- State rank
- #43 of 73 in FL
Livability — Pine Hills
- Score
- 73/100
- State rank
- #317
- US rank
- #5362
Category grades
Schools grade is shown separately in the Schools card above.
Census & demographics
- Census place
- Pine Hills, FL
- County
- Orange County · 1,471,359 people
- City population
- 60,203
- Metro
- Orlando-Kissimmee-Sanford, FL
- Population (ZIP)
- 60,203
- Household income
- $49,700
- Rent vs Own
- Severe rent burden
- 4039.0
Population outlook (Orange County) Hauer SSP2
- Today (2025)
- 1,618,226 people
- By 2030
- 1,787,404 · +10.5%
- By 2040
- 2,125,621 · +31.4%
- By 2050
- 2,454,016 · +51.6%
- By 2075
- 3,173,711 · +96.1%
- By 2100
- 3,607,781 · +122.9%
Race, ethnicity, and origin ACS 2023
- Neighborhood character
- Predominantly Black (71%)
- Race & ethnicity
- Black 71% Hispanic / Latino 13% White 10% Two or more races 7% Asian 1%
- Hispanic origin (detail)
- Mexican 2% Puerto Rican 5% Dominican 2%
- Common ancestry
- Hispanic 20% Lithuanian 1% Scandinavian 0%
- Foreign-born
- 25% · Canada, Vietnam, Jamaica
- Languages at home
- 69% English-only · French/Haitian/Cajun 18% Spanish 11% Other Indo-European 1%
Political lean MEDSL · Orange
- 2024 margin
- D (+13.6) · D 56.1% · R 42.5% · Other 1.3%
- 2008→2024 swing
- -5.0pp toward R · 2008: 18.6pp · 2024: 13.6pp
- All cycles
- 2024: D+13.6 2020: D+23.1 2016: D+24.6 2012: D+18.2 2008: D+18.6
Not yet ingested
- Civics
- —
Market trends
- HPI YoY
- ▼ -110.15%
- Current HPI
- 376.3801
- Rent YoY
- ▼ -0.27%
- Metro
- Orlando-Kissimmee-Sanford, FL
- State GDP YoY
- ▲ 3.28%
- F500 in state
- 36
Industry mix (Fortune 500 HQ in FL)
| Industry | F500 HQs | Revenue |
|---|---|---|
| Industrial Technology | 2 | $29B |
|
||
| Insurance | 2 | $17B |
|
||
| Retail | 1 | $60B |
|
||
| Technology Distribution | 1 | $58B |
|
||
| Homebuilding | 1 | $35B |
|
||
| Technology Manufacturing | 1 | $35B |
|
||
Price history
-85.2% since first listed15 events — show timeline
- 2026-05-08 Listed for Rent $2,000 APPFOLIO
- 2026-02-18 Listed $225,000 Stellar MLS as Distributed by MLS Grid
- 2025-11-19 Listing Removed — Stellar MLS as Distributed by MLS Grid
- 2025-09-22 Relisted — Stellar MLS as Distributed by MLS Grid
- 2025-09-11 Pending — Stellar MLS as Distributed by MLS Grid
- 2025-09-03 Price Changed $200,000 Stellar MLS as Distributed by MLS Grid
- 2025-08-27 Relisted — Stellar MLS as Distributed by MLS Grid
- 2025-08-22 Pending — Stellar MLS as Distributed by MLS Grid
- 2025-08-08 Relisted — Stellar MLS as Distributed by MLS Grid
- 2025-07-10 Relisted — Stellar MLS as Distributed by MLS Grid
- 2025-06-12 Pending — Stellar MLS as Distributed by MLS Grid
- 2025-06-12 Listed $215,000 Stellar MLS as Distributed by MLS Grid
- 2007-03-26 Listed $165,000 Stellar MLS as Distributed by MLS Grid
- 1996-03-11 Sold (Public Records) $40,900 Public Records
- 1971-06-01 Sold (Public Records) $13,500 Public Records
Property tax history
+12.1%/yrLatest (2025): $2,625 · +10.2% YoY. Source: county tax records.
Cash-flow waterfall
monthlySold comps — $/sqft
last 12 mo · ≤1 miLoading sold comps…