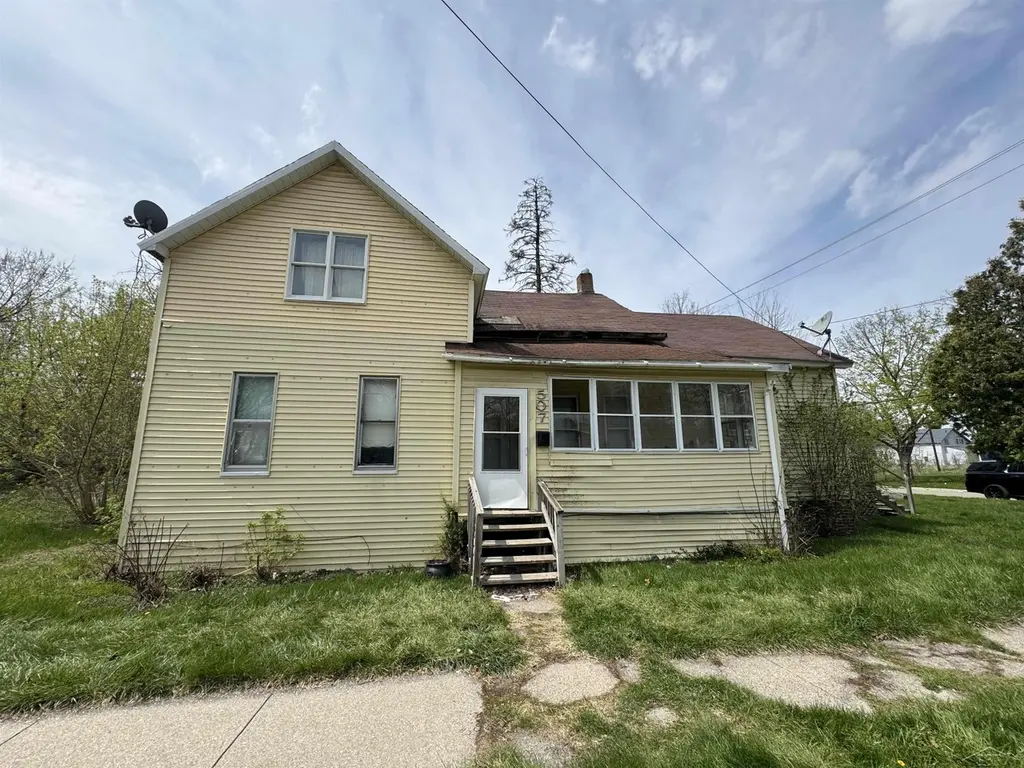
507 S 14th St · Saginaw, MI
Flood risk 3/10 · Minor
- FEMA flood zone
- X (unshaded)
- Chance of flooding over 30 yrs
- 0.2%
- Est. flood insurance / yr
- $473 – $860
Fire risk 1/10 · Minimal
- Est. fire insurance / yr
- $784 – $1,456
Heat risk 2/10 · Minimal
- Hot days now (above 100°F)
- 7 days/yr
- Hot days in 30 yrs
- 14 days/yr
Wind risk 1/10 · Minimal
- Chance of severe wind over 30 yrs
- —
Air-quality risk 2/10 · Minimal
- Unhealthy air days now
- 1 days/yr
- Unhealthy air days in 30 yrs
- 2 days/yr
Risk factors via First Street. Map © Google.
Why this score? — see what drove the D grade
The composite is a weighted blend of 9 inputs, each scored 0–100. Each bar is that input's sub-score; the figure is the points it added to the 100-point composite (weight × sub-score).
- Cash flow +15.0/30.0
- ARV discount +7.5/15.0
- 1% rule +5.0/10.0
- DSCR +5.0/10.0
- Livability +3.2/5.0
- Rent growth +2.5/5.0
- Condition / age +2.5/5.0
- Schools +2.0/10.0
- Appreciation +0.0/10.0
$14,900
🖨 Deal sheet (PDF) 📄 Offer letter ✓ Due diligence
Listing remarks MLS
Bring your vision and tools to this 3 bedroom, 1 bath home situated on a corner lot. Featuring a basement and deck, this property offers plenty of potential for the right buyer. Home requires a full renovation and clean out. Seller is selling the property as is and will not be removing any remaining items. Call today for your personal showing.
Key facts
- Basement
- Deck
- Full renovation
Tags
Property features AI
Finance
- HOA & community: Homeowners association present
Exterior
- Utilities: Public water; Public sewer
- Home design: Single-family residence; One and one-half stories
- Construction: Vinyl siding
- Exterior features: Corner lot; Paved road access; Lot dimensions approximately 95 x 66
Interior
- Bathrooms: 1 full bathroom
- Heating & cooling: Natural gas heating; Steam heating; No cooling
- Interior features: Gas water heater; Basement
Neighborhood map
What this means for you Summary
Snapshot
- This is a 4-bed/1.0-bath single-family listed at $15k.
Deal economics
- At list price, monthly cash flow is $1k ($12k/yr) — positive.
- The deal already cash-flows at list — no discount required.
- Meets the 1% rule at list price ($1k rent vs $15k).
- Recommended offer: $14k (3.0% below list) — sets the bar for market timing.
- Cap rate 88.2% vs local median 8.3% in Saginaw — top-decile yield for the area; either an underpriced asset or a hidden risk that comps aren't pricing in. Stress-test before assuming the spread holds.
Location & tenants
- Location reads 63/100 on livability (#521 in MI) — a middle-class / working-renter tenant base. Strengths: cost of living A+, housing A+, health & safety A+; Watch: schools F, crime F, amenities F.
- Saginaw School District (urban): math 20% / reading 29% proficiency, ranked #444 of 540 in MI (top 82%) — low school quality limits family demand, transient renter base, plan for 1-2y turnover; 76% free/reduced lunch — lower-income household profile, screen leases tightly.
- Market conditions: 199 active listings in the ZIP; 154 units permitted in Saginaw County in 2024 (0 in 5+ unit buildings).
Forward outlook
- Local home prices are declining (-3.0%/yr); year-one equity from $103 of loan paydown is wiped out by about $447 of value loss. Plan a longer hold.
- Saginaw County population projected at -25% by 2050 — secular population decline; favor cash flow + early exit over multi-decade hold.
- At projected returns (-3.0% appreciation + 3.0% rent growth), your $4k cash investment doubles in ~1 year — after that, you're playing with house money.
Negotiation context
- It's been on market 56 days — a 3% lower offer ($14k) is reasonable based on typical stale-listing flexibility.
- 2 sale attempts with the ask held roughly flat each time — persistent listings suggest the price (not the market) is what's stuck; bring a comps-based counter.
Risks & watch-outs
- Watch-outs: built in 1884 — expect roof / HVAC / electrical / plumbing capex.
Questions for the listing agent
- It's been on market 56 days. Have you received any prior offers? Is the seller open to a 3% concession, seller financing, or rate buy-down credit?
- Built in 1884 — when were the roof, HVAC, electrical panel, plumbing, and water heater last replaced?
- Is there a deadline driving the sale (1031 exchange, divorce, estate, relocation)? That informs how much negotiation room exists.
- Schools are F-rated, which usually means shorter tenancies and higher turnover. Who's the typical renter profile here, and what's been the actual vacancy rate?
- Crime grade is F in this area — have there been break-ins, vandalism, or insurance claims at this property in the last 3 years? What carrier currently insures it and at what premium?
- The area grade is low — what's the realistic commute time and amenity access for the typical tenant pool here? Any planned neighborhood developments (good or bad) we should know about?
- What's the average days-on-market for RENTAL listings here right now (not sales)? A rising rental-DOM trend means longer vacancies and softer asking-rent achievability than the comps imply.
- What's the recent tenant-quality profile in this submarket — average credit score on applications, eviction rate, late-payment / NSF rate, and stable-employment percentage? A property-management company in the area should have these aggregated.
- How much new for-sale + rental construction is in the pipeline within 1–3 miles? Heavy new supply typically softens prices + rents 12–24 months out; constrained supply supports both.
Investment metrics
- 1% rule
- 9.61% ✓
- Cap rate
- 88.23%
- Cash-on-cash
- 292.63%
- DSCR
- 14.02
- GRM
- 0.9
CMA / ARV
- ARV (on-the-fly)
- $49,472
- Comps found
- 9
Show comp detail 9 sales within ~0.75 mi
| Address | Dist | Beds/Ba | Sqft | Sold | Price | $/sf | Match |
|---|---|---|---|---|---|---|---|
| 524 S 14th St | 0.04mi | 3/1.5 (-1) | 1,508 (-2%) | 18mo | $27,000 | $18 | 72 |
| 206 S 13th St | 0.35mi | 4/1.0 | 1,633 (+6%) | 7mo | $40,000 | $24 | 68 |
| 1300 Walnut St | 0.37mi | 3/1.0 (-1) | 1,436 (-7%) | 8mo | $5,000 | $3 | 60 |
| 2604 Lapeer Ave | 0.61mi | 3/2.0 (-1) | 1,599 (+3%) | 1mo | $51,500 | $32 | 56 |
| 826 S 13th St | 0.41mi | 3/1.0 (-1) | 1,451 (-6%) | 12mo | $55,000 | $38 | 56 |
| 2317 Hosmer St | 0.46mi | 4/1.0 | 1,500 (-3%) | 22mo | $61,500 | $41 | 55 |
| 426 S 12th St | 0.13mi | 4/1.0 | 1,322 (-14%) | 21mo | $63,000 | $48 | 52 |
| 139 S 19th St | 0.50mi | 3/1.5 (-1) | 1,436 (-7%) | 21mo | $55,000 | $38 | 40 |
| 2225 Hammel St | 0.58mi | 3/1.0 (-1) | 1,316 (-15%) | 24mo | $10,000 | $8 | 23 |
Match score weights: distance 35% · size 25% · config 20% · recency 20%. Top-matched comps best support the ARV.
Projected returns pro-forma
-3.0% appreciation · 3.0% rent growth · sell at horizon
- IRR
- —
- Equity multiple
- 15.96×
- Total profit
- $62,411
- Equity at exit
- $2,222
- IRR
- —
- Equity multiple
- 34.05×
- Total profit
- $137,899
- Equity at exit
- $1,288
Cash invested: $4,172 (down + closing). Projections, not guarantees.
Landlord ↔ Tenant lean methodology
- Overall (STATE)
- 62 Landlord-Friendly
- State Michigan
- 62 Landlord-Friendly · EVEN
- County
- — inherits STATE
- City
- — inherits STATE
ZIP-level market 48601
- Home prices YoY
- -32.1%
- Active inventory
- 199
- Price-to-rent
- 0.9×
Monthly cashflow live
- Estimated rent
- $1,432 medium interval (Pro) →
- Mortgage (P&I)
- −$78
- Tax from tax record
- −$30 /mo · $359/yr
- Insurance
- −$6
- HOA
- −$0
- Vacancy / Maint / Mgmt
- −$301
- Net cashflow
- $1,017
Break-even live
Sensitivity live
| Price | -10% $1,026 | -5% $1,022 | +0% $1,017 | +5% $1,013 | +10% $1,009 |
|---|---|---|---|---|---|
| Rent | -10% $904 | -5% $961 | +0% $1,017 | +5% $1,074 | +10% $1,131 |
| Rate | -1.0pp $1,025 | -0.5pp $1,021 | base $1,017 | +0.5pp $1,014 | +1.0pp $1,010 |
UW: 25.0% down · 7.5% · 30yr · 1.5% tax · 5.0% vac · 8.0% maint · 8.0% mgmt
Financing live
Cash to close
- Down payment
- $3,725
- Closing costs
- $447
- Reserves months
- —
- Total cash needed
- —
Loan-product check · same deal, 3 products live
Conventional
25% down · 7.5% · 30yr
- Down + closing
- —
- Monthly P&I
- —
- Monthly cashflow
- —
- DSCR
- —
- Eligible?
- —
Personal DTI + credit; lowest rate.
DSCR
20% down · 8.5% · 30yr
- Down + closing
- —
- Monthly P&I
- —
- Monthly cashflow
- —
- DSCR
- —
- Eligible?
- —
No personal income docs; deal must DSCR.
Hard money
10% down · 12.0% · 12mo
- Down + closing
- —
- Monthly P&I
- —
- Monthly cashflow
- —
- DSCR
- —
- Eligible?
- —
Short-term bridge; refi at stabilization.
Listing history 18 events
-
2026-06-19days on market $14,900 Active 56 DOM
-
2026-06-18days on market $14,900 Active 55 DOM
-
2026-06-17days on market $14,900 Active 54 DOM
-
2026-06-16days on market $14,900 Active 53 DOM
-
2026-06-15days on market $14,900 Active 52 DOM
-
2026-06-14days on market $14,900 Active 50 DOM
-
2026-06-12days on market $14,900 Active 49 DOM
-
2026-06-09days on market $14,900 Active 46 DOM
-
2026-06-08days on market $14,900 Active 45 DOM
-
2026-06-07days on market $14,900 Active 44 DOM
-
2026-06-05days on market $14,900 Active 41 DOM
-
2026-06-03days on market $14,900 Active 40 DOM
-
2026-06-02days on market $14,900 Active 39 DOM
-
2026-06-01days on market $14,900 Active 38 DOM
-
2026-05-31days on market $14,900 Active 37 DOM
-
2026-05-30days on market $14,900 Active 36 DOM
-
2026-04-24$14,900 Active 345-char remark
Show marketing remark (345 chars)
Bring your vision and tools to this 3 bedroom, 1 bath home situated on a corner lot. Featuring a basement and deck, this property offers plenty of potential for the right buyer. Home requires a full renovation and clean out. Seller is selling the property as is and will not be removing any remaining items. Call today for your personal showing.
-
2026-04-24$14,900 Active
Show marketing remark (345 chars)
Bring your vision and tools to this 3 bedroom, 1 bath home situated on a corner lot. Featuring a basement and deck, this property offers plenty of potential for the right buyer. Home requires a full renovation and clean out. Seller is selling the property as is and will not be removing any remaining items. Call today for your personal showing.
ⓘ Source: listings_history table (triggers on properties + properties_extension) + one-shot
backfill from property_details.listing_events for pre-trigger history.
Tax reassessment forecast MI · Partial reset (capped growth)
- Current annual tax
- $359 · $30/mo
- Projected year-2 tax
- $359 · $30/mo
- Expected delta
- $0/yr ($0/mo · 0.0%)
ⓘ Screening estimate from a state-policy table — verify with the county assessor before closing.
Climate risk First Street
- Flood 3/10 Moderate FEMA zone X (unshaded) · 20% chance over 30 yrs
- Wildfire 1/10 Low
- Heat 2/10 Low 7 d/yr ≥100°F today · 14 d/yr by 30 yrs out
- Wind 1/10 Low
- Air quality 2/10 Low 1 unhealthy d/yr today · 2 by 30 yrs out
Nearby sold comps map
Loading sold comps map…
Walkable amenities ~0.75 mi
Loading nearby amenities…
Taxation est. · year 1
- Rental income
- $17,189
- − Mortgage interest
- −$835
- − Property taxes
- −$359
- − Insurance
- −$74
- − Repairs & maintenance
- −$1,375
- − Management
- −$1,375
- − Depreciation
- −$433
- Taxable income
- $12,737
- Est. tax owed @ 24.0%
- −$3,057
- After-tax cash flow
- $9,151/yr
For passive investors: Depreciation is non-cash, so a rental often shows a tax loss while cash-flowing — sheltering income. Rental losses are passive: they offset passive income freely, and up to $25,000/yr can offset ordinary (W-2) income if you actively participate and your MAGI is under $100k (phasing out to $0 by $150k); unused losses carry forward. On sale, claimed depreciation is recaptured at up to 25%, and gains may owe capital-gains tax (a 1031 exchange can defer both). Figures are a year-1 estimate at your 24.0% rate — not tax advice; consult a CPA.
Schools (NCES district)
- District
- Saginaw School District
- NCES district ID
- 2630390
- Math proficiency
- 20% ▼ -5.00%
- Reading proficiency
- 29% ▼ -3.00%
- Median HH income
- $28,940
- Composite
- 19.6/100
- National rank
- #8755
- State rank
- #444 of 540 in MI
Livability — Saginaw
- Score
- 63/100
- State rank
- #521
- US rank
- #15424
Category grades
Schools grade is shown separately in the Schools card above.
Census & demographics
- Census place
- Saginaw, MI
- City population
- 54,884
- Population (ZIP)
- 32,069
Population outlook (Saginaw County) Hauer SSP2
- Today (2025)
- 180,568 people
- By 2030
- 172,302 · -4.6%
- By 2040
- 153,919 · -14.8%
- By 2050
- 135,519 · -24.9%
- By 2075
- 97,199 · -46.2%
- By 2100
- 65,037 · -64.0%
Race, ethnicity, and origin ACS 2023
- Neighborhood character
- Diverse neighborhood (Simpson 0.56)
- Race & ethnicity
- Black 59% White 27% Hispanic / Latino 12% Two or more races 5%
- Hispanic origin (detail)
- Mexican 10%
- Common ancestry
- Romanian 2% Lithuanian 2%
- Foreign-born
- 1% · Canada
- Languages at home
- 96% English-only · Spanish 4%
Political lean MEDSL · Saginaw
- 2024 margin
- Toss-up / Even · D 47.7% · R 51.0% · Other 1.4%
- 2008→2024 swing
- -20.6pp toward R · 2008: 17.3pp · 2024: -3.3pp
- All cycles
- 2024: R+3.3 2020: D+0.3 2016: R+1.1 2012: D+11.9 2008: D+17.3
Not yet ingested
- Civics
- —
Market trends
- HPI YoY
- ▼ -93.46%
- Current HPI
- 197.3359
- Rent YoY
- —
- Metro
- —
- State GDP YoY
- ▲ 1.37%
- F500 in state
- 28
Industry mix (Fortune 500 HQ in MI)
| Industry | F500 HQs | Revenue |
|---|---|---|
| Automotive Parts | 3 | $48B |
|
||
| Automotive | 2 | $372B |
|
||
| Chemicals | 1 | $45B |
|
||
| Automotive Retail | 1 | $29B |
|
||
| Healthcare / Medical Devices | 1 | $23B |
|
||
| Automotive Technology | 1 | $20B |
|
||
Price history
+0.0% since first listed2 events — show timeline
- 2026-04-24 Listed $14,900 REALCOMP
- 2026-04-24 Listed $14,900 MiRealSource-MiMLS
Property tax history
-3.0%/yrLatest (2025): $359 · -49.5% YoY. Source: county tax records.
Cash-flow waterfall
monthlySold comps — $/sqft
last 12 mo · ≤1 miLoading sold comps…