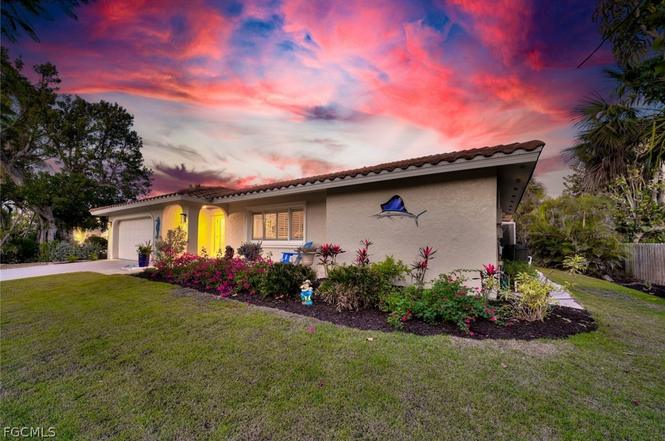
1056 S Yachtsman Dr · Sanibel, FL
Flood risk 9/10 · Severe
- FEMA flood zone
- AE
- Chance of flooding over 30 yrs
- 0.99%
- Est. flood insurance / yr
- $1,737 – $8,500
Fire risk 1/10 · Minimal
- Est. fire insurance / yr
- $947 – $1,759
Heat risk 10/10 · Severe
- Hot days now (above 113°F)
- 7 days/yr
- Hot days in 30 yrs
- 26 days/yr
Wind risk 10/10 · Severe
- Chance of severe wind over 30 yrs
- 99.0%
Air-quality risk 2/10 · Minimal
- Unhealthy air days now
- 1 days/yr
- Unhealthy air days in 30 yrs
- 1 days/yr
Risk factors via First Street. Map © Google.
Why this score? — see what drove the B+ grade
The composite is a weighted blend of 9 inputs, each scored 0–100. Each bar is that input's sub-score; the figure is the points it added to the 100-point composite (weight × sub-score).
- Cash flow +30.0/30.0
- ARV discount +12.5/15.0
- 1% rule +10.0/10.0
- DSCR +10.0/10.0
- Schools +4.1/10.0
- Livability +3.4/5.0
- Rent growth +2.5/5.0
- Condition / age +2.5/5.0
- Appreciation +0.0/10.0
$1,150,000
🖨 Deal sheet 📄 Offer letter ✓ Due diligence
Listing remarks MLS
Sanibel Island's desirable East End, ground level, canal home in Sanibel Estates. Enjoy entertaining in the welcoming living room. Create special meals in the remodeled kitchen boasting custom cabinetry, Silestone counters and stainless steel appliances. Dine with views of the sparkling pool, lush landscaping and canal. Adjourn then to your family room where you can relax from a day at the beach fishing, shelling or kayaking. The two-car garage is floored with travertine and under air. This home is perfectly situated for easy on/off the island and is only a short distance to breakfast, lunch, shopping and a homemade ice cream shoppe. Enjoy the historic lighthouse and fishing pier nearby. This would make a wonderful island home, private retreat or investment property.
Key facts
- Scenic nature trails
- Landscaped yard
- Screened-in pool
Tags
Property features AI
Finance
- Other: Pets allowed
- HOA & community: Homeowners association (annual fee $50); Community boat facilities
Exterior
- Parking: Attached garage with 2 covered spaces
- Security: Security/high-impact doors; Smoke detectors
- Utilities: Public water; Public sewer; Cable available; Municipal irrigation
- Home design: Single-story; Resale property; Entry at ground level; Faces west; Has a view; Waterfront with canal access; Lot with irregular shape and east exposure
- Construction: Block, concrete and stucco construction; Tile roof
- Exterior features: Deck; Fence; Screen-enclosed pool area; Private in-ground pool; Security/high-impact doors; Smoke detectors
Interior
- Kitchen: Dishwasher; Range; Refrigerator; Freezer; Disposal
- Flooring: Carpet; Tile
- Bathrooms: 2 full bathrooms
- Heating & cooling: Central heating (electric); Central air conditioning (electric); Ceiling fans
- Interior features: Impact glass windows; Tray ceilings; Living/dining room; Separate shower (shower only); Split bedroom floor plan
- Laundry & utility: Washer; Dryer
Neighborhood map
What this means for you Summary
Snapshot
- This is a 3-bed/2.0-bath single-family listed at $1.15M.
Deal economics
- At list price, monthly cash flow is $7k ($80k/yr) — positive.
- The deal already cash-flows at list — no discount required.
- Meets the 1% rule at list price ($18k rent vs $1.15M).
- Recommended offer: $1.05M (9.0% below list) — sets the bar for market timing.
- Cap rate 13.7% vs local median 3.8% in Sanibel — top-decile yield for the area; either an underpriced asset or a hidden risk that comps aren't pricing in. Stress-test before assuming the spread holds.
Location & tenants
- Location reads 67/100 on livability (#541 in FL) — a middle-class / working-renter tenant base. Strengths: schools A+, crime A+, employment A+; Watch: housing D+, amenities F, commute F.
- Lee (suburban): math 47% / reading 50% proficiency, ranked #42 of 73 in FL (top 58%) — families likely to look elsewhere, expect single-tenant / working-renter base with shorter leases.
- Market conditions: 526 active listings in the ZIP; 1 comparable units currently listed for rent nearby; 15,411 units permitted in Lee County in 2024 (4,686 in 5+ unit buildings).
Forward outlook
- Local home prices are declining (-3.0%/yr); year-one equity from $8k of loan paydown is wiped out by about $34k of value loss. Plan a longer hold.
- Lee County population projected at +44% by 2050 — long-run rental-demand tailwind backs the buy-and-hold thesis.
- At projected returns (-3.0% appreciation + 3.0% rent growth), your $322k cash investment doubles in ~5 years — after that, you're playing with house money.
Negotiation context
- It's been on market 110 days — a 9% lower offer ($1.05M) is reasonable based on typical stale-listing flexibility.
- 4 sale attempts since 8y ago with the ask held roughly flat each time — persistent listings suggest the price (not the market) is what's stuck; bring a comps-based counter.
- Current owner paid $840k; 37% above their basis — modest negotiation headroom, anchor on the comps not their cost.
Risks & watch-outs
- Watch-outs: flood insurance adds $427/mo.
- Climate carrying-cost: in FEMA flood zone AE (mandatory federal flood insurance); severe wind risk, 99% chance of damaging wind over 30y; extreme-heat days projected 7→26/yr by 2055 (HVAC capex compounding) — expect insurance premiums to compound above CPI over the hold.
Questions for the listing agent
- It's been on market 110 days. Have you received any prior offers? Is the seller open to a 9% concession, seller financing, or rate buy-down credit?
- Built in 1977 — when were the roof, HVAC, electrical panel, plumbing, and water heater last replaced?
- What's the actual annual flood-insurance premium (NFIP or private), and is the property in a SFHA with mandatory coverage?
- What does the HOA fee cover, when was the last increase, and are there any pending special assessments or reserve-fund shortfalls?
- Why hasn't it sold? Are there any deal-killer items the seller is aware of (foundation, flood, title, zoning, code violations)?
- Is there a deadline driving the sale (1031 exchange, divorce, estate, relocation)? That informs how much negotiation room exists.
- Schools are A-rated — typically a magnet for longer-tenancy family renters. What's the average tenant stay here, and is there a school-zone premium baked into asking?
- What's the average days-on-market for RENTAL listings here right now (not sales)? A rising rental-DOM trend means longer vacancies and softer asking-rent achievability than the comps imply.
- What's the recent tenant-quality profile in this submarket — average credit score on applications, eviction rate, late-payment / NSF rate, and stable-employment percentage? A property-management company in the area should have these aggregated.
- How much new for-sale + rental construction is in the pipeline within 1–3 miles? Heavy new supply typically softens prices + rents 12–24 months out; constrained supply supports both.
Investment metrics
- 1% rule
- 1.58% ✓
- Cap rate
- 13.68%
- Cash-on-cash
- 26.39%
- DSCR
- 2.17
- GRM
- 5.3
CMA / ARV
- ARV (on-the-fly)
- $1,295,140
- Comps found
- 1
Show comp detail 1 sale within ~0.75 mi
| Address | Dist | Beds/Ba | Sqft | Sold | Price | $/sf | Match |
|---|---|---|---|---|---|---|---|
| 1154 Harbor Cottage Ct | 0.42mi | 3/2.0 | 1,493 (-11%) | 16mo | $1,150,000 | $770 | 49 |
Match score weights: distance 35% · size 25% · config 20% · recency 20%. Top-matched comps best support the ARV.
Projected returns pro-forma
-3.0% appreciation · 3.0% rent growth · sell at horizon
- IRR
- 18.2%
- Equity multiple
- 1.74×
- Total profit
- $237,643
- Equity at exit
- $171,469
- IRR
- 26.6%
- Equity multiple
- 3.34×
- Total profit
- $753,272
- Equity at exit
- $99,431
Cash invested: $322,000 (down + closing). Projections, not guarantees.
Landlord ↔ Tenant lean methodology
- Overall (STATE)
- 87 Strongly Landlord-Friendly
- State Florida
- 87 Strongly Landlord-Friendly · R+3
- County
- — inherits STATE
- City
- — inherits STATE
ZIP-level market 33957
- Home prices YoY
- -15.7%
- Active inventory
- 526
- Price-to-rent
- 5.3×
Monthly cashflow live
- Estimated rent
- $18,200 medium interval (Pro) →
- Mortgage (P&I)
- −$6,031
- Tax from tax record
- −$783 /mo · $9,392/yr
- Insurance
- −$479
- Flood insurance flood zone
- −$427 /mo · $5,118/yr
- HOA
- −$4
- Vacancy / Maint / Mgmt
- −$3,822
- Net cashflow
- $6,655
Break-even live
UW: 25.0% down · 7.5% · 30yr · 1.5% tax · 5.0% vac · 8.0% maint · 8.0% mgmt
Financing live
Cash to close
- Down payment
- $287,500
- Closing costs
- $34,500
- Reserves months
- —
- Total cash needed
- —
Loan-product check · same deal, 3 products live
Conventional
25% down · 7.5% · 30yr
- Down + closing
- —
- Monthly P&I
- —
- Monthly cashflow
- —
- DSCR
- —
- Eligible?
- —
Personal DTI + credit; lowest rate.
DSCR
20% down · 8.5% · 30yr
- Down + closing
- —
- Monthly P&I
- —
- Monthly cashflow
- —
- DSCR
- —
- Eligible?
- —
No personal income docs; deal must DSCR.
Hard money
10% down · 12.0% · 12mo
- Down + closing
- —
- Monthly P&I
- —
- Monthly cashflow
- —
- DSCR
- —
- Eligible?
- —
Short-term bridge; refi at stabilization.
Rent comps 1 comps
| Address | Beds | Baths | Sqft | Rent | $/sqft | DOM | Units | Dist |
|---|---|---|---|---|---|---|---|---|
| 424 Lagoon Dr Sanibel, FL | 3.0 | 2.0 | 1704 | $18,200 | $10.68 | 24d | 1 | 0.32mi |
HOA detail
- Monthly dues
- $4 · $48/yr
- Likely covers
- landscapingpool
Listing history 23 events
-
2026-06-17days on market $1,150,000 Active 110 DOM
-
2026-06-16days on market $1,150,000 Active 109 DOM
-
2026-06-15days on market $1,150,000 Active 108 DOM
-
2026-06-13days on market $1,150,000 Active 106 DOM
-
2026-06-10days on market $1,150,000 Active 103 DOM
-
2026-06-09days on market $1,150,000 Active 102 DOM
-
2026-06-07days on market $1,150,000 Active 100 DOM
-
2026-06-02days on market $1,150,000 Active 95 DOM
-
2026-06-01days on market $1,150,000 Active 94 DOM
-
2026-06-01days on market $1,150,000 Active 93 DOM
-
2026-02-26$1,150,000 Active
-
2025-07-26historical
-
2025-02-04$1,199,000 Active
-
2020-07-10soldstatus $840,000
-
2020-07-08soldstatus $840,000 Closed 777-char remark
Show marketing remark (777 chars)
Sanibel Island's desirable East End, ground level, canal home in Sanibel Estates. Enjoy entertaining in the welcoming living room. Create special meals in the remodeled kitchen boasting custom cabinetry, Silestone counters and stainless steel appliances. Dine with views of the sparkling pool, lush landscaping and canal. Adjourn then to your family room where you can relax from a day at the beach fishing, shelling or kayaking. The two-car garage is floored with travertine and under air. This home is perfectly situated for easy on/off the island and is only a short distance to breakfast, lunch, shopping and a homemade ice cream shoppe. Enjoy the historic lighthouse and fishing pier nearby. This would make a wonderful island home, private retreat or investment property.
-
2020-03-02status Pending 777-char remark
Show marketing remark (777 chars)
Sanibel Island's desirable East End, ground level, canal home in Sanibel Estates. Enjoy entertaining in the welcoming living room. Create special meals in the remodeled kitchen boasting custom cabinetry, Silestone counters and stainless steel appliances. Dine with views of the sparkling pool, lush landscaping and canal. Adjourn then to your family room where you can relax from a day at the beach fishing, shelling or kayaking. The two-car garage is floored with travertine and under air. This home is perfectly situated for easy on/off the island and is only a short distance to breakfast, lunch, shopping and a homemade ice cream shoppe. Enjoy the historic lighthouse and fishing pier nearby. This would make a wonderful island home, private retreat or investment property.
-
2019-12-01$879,000 Active 777-char remark
Show marketing remark (777 chars)
Sanibel Island's desirable East End, ground level, canal home in Sanibel Estates. Enjoy entertaining in the welcoming living room. Create special meals in the remodeled kitchen boasting custom cabinetry, Silestone counters and stainless steel appliances. Dine with views of the sparkling pool, lush landscaping and canal. Adjourn then to your family room where you can relax from a day at the beach fishing, shelling or kayaking. The two-car garage is floored with travertine and under air. This home is perfectly situated for easy on/off the island and is only a short distance to breakfast, lunch, shopping and a homemade ice cream shoppe. Enjoy the historic lighthouse and fishing pier nearby. This would make a wonderful island home, private retreat or investment property.
-
2019-05-31historical
-
2019-04-24price $875,000
-
2019-02-18price $879,000
-
2018-11-15$899,000 Active
-
2001-01-23soldstatus $477,000
-
1994-12-02soldstatus $250,000
ⓘ Source: listings_history table (triggers on properties + properties_extension) + one-shot
backfill from property_details.listing_events for pre-trigger history.
Tax reassessment forecast FL · Resets to sale price
- Current annual tax
- $9,392 · $783/mo
- Projected year-2 tax
- $9,545 · $795/mo
- Expected delta
- +$153/yr (+$13/mo · 1.6%)
ⓘ Screening estimate from a state-policy table — verify with the county assessor before closing.
Climate risk First Street
- Flood 9/10 Extreme FEMA zone AE · 99% chance over 30 yrs
- Wildfire 1/10 Low
- Heat 10/10 Extreme 7 d/yr ≥113°F today · 26 d/yr by 30 yrs out
- Wind 10/10 Extreme 99% chance of damaging wind over 30 yrs
- Air quality 2/10 Low 1 unhealthy d/yr today · 1 by 30 yrs out
Nearby sold comps map
Loading sold comps map…
Walkable amenities ~0.75 mi
Loading nearby amenities…
Taxation est. · year 1
- Rental income
- $218,400
- − Mortgage interest
- −$64,418
- − Property taxes
- −$9,392
- − Insurance
- −$10,868
- − Repairs & maintenance
- −$17,472
- − Management
- −$17,472
- − HOA
- −$48
- − Depreciation
- −$33,455
- Taxable income
- $65,275
- Est. tax owed @ 24.0%
- −$15,666
- After-tax cash flow
- $64,193/yr
For passive investors: Depreciation is non-cash, so a rental often shows a tax loss while cash-flowing — sheltering income. Rental losses are passive: they offset passive income freely, and up to $25,000/yr can offset ordinary (W-2) income if you actively participate and your MAGI is under $100k (phasing out to $0 by $150k); unused losses carry forward. On sale, claimed depreciation is recaptured at up to 25%, and gains may owe capital-gains tax (a 1031 exchange can defer both). Figures are a year-1 estimate at your 24.0% rate — not tax advice; consult a CPA.
Schools (NCES district)
- District
- Lee
- NCES district ID
- 1201080
- Math proficiency
- 47% ▼ -11.00%
- Reading proficiency
- 50% ▼ -4.00%
- Median HH income
- $49,518
- Composite
- 41.49/100
- National rank
- #3458
- State rank
- #42 of 73 in FL
Livability — Sanibel
- Score
- 67/100
- State rank
- #541
- US rank
- #10166
Category grades
Schools grade is shown separately in the Schools card above.
Census & demographics
- Census place
- Sanibel, FL
- City population
- 6,402
- Population (ZIP)
- 6,402
Population outlook (Lee County) Hauer SSP2
- Today (2025)
- 871,946 people
- By 2030
- 955,468 · +9.6%
- By 2040
- 1,113,587 · +27.7%
- By 2050
- 1,256,891 · +44.1%
- By 2075
- 1,560,270 · +78.9%
- By 2100
- 1,726,848 · +98.0%
Race, ethnicity, and origin ACS 2023
- Neighborhood character
- Predominantly White (95%)
- Race & ethnicity
- White 95% Two or more races 2% Asian 1%
- Common ancestry
- Italian 4% Romanian 4% Slovak 2%
- Foreign-born
- 5% · Canada, China
- Languages at home
- 96% English-only · German/W. Germanic 1% Spanish 1% French/Haitian/Cajun 1%
Political lean MEDSL · Lee
- 2024 margin
- Strong R (+28.4) · D 35.5% · R 63.9%
- 2008→2024 swing
- -18.0pp toward R · 2008: -10.4pp · 2024: -28.4pp
- All cycles
- 2024: R+28.4 2020: R+19.2 2016: R+20.4 2012: R+16.6 2008: R+10.4
Not yet ingested
- Civics
- —
Market trends
- HPI YoY
- ▼ -93.08%
- Current HPI
- 501.0
- Rent YoY
- —
- Metro
- —
- State GDP YoY
- ▲ 3.28%
- F500 in state
- 36
Industry mix (Fortune 500 HQ in FL)
| Industry | F500 HQs | Revenue |
|---|---|---|
| Industrial Technology | 2 | $29B |
|
||
| Insurance | 2 | $17B |
|
||
| Retail | 1 | $60B |
|
||
| Technology Distribution | 1 | $58B |
|
||
| Homebuilding | 1 | $35B |
|
||
| Technology Manufacturing | 1 | $35B |
|
||
Price history
+360.0% since first listed13 events — show timeline
- 2026-02-26 Listed $1,150,000 FORTMLS
- 2025-07-26 Listing Removed — FORTMLS
- 2025-02-04 Listed $1,199,000 FORTMLS
- 2020-07-10 Sold (Public Records) $840,000 Public Records
- 2020-07-08 Sold (MLS) $840,000 FORTMLS
- 2020-03-02 Pending — FORTMLS
- 2019-12-01 Listed $879,000 FORTMLS
- 2019-05-31 Listing Removed — FORTMLS
- 2019-04-24 Price Changed $875,000 FORTMLS
- 2019-02-18 Price Changed $879,000 FORTMLS
- 2018-11-15 Listed $899,000 FORTMLS
- 2001-01-23 Sold (Public Records) $477,000 Public Records
- 1994-12-02 Sold (Public Records) $250,000 Public Records
Property tax history
+3.4%/yrLatest (2025): $9,392 · +4.6% YoY. Source: county tax records.
Cash-flow waterfall
monthlySold comps — $/sqft
last 12 mo · ≤1 miLoading sold comps…