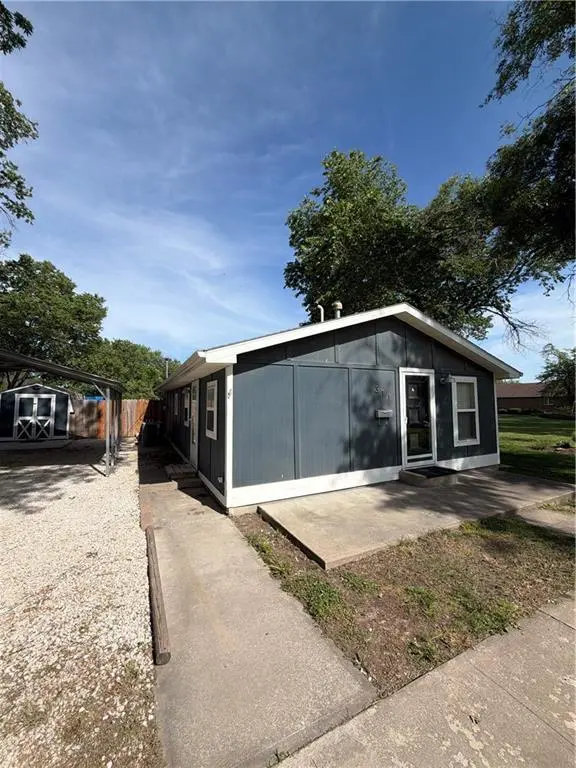
311 13th St · Humboldt, KS
Flood risk 1/10 · Minimal
- FEMA flood zone
- X (unshaded)
- Chance of flooding over 30 yrs
- 0.0%
- Est. flood insurance / yr
- $507 – $1,088
Fire risk 3/10 · Minor
- Est. fire insurance / yr
- $1,154 – $2,142
Heat risk 5/10 · Moderate
- Hot days now (above 108°F)
- 7 days/yr
- Hot days in 30 yrs
- 19 days/yr
Wind risk 2/10 · Minimal
- Chance of severe wind over 30 yrs
- 1.0%
Air-quality risk 2/10 · Minimal
- Unhealthy air days now
- 1 days/yr
- Unhealthy air days in 30 yrs
- 1 days/yr
Risk factors via First Street. Map © Google.
Why this score? — see what drove the C grade
The composite is a weighted blend of 9 inputs, each scored 0–100. Each bar is that input's sub-score; the figure is the points it added to the 100-point composite (weight × sub-score).
- Cash flow +19.9/30.0
- ARV discount +7.7/15.0
- Appreciation +7.2/10.0
- DSCR +6.3/10.0
- 1% rule +5.3/10.0
- Livability +3.6/5.0
- Rent growth +2.5/5.0
- Condition / age +2.5/5.0
- Schools +2.0/10.0
$85,000
🖨 Deal sheet 📄 Offer letter ✓ Due diligence
Key facts
- Shed
- Car port
- Concrete patio
Tags
Property features AI
Finance
- Other: Living area reported as 960 (above-grade); Directions: From Bridge St eastbound through Humboldt turn south on 13th St. Go 2½ blocks south; the house is on the east side of the road.
- HOA & community: No association fees; No community maintenance provided
Exterior
- Parking: Carport
- Utilities: Public water; Public sewer
- Home design: Single-family residence; Residential property
- Construction: Board and batten siding; Composition roof; Concrete slab foundation; Home age: 51–75 years
- Exterior features: Lot approximately 59 x 100 feet; Not in a flood plain
Interior
- Bedrooms: 3 bedrooms
- Bathrooms: 1 full bathroom
- Heating & cooling: Natural gas heating; Electric cooling
- Interior features: Bungalow-style floor plan; Concrete slab basement
Neighborhood map
What this means for you Summary
Snapshot
- This is a 2-bed/1.0-bath single-family listed at $85k.
Deal economics
- At list price, monthly cash flow is $102 ($1k/yr) — positive.
- The deal already cash-flows at list — no discount required.
- Meets the 1% rule at list price ($873 rent vs $85k).
Location & tenants
- Location reads 72/100 on livability (#112 in KS) — a middle-class / working-renter tenant base. Strengths: cost of living A+, housing A+, health & safety A+; Watch: employment D, schools D-, amenities F.
- Humboldt (rural): math 18% / reading 29% proficiency, ranked #148 of 169 in KS (top 88%) — low school quality limits family demand, transient renter base, plan for 1-2y turnover.
- Market conditions: 11 active listings in the ZIP; 18 units permitted in Allen County in 2024 (0 in 5+ unit buildings).
Forward outlook
- In year one you build about $4k of equity ($588 loan paydown + $4k appreciation (4.5% local appreciation)).
- Allen County population projected at -21% by 2050 — secular population decline; favor cash flow + early exit over multi-decade hold.
- At projected returns (4.5% appreciation + 3.0% rent growth), your $24k cash investment doubles in ~4 years — after that, you're playing with house money.
- By year 8, paydown + projected appreciation supports a ~$33k cash-out refi (75% LTV) — recoverable capital for the next deal without selling this one.
Negotiation context
- Only 10 days on market — expect competitive offers; lowballing is unlikely to land.
- 2 sale attempts with the ask held roughly flat each time — persistent listings suggest the price (not the market) is what's stuck; bring a comps-based counter.
Risks & watch-outs
- Climate carrying-cost: extreme-heat days projected 7→19/yr by 2055 (HVAC capex compounding) — expect insurance premiums to compound above CPI over the hold.
Questions for the listing agent
- Built in 1962 — when were the roof, HVAC, electrical panel, plumbing, and water heater last replaced?
- Is there a deadline driving the sale (1031 exchange, divorce, estate, relocation)? That informs how much negotiation room exists.
- Schools are D-rated, which usually means shorter tenancies and higher turnover. Who's the typical renter profile here, and what's been the actual vacancy rate?
- What's the average days-on-market for RENTAL listings here right now (not sales)? A rising rental-DOM trend means longer vacancies and softer asking-rent achievability than the comps imply.
- What's the recent tenant-quality profile in this submarket — average credit score on applications, eviction rate, late-payment / NSF rate, and stable-employment percentage? A property-management company in the area should have these aggregated.
- How much new for-sale + rental construction is in the pipeline within 1–3 miles? Heavy new supply typically softens prices + rents 12–24 months out; constrained supply supports both.
Investment metrics
- 1% rule
- 1.03% ✓
- Cap rate
- 7.74%
- Cash-on-cash
- 5.16%
- DSCR
- 1.23
- GRM
- 8.1
CMA / ARV
- ARV (on-the-fly)
- $85,440
- Comps found
- 5
Show comp detail 5 sales within ~0.75 mi
| Address | Dist | Beds/Ba | Sqft | Sold | Price | $/sf | Match |
|---|---|---|---|---|---|---|---|
| 311 13th St | 0.00mi | 3/1.0 (+1) | 960 (0%) | 1mo | $85,000 | $89 | 94 |
| 412 N 9th St | 0.50mi | 2/1.0 | 884 (-8%) | 5mo | $70,000 | $79 | 60 |
| 1218 Central St | 0.32mi | 2/1.0 | 1,084 (+13%) | 23mo | $19,000 | $18 | 45 |
| 407 Central N/A | 0.68mi | 3/1.0 (+1) | 864 (-10%) | 15mo | $105,500 | $122 | 34 |
| 820 N 11th St | 0.64mi | 3/2.0 (+1) | 1,078 (+12%) | 22mo | $139,000 | $129 | 23 |
Match score weights: distance 35% · size 25% · config 20% · recency 20%. Top-matched comps best support the ARV.
Projected returns pro-forma
4.48% appreciation · 3.0% rent growth · sell at horizon
- IRR
- 16.0%
- Equity multiple
- 1.99×
- Total profit
- $23,605
- Equity at exit
- $45,494
- IRR
- 16.7%
- Equity multiple
- 3.82×
- Total profit
- $67,030
- Equity at exit
- $76,389
Cash invested: $23,800 (down + closing). Projections, not guarantees.
Landlord ↔ Tenant lean methodology
- Overall (STATE)
- 83 Strongly Landlord-Friendly
- State Kansas
- 83 Strongly Landlord-Friendly · R+10
- County
- — inherits STATE
- City
- — inherits STATE
ZIP-level market 66748
- Home prices YoY
- 2.5%
- Active inventory
- 11
- Price-to-rent
- 8.1×
Monthly cashflow live
- Estimated rent
- $873 medium interval (Pro) →
- Mortgage (P&I)
- −$446
- Tax est. 1.5%
- −$106 /mo · $1,275/yr
- Insurance
- −$35
- HOA
- −$0
- Vacancy / Maint / Mgmt
- −$183
- Net cashflow
- $102
Break-even live
UW: 25.0% down · 7.5% · 30yr · 1.5% tax · 5.0% vac · 8.0% maint · 8.0% mgmt
Financing live
Cash to close
- Down payment
- $21,250
- Closing costs
- $2,550
- Reserves months
- —
- Total cash needed
- —
Loan-product check · same deal, 3 products live
Conventional
25% down · 7.5% · 30yr
- Down + closing
- —
- Monthly P&I
- —
- Monthly cashflow
- —
- DSCR
- —
- Eligible?
- —
Personal DTI + credit; lowest rate.
DSCR
20% down · 8.5% · 30yr
- Down + closing
- —
- Monthly P&I
- —
- Monthly cashflow
- —
- DSCR
- —
- Eligible?
- —
No personal income docs; deal must DSCR.
Hard money
10% down · 12.0% · 12mo
- Down + closing
- —
- Monthly P&I
- —
- Monthly cashflow
- —
- DSCR
- —
- Eligible?
- —
Short-term bridge; refi at stabilization.
Listing history 7 events
-
2026-05-14status Pending
-
2026-05-04$85,000 Active
-
2025-01-22historical $850
-
2025-01-12price $850
-
2025-01-04$750
-
2022-07-25soldstatus
-
2020-11-23soldstatus
ⓘ Source: listings_history table (triggers on properties + properties_extension) + one-shot
backfill from property_details.listing_events for pre-trigger history.
Climate risk First Street
- Flood 1/10 Low FEMA zone X (unshaded) · 0% chance over 30 yrs
- Wildfire 3/10 Moderate
- Heat 5/10 Major 7 d/yr ≥108°F today · 19 d/yr by 30 yrs out
- Wind 2/10 Low 100% chance of damaging wind over 30 yrs
- Air quality 2/10 Low 1 unhealthy d/yr today · 1 by 30 yrs out
Nearby sold comps map
Loading sold comps map…
Walkable amenities ~0.75 mi
Loading nearby amenities…
Taxation est. · year 1
- Rental income
- $10,476
- − Mortgage interest
- −$4,761
- − Property taxes
- −$1,275
- − Insurance
- −$425
- − Repairs & maintenance
- −$838
- − Management
- −$838
- − Depreciation
- −$2,473
- Taxable loss
- −$134
- Est. tax savings @ 24.0%
- +$32
- After-tax cash flow
- $1,260/yr
For passive investors: Depreciation is non-cash, so a rental often shows a tax loss while cash-flowing — sheltering income. Rental losses are passive: they offset passive income freely, and up to $25,000/yr can offset ordinary (W-2) income if you actively participate and your MAGI is under $100k (phasing out to $0 by $150k); unused losses carry forward. On sale, claimed depreciation is recaptured at up to 25%, and gains may owe capital-gains tax (a 1031 exchange can defer both). Figures are a year-1 estimate at your 24.0% rate — not tax advice; consult a CPA.
Schools (NCES district)
- District
- Humboldt
- NCES district ID
- 2007590
- Math proficiency
- 18% ▼ -6.00%
- Reading proficiency
- 29% ▼ -11.00%
- Median HH income
- $43,599
- Composite
- 20.16/100
- National rank
- #8634
- State rank
- #148 of 169 in KS
Livability — Humboldt
- Score
- 72/100
- State rank
- #112
- US rank
- #6241
Category grades
Schools grade is shown separately in the Schools card above.
Census & demographics
- Census place
- Humboldt, KS
- Population (ZIP)
- 2,864
Population outlook (Allen County) Hauer SSP2
- Today (2025)
- 11,885 people
- By 2030
- 11,352 · -4.5%
- By 2040
- 10,285 · -13.5%
- By 2050
- 9,342 · -21.4%
- By 2075
- 7,482 · -37.0%
- By 2100
- 5,871 · -50.6%
Race, ethnicity, and origin ACS 2023
- Neighborhood character
- Predominantly White (92%)
- Race & ethnicity
- White 92% Hispanic / Latino 4% Two or more races 2% Asian 2% Pacific Islander 1%
- Common ancestry
- Italian 4% Slovak 2% Serbian 2%
- Foreign-born
- 1% · China, Canada
- Languages at home
- 97% English-only · Chinese 2%
Political lean MEDSL · Allen
- 2024 margin
- Solid R (+46.1) · D 25.8% · R 72.0% · Other 2.2%
- 2008→2024 swing
- -22.9pp toward R · 2008: -23.3pp · 2024: -46.1pp
- All cycles
- 2024: R+46.1 2020: R+44.4 2016: R+41.0 2012: R+27.2 2008: R+23.3
Not yet ingested
- Civics
- —
Market trends
- HPI YoY
- ▲ 4.48%
- Current HPI
- 180.3616
- Rent YoY
- —
- Metro
- —
- State GDP YoY
- —
- F500 in state
- 0
Price history
7 events — show timeline
- 2026-05-14 Pending — Heartland MLS as Distributed by MLS Grid
- 2026-05-04 Listed $85,000 Heartland MLS as Distributed by MLS Grid
- 2025-01-22 Rental Removed $850 TURBOTENANT
- 2025-01-12 Price Changed $850 TURBOTENANT
- 2025-01-04 Listed for Rent $750 TURBOTENANT
- 2022-07-25 Sold (Public Records) — Public Records
- 2020-11-23 Sold (Public Records) — Public Records
Cash-flow waterfall
monthlySold comps — $/sqft
last 12 mo · ≤1 miLoading sold comps…