9140 Lamborn St · Spring Hill, FL
Flood risk 1/10 · Minimal
- FEMA flood zone
- X (unshaded)
- Chance of flooding over 30 yrs
- 0.0%
- Est. flood insurance / yr
- $507 – $1,088
Fire risk 5/10 · Moderate
- Est. fire insurance / yr
- $947 – $1,759
Heat risk 10/10 · Severe
- Hot days now (above 110°F)
- 7 days/yr
- Hot days in 30 yrs
- 25 days/yr
Wind risk 10/10 · Severe
- Chance of severe wind over 30 yrs
- 99.0%
Air-quality risk 3/10 · Minor
- Unhealthy air days now
- 1 days/yr
- Unhealthy air days in 30 yrs
- 4 days/yr
Risk factors via First Street. Map © Google.
Why this score? — see what drove the D+ grade
The composite is a weighted blend of 9 inputs, each scored 0–100. Each bar is that input's sub-score; the figure is the points it added to the 100-point composite (weight × sub-score).
- ARV discount +15.0/15.0
- Cash flow +14.6/30.0
- DSCR +4.4/10.0
- Schools +4.2/10.0
- Livability +3.2/5.0
- 1% rule +3.0/10.0
- Condition / age +2.5/5.0
- Rent growth +2.3/5.0
- Appreciation +0.0/10.0
$310,000
🖨 Deal sheet (PDF) 📄 Offer letter ✓ Due diligence
Listing remarks
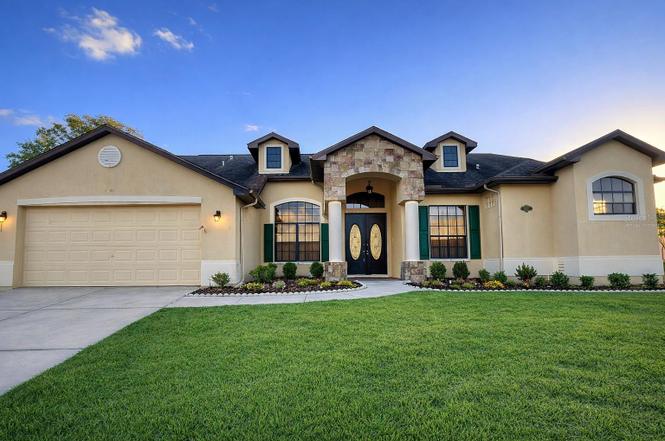
One or more photo(s) has been virtually staged. Motivated Seller: Welcome to this impressive 3-bedroom home in the heart of Spring Hill, featuring a grand entrance with elegant Roman-style columns that create timeless curb appeal and a striking first impression. The foyer welcomes you with additional Roman-style columns that add architectural character and sophistication, while the formal dining room is beautifully accented with matching Roman-style columns, creating an elegant space perfect for hosting gatherings. Inside, you’ll find a spacious 19x18 living room ideal for entertaining, a dedicated office, and a separate casual dining area for everyday meals. The well-appointed kitche
Key facts
- Grand entrance
- Formal dining room
- Casual dining area
Tags
Property features AI
Finance
- Other: Lot approx. 0.25 acre (dimensions ~95 x 109); Zoned residential (RES)
- Financial info: No lease restrictions reported
- HOA & community: No HOA association indicated
Exterior
- Parking: Attached 2-car garage (25 x 20) with garage door opener
- Utilities: Public water; Septic tank sewer; Cable available; Electricity connected; Water connected
- Home design: Single family residence; One-story; Northeast facing; Homestead status
- Construction: Block and stucco construction; Shingle roof; Slab foundation; Built area recorded (living area ~2,143; building area total ~3,130)
- Exterior features: Rear screened porch; French doors; Asphalt road access
Interior
- Kitchen: Dishwasher; Disposal; Microwave; Range; Refrigerator; Electric water heater
- Bedrooms: 3 bedrooms
- Flooring: Carpet; Ceramic tile; Parquet; Solid surface counters (kitchen surfaces)
- Bathrooms: 2 full bathrooms
- Heating & cooling: Central heating; Electric heating; Heat pump; Central air conditioning
- Interior features: Ceiling fans; Eat-in kitchen; High ceilings; Solid surface counters; Solid wood cabinets; Split bedroom floorplan; Thermostat; Walk-in closets; Skylights
- Laundry & utility: Washer hookup; Electric dryer hookup; Laundry area inside with corridor access
Neighborhood map
What this means for you Summary
Snapshot
- This is a 3-bed/2.0-bath single-family listed at $310k.
Deal economics
- At list price, monthly cash flow is $72 ($858/yr) — positive.
- The deal already cash-flows at list — no discount required.
- To meet the 1% rule (rent ≥ 1% of price), the offer needs to be $248k (20.0% below list).
- Recommended offer: $248k (20.0% below list) — sets the bar for 1% rule.
- Cap rate 6.6% vs local median 4.4% in Spring Hill — top-decile yield for the area; either an underpriced asset or a hidden risk that comps aren't pricing in. Stress-test before assuming the spread holds.
Location & tenants
- Location reads 63/100 on livability (#738 in FL) — a middle-class / working-renter tenant base. Strengths: cost of living A+, housing A+; Watch: health & safety C-, employment D+, amenities F.
- Hernando (suburban): math 50% / reading 50% proficiency, ranked #38 of 73 in FL (top 52%) — acceptable for families but not a draw, mixed tenant base, ~2y average lease.
- Zoned schools: Spring Hill Elementary School (math 50% / reading 51%, grade D+, #1,055 of 2,144 statewide, top 50%, 893 students, 68% FRL); Fox Chapel Middle School (math 39% / reading 44%, grade F, #348 of 571 statewide, top 62%, 862 students, 69% FRL); Central High School (math 34% / reading 44%, grade F, #312 of 667 statewide, top 48%, 1,426 students, 53% FRL).
- Market conditions: Rents soft (-0.9%/yr); 392 active listings in the ZIP; 12 comparable units currently listed for rent nearby; rentals leasing fast (median 7d on market — plan ~1-2 weeks tenant-placement turnaround); 2,505 units permitted in Hernando County in 2024 (318 in 5+ unit buildings).
- At $2,481/mo this rent would consume 52% of the median local household income ($57k/yr) (locally 733% of renters already pay >50% of income on rent) — very limited rent-growth headroom before tenants either downsize or default.
Forward outlook
- Local home prices are declining (-3.0%/yr); year-one equity from $2k of loan paydown is wiped out by about $9k of value loss. Plan a longer hold.
- Hernando County population projected at +11% by 2050 — modest demand growth; plan on rents tracking national, not racing it.
Negotiation context
- It's been on market 107 days — a 9% lower offer ($282k) is reasonable based on typical stale-listing flexibility.
- 2 sale attempts since 26y ago; this cycle's ask has dropped $40k (11%) from the opening price — seller is motivated, your offer sets the floor, not the list.
- Current owner paid $10k; list at $310k implies a 2852% gain — meaningful room to come down on a strong offer.
Risks & watch-outs
- Climate carrying-cost: severe wind risk, 99% chance of damaging wind over 30y; moderate wildfire risk; extreme-heat days projected 7→25/yr by 2055 (HVAC capex compounding) — expect insurance premiums to compound above CPI over the hold.
Questions for the listing agent
- It's been on market 107 days. Have you received any prior offers? Is the seller open to a 20% concession, seller financing, or rate buy-down credit?
- Why hasn't it sold? Are there any deal-killer items the seller is aware of (foundation, flood, title, zoning, code violations)?
- Is there a deadline driving the sale (1031 exchange, divorce, estate, relocation)? That informs how much negotiation room exists.
- The area grade is low — what's the realistic commute time and amenity access for the typical tenant pool here? Any planned neighborhood developments (good or bad) we should know about?
- What's the average days-on-market for RENTAL listings here right now (not sales)? A rising rental-DOM trend means longer vacancies and softer asking-rent achievability than the comps imply.
- What's the recent tenant-quality profile in this submarket — average credit score on applications, eviction rate, late-payment / NSF rate, and stable-employment percentage? A property-management company in the area should have these aggregated.
- How much new for-sale + rental construction is in the pipeline within 1–3 miles? Heavy new supply typically softens prices + rents 12–24 months out; constrained supply supports both.
Investment metrics
- 1% rule
- 0.80% ✗
- Cap rate
- 6.57%
- Cash-on-cash
- 0.99%
- DSCR
- 1.04
- GRM
- 10.4
CMA / ARV
- ARV (on-the-fly)
- $372,882
- Comps found
- 12
Show comp detail 12 sales within ~0.75 mi
| Address | Dist | Beds/Ba | Sqft | Sold | Price | $/sf | Match |
|---|---|---|---|---|---|---|---|
| 5294 Elkin Ave | 0.34mi | 3/2.0 | 1,940 (-10%) | 7mo | $330,000 | $170 | 63 |
| 5248 Frost Rd | 0.42mi | 3/2.0 | 1,922 (-10%) | 3mo | $334,000 | $174 | 60 |
| 4335 Duval St | 0.65mi | 3/2.0 | 2,091 (-2%) | 6mo | $312,000 | $149 | 60 |
| 4365 Cadbury Rd | 0.70mi | 4/2.0 (+1) | 2,134 (-0%) | 3mo | $336,990 | $158 | 59 |
| 9251 Manchester St | 0.28mi | 4/2.0 (+1) | 1,828 (-15%) | 4mo | $341,990 | $187 | 54 |
| 9269 Manchester St | 0.30mi | 4/2.0 (+1) | 1,828 (-15%) | 4mo | $349,070 | $191 | 53 |
| 8209 Chaucer Dr | 0.74mi | 3/2.0 | 1,944 (-9%) | 4mo | $240,000 | $123 | 47 |
| 8508 Belmont | 0.74mi | 3/2.0 | 1,974 (-8%) | 8mo | $301,000 | $152 | 46 |
| 5140 Kirkwood Ave | 0.68mi | 3/2.0 | 1,896 (-12%) | 6mo | $335,000 | $177 | 44 |
| 8480 Colma St | 0.71mi | 3/2.0 | 1,838 (-14%) | 1mo | $390,000 | $212 | 43 |
| 9489 Northcliffe Blvd | 0.71mi | 3/2.0 | 1,879 (-12%) | 7mo | $300,000 | $160 | 41 |
| 4393 Cadbury Rd | 0.65mi | 4/2.0 (+1) | 1,830 (-15%) | 2mo | $335,000 | $183 | 39 |
Match score weights: distance 35% · size 25% · config 20% · recency 20%. Top-matched comps best support the ARV.
Projected returns pro-forma
-3.0% appreciation · 0.0% rent growth · sell at horizon
- IRR
- -17.8%
- Equity multiple
- 0.39×
- Total profit
- $-53,067
- Equity at exit
- $46,222
- IRR
- -16.1%
- Equity multiple
- 0.21×
- Total profit
- $-68,921
- Equity at exit
- $26,803
Cash invested: $86,800 (down + closing). Projections, not guarantees.
Landlord ↔ Tenant lean methodology
- Overall (STATE)
- 87 Strongly Landlord-Friendly
- State Florida
- 87 Strongly Landlord-Friendly · R+3
- County
- — inherits STATE
- City
- — inherits STATE
ZIP-level market 34606
- Home prices YoY
- -24.7%
- Rents YoY
- -0.9%
- Active inventory
- 392
- Price-to-rent
- 10.4×
Monthly cashflow live
- Estimated rent
- $2,481 high interval (Pro) →
- Mortgage (P&I)
- −$1,626
- Tax from tax record
- −$133 /mo · $1,600/yr
- Insurance
- −$129
- HOA
- −$0
- Vacancy / Maint / Mgmt
- −$521
- Net cashflow
- $72
Break-even live
Sensitivity live
| Price | -10% $247 | -5% $159 | +0% $72 | +5% $-16 | +10% $-104 |
|---|---|---|---|---|---|
| Rent | -10% $-124 | -5% $-26 | +0% $72 | +5% $170 | +10% $267 |
| Rate | -1.0pp $228 | -0.5pp $150 | base $72 | +0.5pp $-9 | +1.0pp $-91 |
UW: 25.0% down · 7.5% · 30yr · 1.5% tax · 5.0% vac · 8.0% maint · 8.0% mgmt
Financing live
Cash to close
- Down payment
- $77,500
- Closing costs
- $9,300
- Reserves months
- —
- Total cash needed
- —
Loan-product check · same deal, 3 products live
Conventional
25% down · 7.5% · 30yr
- Down + closing
- —
- Monthly P&I
- —
- Monthly cashflow
- —
- DSCR
- —
- Eligible?
- —
Personal DTI + credit; lowest rate.
DSCR
20% down · 8.5% · 30yr
- Down + closing
- —
- Monthly P&I
- —
- Monthly cashflow
- —
- DSCR
- —
- Eligible?
- —
No personal income docs; deal must DSCR.
Hard money
10% down · 12.0% · 12mo
- Down + closing
- —
- Monthly P&I
- —
- Monthly cashflow
- —
- DSCR
- —
- Eligible?
- —
Short-term bridge; refi at stabilization.
Rent comps 12 comps
| Address | Beds | Baths | Sqft | Rent | $/sqft | DOM | Units | Dist |
|---|---|---|---|---|---|---|---|---|
| 9211 Northcliffe Blvd Spring Hill, FL | 3.0 | 2.0 | 1641 | $3,200 | $1.95 | 5d | 1 | 0.18mi |
| 9131 Swiss Rd Spring Hill, FL | 3.0 | 2.0 | 1673 | $2,000 | $1.20 | 26d | 1 | 0.36mi |
| 9341 Northcliffe Blvd Spring Hill, FL | 3.0 | 2.0 | 1444 | $1,800 | $1.25 | 1d | 1 | 0.40mi |
| 5256 Frost Rd Spring Hill, FL | 3.0 | 2.0 | 1950 | $2,950 | $1.51 | 26d | 1 | 0.41mi |
| 4628 Bayridge Ct Spring Hill, FL | 3.0 | 2.0 | 1756 | $1,995 | $1.14 | 6d | 1 | 0.57mi |
| 5100 Lydia Ct Spring Hill, FL | 3.0 | 2.0 | 1826 | $1,925 | $1.05 | 26d | 1 | 0.77mi |
| 5413 Deltona Blvd Spring Hill, FL | 3.0 | 3.5 | 2487 | $3,500 | $1.41 | 5d | 1 | 0.79mi |
| 8316 Nevada St Spring Hill, FL | 2.0 | 1.0 | 1722 | $2,100 | $1.22 | 26d | 1 | 0.89mi |
| 10117 Elgin Blvd Spring Hill, FL | 4.0 | 2.0 | 1400 | $1,995 | $1.43 | 6d | 1 | 1.13mi |
| 3933 Antigua Way Spring Hill, FL | 3.0–5.0 | 2.0–3.0 | 1975 | $2,109 | $1.07 | 6d | 1 | 1.30mi |
| 7337 Cone Shell Dr Spring Hill, FL | 3.0 | 3.0 | 1750 | $1,895 | $1.08 | 1d | 1 | 1.39mi |
| 6288 Swan Ln Spring Hill, FL | 4.0 | 2.0 | 2091 | $2,450 | $1.17 | 26d | 1 | 1.41mi |
Listing history 19 events
-
2026-06-21days on market $310,000 Active 107 DOM
-
2026-06-18days on market $310,000 Active 104 DOM
-
2026-06-17days on market $310,000 Active 103 DOM
-
2026-06-16days on market $310,000 Active 102 DOM
-
2026-06-15days on market $310,000 Active 101 DOM
-
2026-06-13days on market $310,000 Active 99 DOM
-
2026-06-13days on market $310,000 Active 98 DOM
-
2026-06-09days on market $310,000 Active 95 DOM
-
2026-06-08days on market $310,000 Active 94 DOM
-
2026-06-07days on market $310,000 Active 93 DOM
-
2026-06-04days on market $310,000 Active 90 DOM
-
2026-06-03days on market $310,000 Active 89 DOM
-
2026-06-02pricedays on market $310,000 Active 88 DOM
-
2026-06-01days on market $335,000 Active 87 DOM
-
2026-05-31days on market $335,000 Active 86 DOM
-
2026-04-16price $335,000
-
2026-03-06$350,000 Active
-
2002-08-26soldstatus $10,500
-
2000-01-10$11,500
ⓘ Source: listings_history table (triggers on properties + properties_extension) + one-shot
backfill from property_details.listing_events for pre-trigger history.
Tax reassessment forecast FL · Resets to sale price
- Current annual tax
- $1,600 · $133/mo
- Projected year-2 tax
- $2,573 · $214/mo
- Expected delta
- +$973/yr (+$81/mo · 60.8%)
ⓘ Screening estimate from a state-policy table — verify with the county assessor before closing.
Climate risk First Street
- Flood 1/10 Low FEMA zone X (unshaded) · 0% chance over 30 yrs
- Wildfire 5/10 Major
- Heat 10/10 Extreme 7 d/yr ≥110°F today · 25 d/yr by 30 yrs out
- Wind 10/10 Extreme 99% chance of damaging wind over 30 yrs
- Air quality 3/10 Moderate 1 unhealthy d/yr today · 4 by 30 yrs out
Nearby sold comps map
Loading sold comps map…
Walkable amenities ~0.75 mi
Loading nearby amenities…
Taxation est. · year 1
- Rental income
- $29,767
- − Mortgage interest
- −$17,365
- − Property taxes
- −$1,600
- − Insurance
- −$1,550
- − Repairs & maintenance
- −$2,381
- − Management
- −$2,381
- − Depreciation
- −$9,018
- Taxable loss
- −$4,528
- Est. tax savings @ 24.0%
- +$1,087
- After-tax cash flow
- $1,945/yr
For passive investors: Depreciation is non-cash, so a rental often shows a tax loss while cash-flowing — sheltering income. Rental losses are passive: they offset passive income freely, and up to $25,000/yr can offset ordinary (W-2) income if you actively participate and your MAGI is under $100k (phasing out to $0 by $150k); unused losses carry forward. On sale, claimed depreciation is recaptured at up to 25%, and gains may owe capital-gains tax (a 1031 exchange can defer both). Figures are a year-1 estimate at your 24.0% rate — not tax advice; consult a CPA.
Schools (NCES district)
- District
- Hernando
- NCES district ID
- 1200810
- Math proficiency
- 50% ▼ -8.00%
- Reading proficiency
- 50% ▼ -4.00%
- Median HH income
- $41,985
- Composite
- 42.03/100
- National rank
- #3329
- State rank
- #38 of 73 in FL
Livability — Spring Hill
- Score
- 63/100
- State rank
- #738
- US rank
- #15937
Category grades
Schools grade is shown separately in the Schools card above.
Census & demographics
- Census place
- Spring Hill, FL
- County
- Hernando County · 169,677 people
- City population
- 83,915
- Metro
- Tampa-St. Petersburg-Clearwater, FL
- Population (ZIP)
- 28,668
- Household income
- $57,337
- Rent vs Own
- Severe rent burden
- 733.0
Population outlook (Hernando County) Hauer SSP2
- Today (2025)
- 189,218 people
- By 2030
- 194,367 · +2.7%
- By 2040
- 203,398 · +7.5%
- By 2050
- 209,589 · +10.8%
- By 2075
- 218,452 · +15.4%
- By 2100
- 205,923 · +8.8%
Race, ethnicity, and origin ACS 2023
- Neighborhood character
- Predominantly White (74%)
- Race & ethnicity
- White 74% Hispanic / Latino 16% Two or more races 13% Black 4%
- Hispanic origin (detail)
- Mexican 1% Puerto Rican 10% Cuban 2%
- Common ancestry
- Romanian 4% Lithuanian 3% Slovak 2%
- Foreign-born
- 8% · Canada, Jamaica
- Languages at home
- 87% English-only · Spanish 11% German/W. Germanic 1%
Political lean MEDSL · Hernando
- 2024 margin
- Solid R (+37.0) · D 31.1% · R 68.2%
- 2008→2024 swing
- -33.5pp toward R · 2008: -3.6pp · 2024: -37.0pp
- All cycles
- 2024: R+37.0 2020: R+30.2 2016: R+29.0 2012: R+8.5 2008: R+3.6
Not yet ingested
- Civics
- —
Market trends
- HPI YoY
- ▼ -98.11%
- Current HPI
- 298.5201
- Rent YoY
- ▼ -0.89%
- Metro
- Tampa-St. Petersburg-Clearwater, FL
- State GDP YoY
- ▲ 3.28%
- F500 in state
- 36
Industry mix (Fortune 500 HQ in FL)
| Industry | F500 HQs | Revenue |
|---|---|---|
| Industrial Technology | 2 | $29B |
|
||
| Insurance | 2 | $17B |
|
||
| Retail | 1 | $60B |
|
||
| Technology Distribution | 1 | $58B |
|
||
| Homebuilding | 1 | $35B |
|
||
| Technology Manufacturing | 1 | $35B |
|
||
Price history
+2813.0% since first listed4 events — show timeline
- 2026-04-16 Price Changed $335,000 Stellar MLS as Distributed by MLS Grid
- 2026-03-06 Listed $350,000 Stellar MLS as Distributed by MLS Grid
- 2002-08-26 Sold (MLS) $10,500 HCAR
- 2000-01-10 Listed $11,500 HCAR
Property tax history
+5.1%/yrLatest (2025): $1,600 · +2.8% YoY. Source: county tax records.
Cash-flow waterfall
monthlySold comps — $/sqft
last 12 mo · ≤1 miLoading sold comps…