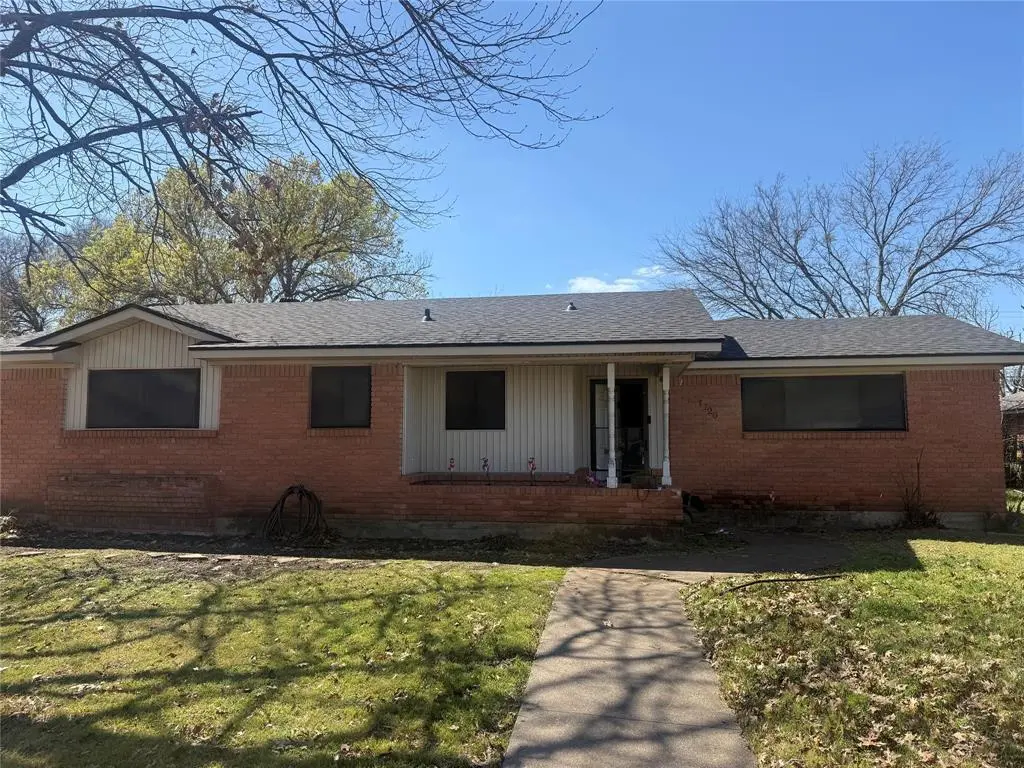
1720 Moutainview Dr · Waco, TX
Flood risk 1/10 · Minimal
- FEMA flood zone
- X (unshaded)
- Chance of flooding over 30 yrs
- 0.0%
- Est. flood insurance / yr
- $507 – $1,088
Fire risk 3/10 · Minor
- Est. fire insurance / yr
- $1,222 – $2,270
Heat risk 7/10 · Major
- Hot days now (above 108°F)
- 7 days/yr
- Hot days in 30 yrs
- 24 days/yr
Wind risk 6/10 · Moderate
- Chance of severe wind over 30 yrs
- 53.0%
Air-quality risk 2/10 · Minimal
- Unhealthy air days now
- 0 days/yr
- Unhealthy air days in 30 yrs
- 1 days/yr
Risk factors via First Street. Map © Google.
Why this score? — see what drove the C- grade
The composite is a weighted blend of 9 inputs, each scored 0–100. Each bar is that input's sub-score; the figure is the points it added to the 100-point composite (weight × sub-score).
- Cash flow +15.9/30.0
- ARV discount +15.0/15.0
- 1% rule +6.6/10.0
- DSCR +4.9/10.0
- Livability +3.7/5.0
- Rent growth +3.1/5.0
- Condition / age +2.5/5.0
- Schools +1.8/10.0
- Appreciation +0.0/10.0
$160,000
🖨 Deal sheet 📄 Offer letter ✓ Due diligence
Listing remarks
Welcome to this charming 3-bedroom, 2-bath home nestled in the heart of desirable West Waco. This inviting property offers a spacious and functional layout, perfect for both everyday living and entertaining. Step inside to find a bright and comfortable living area that flows seamlessly into the kitchen and dining space. The home features three well-sized bedrooms and two full bathrooms, providing plenty of room for family, guests, or a home office setup. One of the standout features of this property is the two bonus rooms—ideal for a game room, media space, home gym, or additional workspace. The possibilities are endless to fit your lifestyle needs. Outside, you’ll love the larg
Key facts
- Bonus rooms
- Large backyard
- 0.28 acre lot
Tags
Property features AI
Finance
- Other: County: McLennan; Country: United States; Directions: GPS
- Financial info: Accepting cash and conventional offers; Treat as clear loan type; No second mortgage
- HOA & community: No homeowners association
Exterior
- Parking: Covered carport with 4 spaces; Additional parking available
- Utilities: City water; City sewer; Not in a municipal utility district
- Home design: Single-family residence; Attached property; Built in 1961
- Construction: Built in 1961
- Exterior features: Lot under 0.5 acre (approximately 0.28 acre); Subdivision: Ridgedale
Interior
- Kitchen: Built-in gas range; Microwave; Refrigerator
- Bedrooms: 3 bedrooms (all on the main level); Primary bedroom on the main level
- Bathrooms: 2 full bathrooms
- Interior features: One-level layout; Two living areas; One dining area; Total of 8 rooms; Other interior features
Neighborhood map
What this means for you Summary
Snapshot
- This is a 3-bed/2.0-bath single-family listed at $160k.
Deal economics
- At list price, monthly cash flow is $77 ($928/yr) — positive.
- The deal already cash-flows at list — no discount required.
- Meets the 1% rule at list price ($2k rent vs $160k).
- Cap rate 6.9% vs local median 3.9% in Waco — top-decile yield for the area; either an underpriced asset or a hidden risk that comps aren't pricing in. Stress-test before assuming the spread holds.
Location & tenants
- Location reads 74/100 on livability (#166 in TX, #4,378 nationally) — a middle-class / working-renter tenant base. Strengths: cost of living A+, housing A+, health & safety A+; Watch: crime D, commute F, employment D-.
- Waco ISD (urban): math 20% / reading 24% proficiency, ranked #773 of 826 in TX (top 94%) — low school quality limits family demand, transient renter base, plan for 1-2y turnover; 81% free/reduced lunch — lower-income household profile, screen leases tightly.
- Zoned schools: South Waco El (math 8% / reading 22%, grade F, #4,021 of 4,322 statewide, top 94%, 462 students, 96% FRL).
- Market conditions: Rents rising (+2.4%/yr); 186 active listings in the ZIP; 13 comparable units currently listed for rent nearby; rentals at typical pace (median 21d on market — plan ~3-4 weeks tenant-placement turnaround); 1,014 units permitted in McLennan County in 2024 (200 in 5+ unit buildings).
- This rent runs 38% of the median local income ($58k/yr) — at the standard rent-burdened threshold; future hikes will face affordability resistance.
Forward outlook
- Local home prices are declining (-3.0%/yr); year-one equity from $1k of loan paydown is wiped out by about $5k of value loss. Plan a longer hold.
- McLennan County population projected at +17% by 2050 — long-run rental-demand tailwind backs the buy-and-hold thesis.
Negotiation context
- Only 2 days on market — expect competitive offers; lowballing is unlikely to land.
- 3 sale attempts with the ask held roughly flat each time — persistent listings suggest the price (not the market) is what's stuck; bring a comps-based counter.
Risks & watch-outs
- Watch-outs: property tax is 3.6% of price.
- Climate carrying-cost: major wind risk, 53% chance of damaging wind over 30y; extreme-heat days projected 7→24/yr by 2055 (HVAC capex compounding) — expect insurance premiums to compound above CPI over the hold.
Questions for the listing agent
- Built in 1961 — when were the roof, HVAC, electrical panel, plumbing, and water heater last replaced?
- Property tax is high relative to price — has the assessment been appealed recently, and will the sale trigger a re-assessment?
- Is there a deadline driving the sale (1031 exchange, divorce, estate, relocation)? That informs how much negotiation room exists.
- Schools are D-rated, which usually means shorter tenancies and higher turnover. Who's the typical renter profile here, and what's been the actual vacancy rate?
- Crime grade is D in this area — have there been break-ins, vandalism, or insurance claims at this property in the last 3 years? What carrier currently insures it and at what premium?
- What's the average days-on-market for RENTAL listings here right now (not sales)? A rising rental-DOM trend means longer vacancies and softer asking-rent achievability than the comps imply.
- What's the recent tenant-quality profile in this submarket — average credit score on applications, eviction rate, late-payment / NSF rate, and stable-employment percentage? A property-management company in the area should have these aggregated.
- How much new for-sale + rental construction is in the pipeline within 1–3 miles? Heavy new supply typically softens prices + rents 12–24 months out; constrained supply supports both.
Investment metrics
- 1% rule
- 1.16% ✓
- Cap rate
- 6.87%
- Cash-on-cash
- 2.07%
- DSCR
- 1.09
- GRM
- 7.2
CMA / ARV
- ARV (median comp)
- $227,926
- List price
- $160,000
- Delta
- -29.80%
- Verdict
- UNDERPRICED
- Comps
- 20 within 1.0 mi
Show comp detail 12 sales within ~0.75 mi
| Address | Dist | Beds/Ba | Sqft | Sold | Price | $/sf | Match |
|---|---|---|---|---|---|---|---|
| 1720 Moutainview Dr | 0.00mi | 3/2.0 | 1,926 (0%) | 0mo | $160,000 | $83 | 100 |
| 5727 Lakemont Cir | 0.27mi | 3/2.0 | 1,927 (+0%) | 5mo | $294,900 | $153 | 83 |
| 2309 Skyline Dr | 0.62mi | 3/2.0 | 1,902 (-1%) | 4mo | $325,000 | $171 | 66 |
| 2225 Hermanson Dr | 0.49mi | 3/2.5 | 2,006 (+4%) | 3mo | $399,900 | $199 | 65 |
| 2025 Lenamon St | 0.35mi | 3/2.0 | 1,672 (-13%) | 0mo | $285,000 | $170 | 62 |
| 1700 Rambler Dr | 0.48mi | 3/2.0 | 1,753 (-9%) | 2mo | $265,000 | $151 | 61 |
| 5301 Lake Crest St | 0.50mi | 3/2.0 | 2,065 (+7%) | 6mo | $339,000 | $164 | 59 |
| 2306 Oak Cliff Dr | 0.57mi | 3/2.0 | 1,773 (-8%) | 1mo | $315,000 | $178 | 59 |
| 5113 Lake Arrowhead Dr | 0.65mi | 3/2.0 | 2,021 (+5%) | 3mo | $335,000 | $166 | 59 |
| 2212 Charboneau St | 0.55mi | 3/2.0 | 1,742 (-10%) | 2mo | $284,900 | $164 | 57 |
| 6904 Viking Dr | 0.59mi | 4/2.5 (+1) | 2,038 (+6%) | 3mo | $338,000 | $166 | 53 |
| 2208 Lake Ridge Cir | 0.59mi | 3/2.0 | 2,199 (+14%) | 1mo | $334,500 | $152 | 48 |
Match score weights: distance 35% · size 25% · config 20% · recency 20%. Top-matched comps best support the ARV.
Projected returns pro-forma
-3.0% appreciation · 2.41% rent growth · sell at horizon
- IRR
- -13.7%
- Equity multiple
- 0.51×
- Total profit
- $-21,897
- Equity at exit
- $23,857
- IRR
- -5.8%
- Equity multiple
- 0.64×
- Total profit
- $-16,348
- Equity at exit
- $13,834
Cash invested: $44,800 (down + closing). Projections, not guarantees.
Landlord ↔ Tenant lean methodology
- Overall (STATE)
- 87 Strongly Landlord-Friendly
- State Texas
- 87 Strongly Landlord-Friendly · R+5
- County
- — inherits STATE
- City
- — inherits STATE
ZIP-level market 76710
- Rents YoY
- 2.4%
- Active inventory
- 186
- Price-to-rent
- 7.2×
Monthly cashflow live
- Estimated rent
- $1,851 high interval (Pro) →
- Mortgage (P&I)
- −$839
- Tax from tax record
- −$480 /mo · $5,756/yr
- Insurance
- −$67
- HOA
- −$0
- Vacancy / Maint / Mgmt
- −$389
- Net cashflow
- $77
Break-even live
UW: 25.0% down · 7.5% · 30yr · 1.5% tax · 5.0% vac · 8.0% maint · 8.0% mgmt
Financing live
Cash to close
- Down payment
- $40,000
- Closing costs
- $4,800
- Reserves months
- —
- Total cash needed
- —
Loan-product check · same deal, 3 products live
Conventional
25% down · 7.5% · 30yr
- Down + closing
- —
- Monthly P&I
- —
- Monthly cashflow
- —
- DSCR
- —
- Eligible?
- —
Personal DTI + credit; lowest rate.
DSCR
20% down · 8.5% · 30yr
- Down + closing
- —
- Monthly P&I
- —
- Monthly cashflow
- —
- DSCR
- —
- Eligible?
- —
No personal income docs; deal must DSCR.
Hard money
10% down · 12.0% · 12mo
- Down + closing
- —
- Monthly P&I
- —
- Monthly cashflow
- —
- DSCR
- —
- Eligible?
- —
Short-term bridge; refi at stabilization.
Rent comps 13 comps
| Address | Beds | Baths | Sqft | Rent | $/sqft | DOM | Units | Dist |
|---|---|---|---|---|---|---|---|---|
| 5813 Fairview Dr Waco, TX | 3.0 | 2.0 | 1319 | $1,400 | $1.06 | 43d | 1 | 0.36mi |
| 2137 Lenamon St Waco, TX | 3.0 | 2.0 | 1835 | $2,350 | $1.28 | 13d | 1 | 0.50mi |
| 5025 Loch Lomond Dr Waco, TX | 3.0 | 2.0 | 1611 | $1,850 | $1.15 | 20d | 1 | 0.70mi |
| 6700 Old Briarstown Dr Waco, TX | 2.0 | 2.0 | 1300 | $1,295 | $1.00 | 20d | 1 | 0.81mi |
| 6807 Alford Dr Waco, TX | 3.0 | 2.5 | 1800 | $1,495 | $0.83 | 43d | 1 | 0.85mi |
| 901 Rambler Dr Waco, TX | 3.0 | 2.0 | 1629 | $1,795 | $1.10 | 20d | 1 | 0.90mi |
| 2324 N 50th St Waco, TX | 3.0 | 2.0 | 1875 | $3,300 | $1.76 | 43d | 1 | 0.96mi |
| 549 N 62nd St Waco, TX | 4.0 | 2.0 | 1690 | $1,995 | $1.18 | 43d | 1 | 0.97mi |
| 5714 Wilshire Dr Waco, TX | 3.0 | 2.0 | 1500 | $1,495 | $1.00 | 20d | 1 | 1.23mi |
| 701 Topeka Dr Woodway, TX | 3.0 | 2.0 | 1781 | $2,300 | $1.29 | 13d | 1 | 1.31mi |
| 1125 Wedgewood Dr Woodway, TX | 4.0 | 2.0 | 2246 | $2,195 | $0.98 | 43d | 1 | 1.36mi |
| 2213 N 41st St Waco, TX | 3.0 | 1.5 | 1299 | $1,550 | $1.19 | 13d | 1 | 1.48mi |
| 1113 N New Rd Waco, TX | 3.0 | 2.0 | 1326 | $1,620 | $1.22 | 20d | 1 | 1.49mi |
Listing history 7 events
-
2026-05-08status Pending 972-char remark
-
2026-05-06$160,000 Active 972-char remark
-
2026-05-03status Active
-
2026-03-25status Pending
-
2026-03-21$160,000 Active
-
2010-02-26soldstatus
-
2001-05-22soldstatus
ⓘ Source: listings_history table (triggers on properties + properties_extension) + one-shot
backfill from property_details.listing_events for pre-trigger history.
Tax reassessment forecast TX · Resets to sale price
- Current annual tax
- $5,756 · $480/mo
- Projected year-2 tax
- $5,756 · $480/mo
- Expected delta
- $0/yr ($0/mo · 0.0%)
ⓘ Screening estimate from a state-policy table — verify with the county assessor before closing.
Climate risk First Street
- Flood 1/10 Low FEMA zone X (unshaded) · 0% chance over 30 yrs
- Wildfire 3/10 Moderate
- Heat 7/10 Severe 7 d/yr ≥108°F today · 24 d/yr by 30 yrs out
- Wind 6/10 Major 53% chance of damaging wind over 30 yrs
- Air quality 2/10 Low 0 unhealthy d/yr today · 1 by 30 yrs out
Nearby sold comps map
Loading sold comps map…
Walkable amenities ~0.75 mi
Loading nearby amenities…
Taxation est. · year 1
- Rental income
- $22,218
- − Mortgage interest
- −$8,962
- − Property taxes
- −$5,756
- − Insurance
- −$800
- − Repairs & maintenance
- −$1,777
- − Management
- −$1,777
- − Depreciation
- −$4,655
- Taxable loss
- −$1,510
- Est. tax savings @ 24.0%
- +$362
- After-tax cash flow
- $1,290/yr
For passive investors: Depreciation is non-cash, so a rental often shows a tax loss while cash-flowing — sheltering income. Rental losses are passive: they offset passive income freely, and up to $25,000/yr can offset ordinary (W-2) income if you actively participate and your MAGI is under $100k (phasing out to $0 by $150k); unused losses carry forward. On sale, claimed depreciation is recaptured at up to 25%, and gains may owe capital-gains tax (a 1031 exchange can defer both). Figures are a year-1 estimate at your 24.0% rate — not tax advice; consult a CPA.
Schools (NCES district)
- District
- Waco ISD
- NCES district ID
- 4844280
- Math proficiency
- 20% ▼ -14.00%
- Reading proficiency
- 24% ▼ -6.00%
- Median HH income
- $29,208
- Composite
- 17.57/100
- National rank
- #9043
- State rank
- #773 of 826 in TX
Livability — Waco
- Score
- 74/100
- State rank
- #166
- US rank
- #4378
Category grades
Schools grade is shown separately in the Schools card above.
Census & demographics
- Census place
- Waco, TX
- County
- McLennan County · 213,088 people
- City population
- 125,319
- Metro
- Waco, TX
- Population (ZIP)
- 23,329
- Household income
- $58,186
- Rent vs Own
- Severe rent burden
- 1202.0
Population outlook (McLennan County) Hauer SSP2
- Today (2025)
- 264,191 people
- By 2030
- 273,578 · +3.6%
- By 2040
- 291,506 · +10.3%
- By 2050
- 308,044 · +16.6%
- By 2075
- 349,648 · +32.3%
- By 2100
- 364,779 · +38.1%
Race, ethnicity, and origin ACS 2023
- Neighborhood character
- Diverse neighborhood (Simpson 0.60)
- Race & ethnicity
- White 55% Hispanic / Latino 26% Two or more races 19% Black 15%
- Hispanic origin (detail)
- Mexican 21% Puerto Rican 2%
- Common ancestry
- Slovak 3% Lithuanian 2% Romanian 2%
- Foreign-born
- 5% · Canada, China
- Languages at home
- 84% English-only · Spanish 14% German/W. Germanic 1%
Political lean MEDSL · McLennan
- 2024 margin
- Solid R (+30.9) · D 34.0% · R 64.9% · Other 1.0%
- 2008→2024 swing
- -7.0pp toward R · 2008: -23.9pp · 2024: -30.9pp
- All cycles
- 2024: R+30.9 2020: R+23.4 2016: R+27.1 2012: R+29.8 2008: R+23.9
Not yet ingested
- Civics
- —
Market trends
- HPI YoY
- ▼ -147.65%
- Current HPI
- 227.2988
- Rent YoY
- ▲ 2.41%
- Metro
- Waco, TX
- State GDP YoY
- ▲ 3.95%
- F500 in state
- 110
Industry mix (Fortune 500 HQ in TX)
| Industry | F500 HQs | Revenue |
|---|---|---|
| Energy | 16 | $1,198B |
|
||
| Technology | 5 | $198B |
|
||
| Engineering / Construction | 4 | $72B |
|
||
| Energy Services | 3 | $60B |
|
||
| Utilities | 3 | $41B |
|
||
| Healthcare | 2 | $330B |
|
||
Price history
+0.0% since first listed8 events — show timeline
- 2026-06-09 Sold (MLS) — NTREIS
- 2026-05-08 Pending — NTREIS
- 2026-05-06 Listed $160,000 NTREIS
- 2026-05-03 Relisted — NTREIS
- 2026-03-25 Pending — NTREIS
- 2026-03-21 Listed $160,000 NTREIS
- 2010-02-26 Sold (Public Records) — Public Records
- 2001-05-22 Sold (Public Records) — Public Records
Property tax history
+5.6%/yrLatest (2025): $5,756 · +9.6% YoY. Source: county tax records.
Cash-flow waterfall
monthlySold comps — $/sqft
last 12 mo · ≤1 miLoading sold comps…