1425 Wells Loop · Jasper, AL
Flood risk 1/10 · Minimal
- FEMA flood zone
- X (unshaded)
- Chance of flooding over 30 yrs
- 0.0%
- Est. flood insurance / yr
- $507 – $1,088
Fire risk 5/10 · Moderate
- Est. fire insurance / yr
- $916 – $1,700
Heat risk 5/10 · Moderate
- Hot days now (above 107°F)
- 7 days/yr
- Hot days in 30 yrs
- 19 days/yr
Wind risk 6/10 · Moderate
- Chance of severe wind over 30 yrs
- 27.0%
Air-quality risk 3/10 · Minor
- Unhealthy air days now
- 3 days/yr
- Unhealthy air days in 30 yrs
- 3 days/yr
Risk factors via First Street. Map © Google.
Why this score? — see what drove the C+ grade
The composite is a weighted blend of 9 inputs, each scored 0–100. Each bar is that input's sub-score; the figure is the points it added to the 100-point composite (weight × sub-score).
- Cash flow +27.9/30.0
- DSCR +9.9/10.0
- 1% rule +7.6/10.0
- ARV discount +7.5/15.0
- Livability +3.1/5.0
- Rent growth +2.5/5.0
- Schools +2.2/10.0
- Condition / age +2.2/5.0
- Appreciation +0.0/10.0
$175,000
🖨 Deal sheet (PDF) 📄 Offer letter ✓ Due diligence
Listing remarks
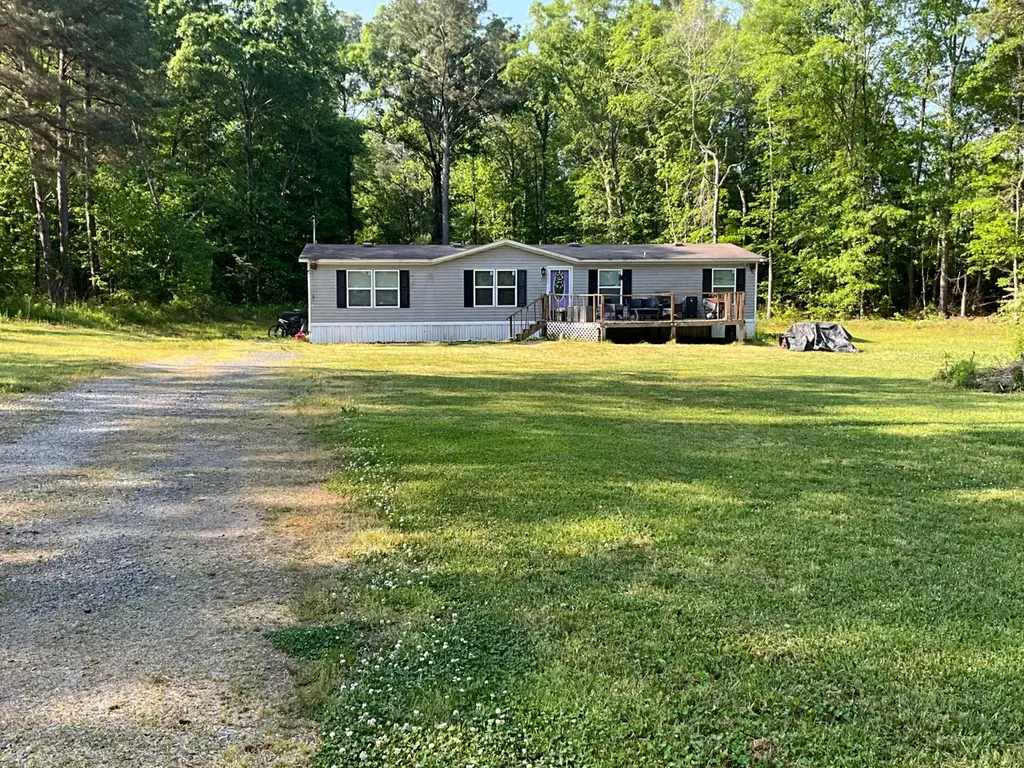
4 Br 2 BA home situated on 2.5 acres, offering plenty of space & potential. This property is perfect for those looking to add their personal touch, as it does need some TLC. With a great layout & a beautiful piece of land, it's an excellent opportunity to create your dream home or investment property.
Key facts
- Listed 56 days
Property features AI
Exterior
- Parking: No designated parking
- Utilities: Septic tank sewer
- Home design: Single-story mobile home; Residential property
- Construction: Mobile home construction
- Exterior features: Metal roof
Interior
- Flooring: Other
- Heating & cooling: Central heating (electric); Central electric cooling
- Interior features: Other flooring
Neighborhood map
What this means for you Summary
Snapshot
- This is a 4-bed/2.0-bath other listed at $175k. Condition is rated fair.
Deal economics
- At list price, monthly cash flow is $538 ($6k/yr) — positive.
- The deal already cash-flows at list — no discount required.
- Meets the 1% rule at list price ($2k rent vs $175k).
- Recommended offer: $170k (3.0% below list) — sets the bar for market timing.
- Cap rate 10.0% vs local median 3.8% in Jasper — top-decile yield for the area; either an underpriced asset or a hidden risk that comps aren't pricing in. Stress-test before assuming the spread holds.
Location & tenants
- Location reads 62/100 on livability (#228 in AL) — a middle-class / working-renter tenant base. Strengths: cost of living A+, housing A+; Watch: employment D+, crime F, amenities F.
- Walker County (rural): math 13% / reading 39% proficiency, ranked #89 of 129 in AL (top 69%) — low school quality limits family demand, transient renter base, plan for 1-2y turnover.
- Market conditions: 109 active listings in the ZIP; 36 units permitted in Walker County in 2024 (0 in 5+ unit buildings).
Forward outlook
- Local home prices are declining (-3.0%/yr); year-one equity from $1k of loan paydown is wiped out by about $5k of value loss. Plan a longer hold.
- Walker County population projected at -21% by 2050 — secular population decline; favor cash flow + early exit over multi-decade hold.
- At projected returns (-3.0% appreciation + 3.0% rent growth), your $49k cash investment doubles in ~9 years — after that, you're playing with house money.
Negotiation context
- It's been on market 56 days — a 3% lower offer ($170k) is reasonable based on typical stale-listing flexibility.
Risks & watch-outs
- Climate carrying-cost: major wind risk, 27% chance of damaging wind over 30y; moderate wildfire risk; extreme-heat days projected 7→19/yr by 2055 (HVAC capex compounding) — expect insurance premiums to compound above CPI over the hold.
Questions for the listing agent
- It's been on market 56 days. Have you received any prior offers? Is the seller open to a 3% concession, seller financing, or rate buy-down credit?
- Have any recent inspections been done? Can we get a copy of the seller's disclosures and any deferred-maintenance estimates?
- Is there a deadline driving the sale (1031 exchange, divorce, estate, relocation)? That informs how much negotiation room exists.
- Schools are D-rated, which usually means shorter tenancies and higher turnover. Who's the typical renter profile here, and what's been the actual vacancy rate?
- Crime grade is F in this area — have there been break-ins, vandalism, or insurance claims at this property in the last 3 years? What carrier currently insures it and at what premium?
- What's the average days-on-market for RENTAL listings here right now (not sales)? A rising rental-DOM trend means longer vacancies and softer asking-rent achievability than the comps imply.
- What's the recent tenant-quality profile in this submarket — average credit score on applications, eviction rate, late-payment / NSF rate, and stable-employment percentage? A property-management company in the area should have these aggregated.
- How much new for-sale + rental construction is in the pipeline within 1–3 miles? Heavy new supply typically softens prices + rents 12–24 months out; constrained supply supports both.
Investment metrics
- 1% rule
- 1.26% ✓
- Cap rate
- 9.98%
- Cash-on-cash
- 13.17%
- DSCR
- 1.59
- GRM
- 6.6
CMA / ARV
- ARV (median comp)
- $40,781
- List price
- $175,000
- Delta
- 329.12%
- Verdict
- OVERPRICED
- Comps
- 1 within 2.0 mi
Projected returns pro-forma
-3.0% appreciation · 3.0% rent growth · sell at horizon
- IRR
- 3.1%
- Equity multiple
- 1.12×
- Total profit
- $5,938
- Equity at exit
- $26,093
- IRR
- 12.7%
- Equity multiple
- 2.01×
- Total profit
- $49,424
- Equity at exit
- $15,131
Cash invested: $49,000 (down + closing). Projections, not guarantees.
Landlord ↔ Tenant lean methodology
- Overall (STATE)
- 90 Strongly Landlord-Friendly
- State Alabama
- 90 Strongly Landlord-Friendly · R+15
- County
- — inherits STATE
- City
- — inherits STATE
ZIP-level market 35503
- Home prices YoY
- -26.8%
- Active inventory
- 109
- Price-to-rent
- 6.6×
Monthly cashflow live
- Estimated rent
- $2,212 medium interval (Pro) →
- Mortgage (P&I)
- −$918
- Tax est. 1.5%
- −$219 /mo · $2,625/yr
- Insurance
- −$73
- HOA
- −$0
- Vacancy / Maint / Mgmt
- −$464
- Net cashflow
- $538
Break-even live
Sensitivity live
| Price | -10% $659 | -5% $598 | +0% $538 | +5% $477 | +10% $417 |
|---|---|---|---|---|---|
| Rent | -10% $363 | -5% $451 | +0% $538 | +5% $625 | +10% $713 |
| Rate | -1.0pp $626 | -0.5pp $582 | base $538 | +0.5pp $493 | +1.0pp $446 |
UW: 25.0% down · 7.5% · 30yr · 1.5% tax · 5.0% vac · 8.0% maint · 8.0% mgmt
Financing live
Cash to close
- Down payment
- $43,750
- Closing costs
- $5,250
- Reserves months
- —
- Total cash needed
- —
Loan-product check · same deal, 3 products live
Conventional
25% down · 7.5% · 30yr
- Down + closing
- —
- Monthly P&I
- —
- Monthly cashflow
- —
- DSCR
- —
- Eligible?
- —
Personal DTI + credit; lowest rate.
DSCR
20% down · 8.5% · 30yr
- Down + closing
- —
- Monthly P&I
- —
- Monthly cashflow
- —
- DSCR
- —
- Eligible?
- —
No personal income docs; deal must DSCR.
Hard money
10% down · 12.0% · 12mo
- Down + closing
- —
- Monthly P&I
- —
- Monthly cashflow
- —
- DSCR
- —
- Eligible?
- —
Short-term bridge; refi at stabilization.
Listing history 17 events
-
2026-06-18days on market $175,000 Active 56 DOM
-
2026-06-17days on market $175,000 Active 55 DOM
-
2026-06-16days on market $175,000 Active 54 DOM
-
2026-06-15price $175,000 Active 53 DOM
-
2026-06-15days on market $185,000 Active 53 DOM
-
2026-06-13days on market $185,000 Active 51 DOM
-
2026-06-13days on market $185,000 Active 50 DOM
-
2026-06-10days on market $185,000 Active 48 DOM
-
2026-06-09days on market $185,000 Active 47 DOM
-
2026-06-08days on market $185,000 Active 46 DOM
-
2026-06-07days on market $185,000 Active 45 DOM
-
2026-06-05days on market $185,000 Active 42 DOM
-
2026-06-03days on market $185,000 Active 41 DOM
-
2026-06-03days on market $185,000 Active 40 DOM
-
2026-06-01days on market $185,000 Active 39 DOM
-
2026-05-31days on market $185,000 Active 38 DOM
-
2026-04-23$185,000 Active 314-char remark
ⓘ Source: listings_history table (triggers on properties + properties_extension) + one-shot
backfill from property_details.listing_events for pre-trigger history.
Climate risk First Street
- Flood 1/10 Low FEMA zone X (unshaded) · 0% chance over 30 yrs
- Wildfire 5/10 Major
- Heat 5/10 Major 7 d/yr ≥107°F today · 19 d/yr by 30 yrs out
- Wind 6/10 Major 27% chance of damaging wind over 30 yrs
- Air quality 3/10 Moderate 3 unhealthy d/yr today · 3 by 30 yrs out
Nearby sold comps map
Loading sold comps map…
Walkable amenities ~0.75 mi
Loading nearby amenities…
Taxation est. · year 1
- Rental income
- $26,542
- − Mortgage interest
- −$9,803
- − Property taxes
- −$2,625
- − Insurance
- −$875
- − Repairs & maintenance
- −$2,123
- − Management
- −$2,123
- − Depreciation
- −$5,091
- Taxable income
- $3,901
- Est. tax owed @ 24.0%
- −$936
- After-tax cash flow
- $5,519/yr
For passive investors: Depreciation is non-cash, so a rental often shows a tax loss while cash-flowing — sheltering income. Rental losses are passive: they offset passive income freely, and up to $25,000/yr can offset ordinary (W-2) income if you actively participate and your MAGI is under $100k (phasing out to $0 by $150k); unused losses carry forward. On sale, claimed depreciation is recaptured at up to 25%, and gains may owe capital-gains tax (a 1031 exchange can defer both). Figures are a year-1 estimate at your 24.0% rate — not tax advice; consult a CPA.
Condition & rehab AI · 12 photos
This property requires moderate renovations, including landscaping, kitchen and bathroom updates, and painting, to improve its condition and marketability.
Repairs flagged
- Major Overgrown lawn — Needs trimming and landscaping
- Major Debris — Needs removal
- Moderate Worn flooring — Needs replacement or refinishing
- Moderate Outdated cabinetry — Needs replacement
- Moderate Outdated fixtures — Needs replacement
- Moderate Worn paint — Needs repainting
Value-add opportunities
- Both Landscaping and curb appeal — Improves property's visual appeal and marketability
- Both Kitchen renovation — Updates the kitchen and increases the home's value
- Both Bathroom renovation — Updates the bathrooms and increases the home's value
- Both Painting — Improves the home's appearance and marketability
Renovation cost estimate screening
| Repair item | Severity | Est. cost |
|---|---|---|
| Overgrown lawn · Needs trimming and landscaping | Major | $15,000–50,000 |
| Debris · Needs removal | Major | $15,000–50,000 |
| Worn flooring · Needs replacement or refinishing | Moderate | $3,000–15,000 |
| Outdated cabinetry · Needs replacement | Moderate | $3,000–15,000 |
| Outdated fixtures · Needs replacement | Moderate | $3,000–15,000 |
| Worn paint · Needs repainting | Moderate | $3,000–15,000 |
| Total estimated repair cost · 6 items | $42,000–160,000 |
Value-add ROI direction
- Both Landscaping and curb appeal — Improves property's visual appeal and marketability ↑
- Both Kitchen renovation — Updates the kitchen and increases the home's value ↑
- Both Bathroom renovation — Updates the bathrooms and increases the home's value ↑
- Both Painting — Improves the home's appearance and marketability ↑
ⓘ Cost ranges are severity-bucket heuristics (US national rule-of-thumb). Get contractor quotes + a written scope before underwriting a rehab budget.
Schools (NCES district)
- District
- Walker County
- NCES district ID
- 0103450
- Math proficiency
- 13% ▼ -28.00%
- Reading proficiency
- 39% ▼ -5.00%
- Median HH income
- $36,664
- Composite
- 21.51/100
- National rank
- #8321
- State rank
- #89 of 129 in AL
Livability — Jasper
- Score
- 62/100
- State rank
- #228
- US rank
- #17152
Category grades
Schools grade is shown separately in the Schools card above.
Census & demographics
- City population
- 9,927
- Population (ZIP)
- 9,601
Population outlook (Walker County) Hauer SSP2
- Today (2025)
- 61,037 people
- By 2030
- 58,391 · -4.3%
- By 2040
- 53,080 · -13.0%
- By 2050
- 48,031 · -21.3%
- By 2075
- 37,799 · -38.1%
- By 2100
- 29,001 · -52.5%
Race, ethnicity, and origin ACS 2023
- Neighborhood character
- Predominantly White (94%)
- Race & ethnicity
- White 94% Two or more races 2% Black 1% Hispanic / Latino 1%
- Common ancestry
- Slovak 2% Iranian 1% Scotch-Irish 1%
- Foreign-born
- 0%
- Languages at home
- 99% English-only · Spanish 1%
Political lean MEDSL · Walker
- 2024 margin
- Solid R (+71.8) · D 13.8% · R 85.6%
- 2008→2024 swing
- -25.4pp toward R · 2008: -46.4pp · 2024: -71.8pp
- All cycles
- 2024: R+71.8 2020: R+67.9 2016: R+67.4 2012: R+52.9 2008: R+46.4
Not yet ingested
- Civics
- —
Market trends
- HPI YoY
- ▼ -63.26%
- Current HPI
- 172.9286
- Rent YoY
- —
- Metro
- —
- State GDP YoY
- ▲ 2.94%
- F500 in state
- 4
Industry mix (Fortune 500 HQ in AL)
| Industry | F500 HQs | Revenue |
|---|---|---|
| Financial Services | 1 | $8B |
|
||
| Healthcare | 1 | $5B |
|
||
Price history
-5.4% since first listed2 events — show timeline
- 2026-06-15 Price Changed $175,000 Walker County Area MLS
- 2026-04-23 Listed $185,000 Walker County Area MLS
Property tax history
+7.8%/yrLatest (2024): $37 · +0.0% YoY. Source: county tax records.
Cash-flow waterfall
monthlySold comps — $/sqft
last 12 mo · ≤1 miLoading sold comps…