8013 Fair Breeze Dr · Severn, MD
Flood risk No data
- FEMA flood zone
- —
- Chance of flooding over 30 yrs
- —
- Est. flood insurance / yr
- —
Fire risk No data
- Est. fire insurance / yr
- —
Heat risk No data
- Hot days now (above threshold)
- —
- Hot days in 30 yrs
- —
Wind risk No data
- Chance of severe wind over 30 yrs
- —
Air-quality risk No data
- Unhealthy air days now
- —
- Unhealthy air days in 30 yrs
- —
Risk factors via First Street. Map © Google.
Why this score? — see what drove the B- grade
The composite is a weighted blend of 9 inputs, each scored 0–100. Each bar is that input's sub-score; the figure is the points it added to the 100-point composite (weight × sub-score).
- Cash flow +30.0/30.0
- 1% rule +10.0/10.0
- DSCR +10.0/10.0
- ARV discount +7.5/15.0
- Livability +3.5/5.0
- Schools +2.9/10.0
- Rent growth +2.3/5.0
- Condition / age +2.2/5.0
- Appreciation +0.0/10.0
$97,900
🖨 Deal sheet 📄 Offer letter ✓ Due diligence
Listing remarks
Nice 3 Bed / 2 Bath Mobile Home. Nice Quite Neighborhood. Off Street Parking / 2 Car Drive Way. Storage Shed.
Key facts
- Off street parking
- Storage shed
- Built 2000
Tags
Property features AI
Exterior
- Home design: Manufactured/mobile home built in 2000; Single-story
- Construction: Built in 2000
- Exterior features: Located in Severn Mobile Home Park
Interior
- Kitchen: Refrigerator included
- Flooring: Carpet
- Interior features: Carpet flooring; Porch
Neighborhood map
What this means for you Summary
Snapshot
- This is a 3-bed/2.0-bath other listed at $98k. Condition is rated fair.
Deal economics
- At list price, monthly cash flow is $1k ($14k/yr) — positive.
- The deal already cash-flows at list — no discount required.
- Meets the 1% rule at list price ($2k rent vs $98k).
- Cap rate 20.4% vs local median 4.0% in Severn — top-decile yield for the area; either an underpriced asset or a hidden risk that comps aren't pricing in. Stress-test before assuming the spread holds.
Location & tenants
- Location reads 70/100 on livability (#175 in MD) — a middle-class / working-renter tenant base. Strengths: employment A+, housing A+, health & safety A-; Watch: schools D+, crime D+, amenities F.
- Anne Arundel County Public Schools (suburban): math 20% / reading 37% proficiency, ranked #10 of 24 in MD (top 42%) — low school quality limits family demand, transient renter base, plan for 1-2y turnover.
- Market conditions: Rents soft (-0.9%/yr); 136 active listings in the ZIP; 11 comparable units currently listed for rent nearby; rentals at typical pace (median 20d on market — plan ~3-4 weeks tenant-placement turnaround); high-income renter base; 1,303 units permitted in Anne Arundel County in 2024 (299 in 5+ unit buildings).
Forward outlook
- Local home prices are declining (-3.0%/yr); year-one equity from $677 of loan paydown is wiped out by about $3k of value loss. Plan a longer hold.
- Anne Arundel County population projected at +17% by 2050 — long-run rental-demand tailwind backs the buy-and-hold thesis.
- At projected returns (-3.0% appreciation + 0.0% rent growth), your $27k cash investment doubles in ~3 years — after that, you're playing with house money.
Negotiation context
- Only 6 days on market — expect competitive offers; lowballing is unlikely to land.
Questions for the listing agent
- Have any recent inspections been done? Can we get a copy of the seller's disclosures and any deferred-maintenance estimates?
- Is there a deadline driving the sale (1031 exchange, divorce, estate, relocation)? That informs how much negotiation room exists.
- Schools are D-rated, which usually means shorter tenancies and higher turnover. Who's the typical renter profile here, and what's been the actual vacancy rate?
- Crime grade is D in this area — have there been break-ins, vandalism, or insurance claims at this property in the last 3 years? What carrier currently insures it and at what premium?
- What's the average days-on-market for RENTAL listings here right now (not sales)? A rising rental-DOM trend means longer vacancies and softer asking-rent achievability than the comps imply.
- What's the recent tenant-quality profile in this submarket — average credit score on applications, eviction rate, late-payment / NSF rate, and stable-employment percentage? A property-management company in the area should have these aggregated.
- How much new for-sale + rental construction is in the pipeline within 1–3 miles? Heavy new supply typically softens prices + rents 12–24 months out; constrained supply supports both.
Investment metrics
- 1% rule
- 2.37% ✓
- Cap rate
- 20.44%
- Cash-on-cash
- 50.54%
- DSCR
- 3.25
- GRM
- 3.5
CMA / ARV
No comps found within radius.
Projected returns pro-forma
-3.0% appreciation · 0.0% rent growth · sell at horizon
- IRR
- 44.9%
- Equity multiple
- 2.86×
- Total profit
- $50,909
- Equity at exit
- $14,597
- IRR
- 49.4%
- Equity multiple
- 5.12×
- Total profit
- $112,904
- Equity at exit
- $8,465
Cash invested: $27,412 (down + closing). Projections, not guarantees.
Landlord ↔ Tenant lean methodology
- Overall (STATE)
- 27 Tenant-Leaning
- State Maryland
- 27 Tenant-Leaning · D+14
- County
- — inherits STATE
- City
- — inherits STATE
ZIP-level market 21144
- Rents YoY
- -0.9%
- Active inventory
- 136
- Price-to-rent
- 3.5×
Monthly cashflow live
- Estimated rent
- $2,318 high interval (Pro) →
- Mortgage (P&I)
- −$513
- Tax est. 1.5%
- −$122 /mo · $1,468/yr
- Insurance
- −$41
- HOA
- −$0
- Vacancy / Maint / Mgmt
- −$487
- Net cashflow
- $1,154
Break-even live
UW: 25.0% down · 7.5% · 30yr · 1.5% tax · 5.0% vac · 8.0% maint · 8.0% mgmt
Financing live
Cash to close
- Down payment
- $24,475
- Closing costs
- $2,937
- Reserves months
- —
- Total cash needed
- —
Loan-product check · same deal, 3 products live
Conventional
25% down · 7.5% · 30yr
- Down + closing
- —
- Monthly P&I
- —
- Monthly cashflow
- —
- DSCR
- —
- Eligible?
- —
Personal DTI + credit; lowest rate.
DSCR
20% down · 8.5% · 30yr
- Down + closing
- —
- Monthly P&I
- —
- Monthly cashflow
- —
- DSCR
- —
- Eligible?
- —
No personal income docs; deal must DSCR.
Hard money
10% down · 12.0% · 12mo
- Down + closing
- —
- Monthly P&I
- —
- Monthly cashflow
- —
- DSCR
- —
- Eligible?
- —
Short-term bridge; refi at stabilization.
Rent comps 11 comps
| Address | Beds | Baths | Sqft | Rent | $/sqft | DOM | Units | Dist |
|---|---|---|---|---|---|---|---|---|
| 7918 Sage Way Severn, MD | 2.0 | 1.0 | 900 | $1,950 | $2.17 | 43d | 1 | 0.85mi |
| 7900 Erin Michele Pkwy Severn, MD | 1.0–3.0 | 1.0–2.0 | 1111 | $3,560 | $3.20 | 2d | 9 | 1.13mi |
| 1807 Arwell Ct Severn, MD | 3.0 | 1.0 | 1068 | $1,900 | $1.78 | 14d | 1 | 1.23mi |
| 1839 Arwell Ct Severn, MD | 3.0 | 1.0 | 1054 | $2,500 | $2.37 | 23d | 1 | 1.27mi |
| 1833 Richfield Dr Severn, MD | 3.0 | 1.0 | 1125 | $1,820 | $1.62 | 1d | 8 | 1.33mi |
| 8317 Severn Orchard Cir Severn, MD | 1.0–3.0 | 1.0 | 897 | $2,035 | $2.27 | 1d | 81 | 1.38mi |
| 8001 Laketowne Ct Severn, MD | 2.0–3.0 | 1.0–1.5 | 1014 | $2,694 | $2.66 | 3d | 18 | 1.40mi |
| 8429 Pioneer Dr Severn, MD | 3.0 | 2.0 | 1068 | $2,150 | $2.01 | 43d | 1 | 1.42mi |
| 8567 Pioneer Dr Severn, MD | 3.0 | 1.0 | 1068 | $2,050 | $1.92 | 43d | 1 | 1.44mi |
| 1811 Battlement Ct Severn, MD | 2.0 | 1.0 | 1200 | $1,600 | $1.33 | 20d | 1 | 1.47mi |
| 8595 Pioneer Dr Severn, MD | 3.0 | 1.0 | 1068 | $1,950 | $1.83 | 43d | 1 | 1.47mi |
Listing history 6 events
-
2026-06-18days on market $97,900 Active 6 DOM
-
2026-06-17days on market $97,900 Active 5 DOM
-
2026-06-16days on market $97,900 Active 4 DOM
-
2026-06-15days on market $97,900 Active 3 DOM
-
2026-06-13remarks 109-char remark
-
2026-06-13$97,900 Active 1 DOM
ⓘ Source: listings_history table (triggers on properties + properties_extension) + one-shot
backfill from property_details.listing_events for pre-trigger history.
Nearby sold comps map
Loading sold comps map…
Walkable amenities ~0.75 mi
Loading nearby amenities…
Taxation est. · year 1
- Rental income
- $27,814
- − Mortgage interest
- −$5,484
- − Property taxes
- −$1,468
- − Insurance
- −$490
- − Repairs & maintenance
- −$2,225
- − Management
- −$2,225
- − Depreciation
- −$2,848
- Taxable income
- $13,074
- Est. tax owed @ 24.0%
- −$3,138
- After-tax cash flow
- $10,716/yr
For passive investors: Depreciation is non-cash, so a rental often shows a tax loss while cash-flowing — sheltering income. Rental losses are passive: they offset passive income freely, and up to $25,000/yr can offset ordinary (W-2) income if you actively participate and your MAGI is under $100k (phasing out to $0 by $150k); unused losses carry forward. On sale, claimed depreciation is recaptured at up to 25%, and gains may owe capital-gains tax (a 1031 exchange can defer both). Figures are a year-1 estimate at your 24.0% rate — not tax advice; consult a CPA.
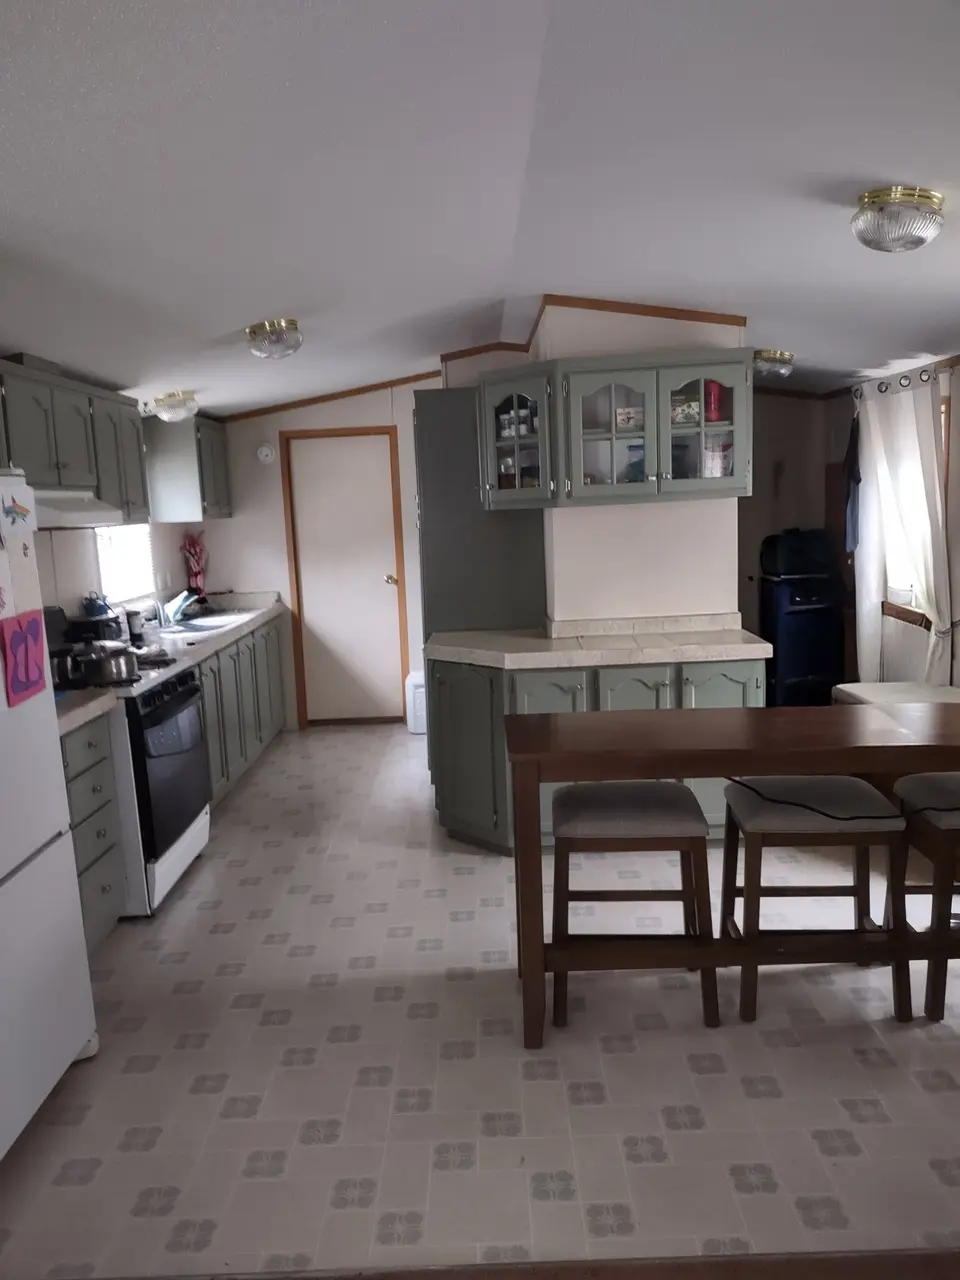
Condition & rehab AI · 1 photo
The home requires moderate updates to kitchen cabinets and painting, with HVAC maintenance needed. Upgrades will improve its resale and rental value.
Repairs flagged
- Minor kitchen cabinets — Dated appearance
- Minor paint — Worn in some areas
Value-add opportunities
- Both Painting and updating kitchen cabinets — Improves appearance and value
- Both Upgrading HVAC system — Enhances comfort and energy efficiency
Renovation cost estimate screening
| Repair item | Severity | Est. cost |
|---|---|---|
| kitchen cabinets · Dated appearance | Minor | $500–3,000 |
| paint · Worn in some areas | Minor | $500–3,000 |
| Total estimated repair cost · 2 items | $1,000–6,000 |
Value-add ROI direction
- Both Painting and updating kitchen cabinets — Improves appearance and value ↑
- Both Upgrading HVAC system — Enhances comfort and energy efficiency ↑
ⓘ Cost ranges are severity-bucket heuristics (US national rule-of-thumb). Get contractor quotes + a written scope before underwriting a rehab budget.
Schools (NCES district)
- District
- Anne Arundel County Public Schools
- NCES district ID
- 2400060
- Math proficiency
- 20% ▼ -21.00%
- Reading proficiency
- 37% ▼ -13.00%
- Median HH income
- $87,880
- Composite
- 28.52/100
- National rank
- #6733
- State rank
- #10 of 24 in MD
Livability — Severn
- Score
- 70/100
- State rank
- #175
- US rank
- #7833
Category grades
Schools grade is shown separately in the Schools card above.
Census & demographics
- Census place
- Severn, MD
- County
- Anne Arundel County · 535,653 people
- City population
- 37,118
- Metro
- Baltimore-Columbia-Towson, MD
- Population (ZIP)
- 37,118
- Household income
- $136,684
- Rent vs Own
- Severe rent burden
- 550.0
Population outlook (Anne Arundel County) Hauer SSP2
- Today (2025)
- 617,384 people
- By 2030
- 642,094 · +4.0%
- By 2040
- 686,621 · +11.2%
- By 2050
- 723,031 · +17.1%
- By 2075
- 809,346 · +31.1%
- By 2100
- 837,658 · +35.7%
Race, ethnicity, and origin ACS 2023
- Neighborhood character
- Diverse neighborhood (Simpson 0.69)
- Race & ethnicity
- White 43% Black 32% Hispanic / Latino 11% Two or more races 10% Asian 7%
- Hispanic origin (detail)
- Puerto Rican 3%
- Common ancestry
- Romanian 2% Lithuanian 2% Italian 1%
- Foreign-born
- 15% · Canada, South Korea, Jamaica
- Languages at home
- 80% English-only · Spanish 7% Other Indo-European 2% French/Haitian/Cajun 1%
Political lean MEDSL · Anne Arundel
- 2024 margin
- D (+13.9) · D 55.7% · R 41.7% · Other 2.6%
- 2008→2024 swing
- +15.7pp toward D · 2008: -1.8pp · 2024: 13.9pp
- All cycles
- 2024: D+13.9 2020: D+14.5 2016: D+0.7 2012: R+0.9 2008: R+1.8
Not yet ingested
- Civics
- —
Market trends
- HPI YoY
- ▼ -275.16%
- Current HPI
- 271.5527
- Rent YoY
- ▼ -0.93%
- Metro
- Baltimore-Columbia-Towson, MD
- State GDP YoY
- ▲ 2.97%
- F500 in state
- 12
Industry mix (Fortune 500 HQ in MD)
| Industry | F500 HQs | Revenue |
|---|---|---|
| Aerospace / Defense | 1 | $71B |
|
||
| Utilities | 1 | $25B |
|
||
| Hotels | 1 | $24B |
|
||
| Consumer Goods | 1 | $7B |
|
||
| Real Estate | 1 | $6B |
|
||
| Chemicals | 1 | $2B |
|
||
Price history
1 event — show timeline
- 2026-06-10 Listed $97,900 FSBO.com
Cash-flow waterfall
monthlySold comps — $/sqft
last 12 mo · ≤1 miLoading sold comps…