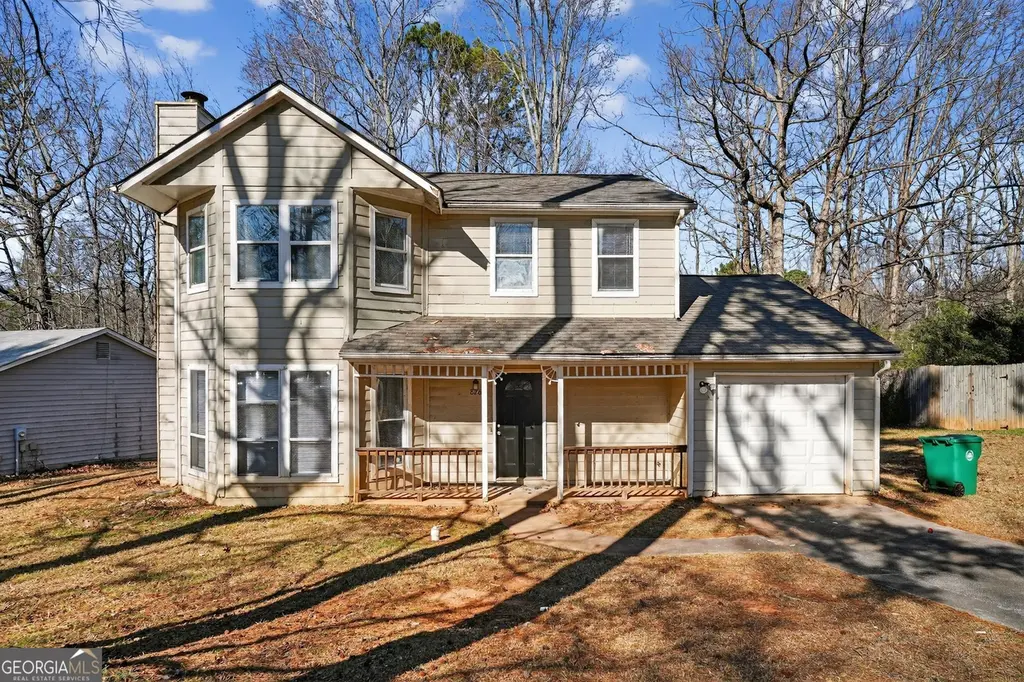
826 Greenhedge Way · Redan, GA
Flood risk 1/10 · Minimal
- FEMA flood zone
- X (unshaded)
- Chance of flooding over 30 yrs
- 0.0%
- Est. flood insurance / yr
- $507 – $1,088
Fire risk 1/10 · Minimal
- Est. fire insurance / yr
- $963 – $1,789
Heat risk 5/10 · Moderate
- Hot days now (above 104°F)
- 7 days/yr
- Hot days in 30 yrs
- 18 days/yr
Wind risk 5/10 · Moderate
- Chance of severe wind over 30 yrs
- 26.0%
Air-quality risk 6/10 · Moderate
- Unhealthy air days now
- 8 days/yr
- Unhealthy air days in 30 yrs
- 11 days/yr
Risk factors via First Street. Map © Google.
Why this score? — see what drove the D grade
The composite is a weighted blend of 9 inputs, each scored 0–100. Each bar is that input's sub-score; the figure is the points it added to the 100-point composite (weight × sub-score).
- Cash flow +12.3/30.0
- ARV discount +10.9/15.0
- 1% rule +3.9/10.0
- DSCR +3.7/10.0
- Rent growth +3.4/5.0
- Livability +3.2/5.0
- Condition / age +2.5/5.0
- Schools +2.1/10.0
- Appreciation +0.0/10.0
$224,900
🖨 Deal sheet (PDF) 📄 Offer letter ✓ Due diligence
Listing remarks MLS
Traditional two-story home offering approximately 1,588 sq ft of living space with 3 bedrooms and 2.5 bathrooms. The interior features a family room with fireplace, separate dining area, eat-in kitchen, and convenient upper-level laundry room. An attached garage and driveway provide private parking, while the level lot of nearly 0.29 acres offers outdoor space for gardening and recreation. Central heating and air conditioning, public water and sewer, and reliable utility access complete this solid residential property in the Greenhedge Way community of Stone Mountain.
Key facts
- Attached garage
- Eat-in kitchen
- Private parking
Tags
Neighborhood map
What this means for you Summary
Snapshot
- This is a 3-bed/2.5-bath single-family listed at $225k.
Deal economics
- At list price, monthly cash flow is $-40 ($-484/yr) — negative.
- To cash-flow at today's rent, offer at most $218k (3.2% below list).
- To meet the 1% rule (rent ≥ 1% of price), the offer needs to be $200k (11.0% below list).
- Recommended offer: $198k (12.0% below list) — sets the bar for market timing.
Location & tenants
- Location reads 64/100 on livability (#274 in GA) — a middle-class / working-renter tenant base. Strengths: cost of living A+, housing A+; Watch: crime D, amenities F, commute F.
- Dekalb County (suburban): math 19% / reading 28% proficiency, ranked #125 of 174 in GA (top 72%) — low school quality limits family demand, transient renter base, plan for 1-2y turnover; 68% free/reduced lunch — lower-income household profile, screen leases tightly.
- Zoned schools: Shadow Rock Elementary School (math 5% / reading 5%, grade F, #1,160 of 1,228 statewide, top 98%, 489 students, 100% FRL); Redan Middle School (math 8% / reading 12%, grade F, #433 of 470 statewide, top 93%, 668 students, 100% FRL); Redan High School (math 8% / reading 17%, grade F, #336 of 424 statewide, top 80%, 951 students, 100% FRL) — zoned schools average 100% FRL vs 68% district-wide (32 pts higher); higher-poverty schools than district average — tighter screening recommended.
- Zoned-school proficiency averages 9% at this address vs 24% district-wide (-14 pts) — the specific schools serving this property underperform the Dekalb County average; the district grade overstates school quality for this exact location.
- Market conditions: Rents rising (+3.7%/yr); 220 active listings in the ZIP; 40 comparable units currently listed for rent nearby; rentals at typical pace (median 22d on market — plan ~3-4 weeks tenant-placement turnaround); 1,240 units permitted in DeKalb County in 2024 (385 in 5+ unit buildings).
- This rent runs 34% of the median local income ($70k/yr) — at the standard rent-burdened threshold; future hikes will face affordability resistance.
Forward outlook
- Local home prices are declining (-3.0%/yr); year-one equity from $2k of loan paydown is wiped out by about $7k of value loss. Plan a longer hold.
- DeKalb County population projected at +28% by 2050 — long-run rental-demand tailwind backs the buy-and-hold thesis.
Negotiation context
- It's been on market 145 days — a 12% lower offer ($198k) is reasonable based on typical stale-listing flexibility.
- 2 sale attempts since 15y ago with the ask held roughly flat each time — persistent listings suggest the price (not the market) is what's stuck; bring a comps-based counter.
Risks & watch-outs
- Climate carrying-cost: moderate wind risk, 26% chance of damaging wind over 30y; extreme-heat days projected 7→18/yr by 2055 (HVAC capex compounding) — expect insurance premiums to compound above CPI over the hold.
Questions for the listing agent
- What do current leases actually rent for vs. the listed asking? Can we see a recent rent roll and the last 12 months of T-12 income?
- It's been on market 145 days. Have you received any prior offers? Is the seller open to a 12% concession, seller financing, or rate buy-down credit?
- Why hasn't it sold? Are there any deal-killer items the seller is aware of (foundation, flood, title, zoning, code violations)?
- Is there a deadline driving the sale (1031 exchange, divorce, estate, relocation)? That informs how much negotiation room exists.
- Schools are B-rated — typically a magnet for longer-tenancy family renters. What's the average tenant stay here, and is there a school-zone premium baked into asking?
- Crime grade is D in this area — have there been break-ins, vandalism, or insurance claims at this property in the last 3 years? What carrier currently insures it and at what premium?
- The area grade is low — what's the realistic commute time and amenity access for the typical tenant pool here? Any planned neighborhood developments (good or bad) we should know about?
- What's the average days-on-market for RENTAL listings here right now (not sales)? A rising rental-DOM trend means longer vacancies and softer asking-rent achievability than the comps imply.
- What's the recent tenant-quality profile in this submarket — average credit score on applications, eviction rate, late-payment / NSF rate, and stable-employment percentage? A property-management company in the area should have these aggregated.
- How much new for-sale + rental construction is in the pipeline within 1–3 miles? Heavy new supply typically softens prices + rents 12–24 months out; constrained supply supports both.
Investment metrics
- 1% rule
- 0.89% ✗
- Cap rate
- 6.08%
- Cash-on-cash
- -0.77%
- DSCR
- 0.97
- GRM
- 9.4
CMA / ARV
- ARV (median comp)
- $243,478
- List price
- $224,900
- Delta
- -7.63%
- Verdict
- FAIR
- Comps
- 20 within 1.0 mi
Show comp detail 12 sales within ~0.75 mi
| Address | Dist | Beds/Ba | Sqft | Sold | Price | $/sf | Match |
|---|---|---|---|---|---|---|---|
| 708 Greenhedge Dr | 0.06mi | 3/2.0 | 1,680 (+6%) | 2mo | $150,000 | $89 | 84 |
| 884 Forest Path | 0.24mi | 3/2.0 | 1,632 (+3%) | 1mo | $225,000 | $138 | 82 |
| 922 Fox Valley Ct | 0.24mi | 4/2.5 (+1) | 1,678 (+6%) | 2mo | $290,000 | $173 | 72 |
| 5486 Fox Valley Ln | 0.47mi | 3/3.0 | 1,536 (-3%) | 3mo | $140,000 | $91 | 68 |
| 5233 Mccarter Sta | 0.49mi | 3/2.0 | 1,528 (-4%) | 2mo | $220,000 | $144 | 67 |
| 5242 Mccarter Sta | 0.46mi | 4/3.0 (+1) | 1,640 (+3%) | 3mo | $277,000 | $169 | 64 |
| 5232 Mainstreet Park Dr | 0.42mi | 3/3.0 | 1,695 (+7%) | 4mo | $259,000 | $153 | 64 |
| 5208 Mainstreet Park Dr | 0.48mi | 3/2.0 | 1,482 (-7%) | 2mo | $200,000 | $135 | 63 |
| 1017 Forest West Ct | 0.55mi | 4/2.0 (+1) | 1,626 (+2%) | 4mo | $198,400 | $122 | 60 |
| 870 Chapman Cir | 0.54mi | 3/2.0 | 1,432 (-10%) | 2mo | $185,000 | $129 | 55 |
| 629 Waterview Ct | 0.73mi | 4/2.5 (+1) | 1,542 (-3%) | 2mo | $229,000 | $149 | 55 |
| 960 Stone Mountain Lithonia Rd | 0.37mi | 3/1.0 | 1,795 (+13%) | 2mo | $134,000 | $75 | 53 |
Match score weights: distance 35% · size 25% · config 20% · recency 20%. Top-matched comps best support the ARV.
Projected returns pro-forma
-3.0% appreciation · 3.72% rent growth · sell at horizon
- IRR
- -16.7%
- Equity multiple
- 0.40×
- Total profit
- $-37,481
- Equity at exit
- $33,533
- IRR
- -7.1%
- Equity multiple
- 0.53×
- Total profit
- $-29,577
- Equity at exit
- $19,445
Cash invested: $62,972 (down + closing). Projections, not guarantees.
Landlord ↔ Tenant lean methodology
- Overall (STATE)
- 90 Strongly Landlord-Friendly
- State Georgia
- 90 Strongly Landlord-Friendly · R+3
- County
- — inherits STATE
- City
- — inherits STATE
ZIP-level market 30088
- Rents YoY
- 3.7%
- Active inventory
- 220
- Price-to-rent
- 9.4×
Monthly cashflow live
- Estimated rent
- $2,001 high interval (Pro) →
- Mortgage (P&I)
- −$1,179
- Tax from tax record
- −$348 /mo · $4,173/yr
- Insurance
- −$94
- HOA
- −$0
- Vacancy / Maint / Mgmt
- −$420
- Net cashflow
- $-40
Break-even live
Sensitivity live
| Price | -10% $87 | -5% $23 | +0% $-40 | +5% $-104 | +10% $-168 |
|---|---|---|---|---|---|
| Rent | -10% $-198 | -5% $-119 | +0% $-40 | +5% $39 | +10% $118 |
| Rate | -1.0pp $73 | -0.5pp $17 | base $-40 | +0.5pp $-99 | +1.0pp $-158 |
UW: 25.0% down · 7.5% · 30yr · 1.5% tax · 5.0% vac · 8.0% maint · 8.0% mgmt
Financing live
Cash to close
- Down payment
- $56,225
- Closing costs
- $6,747
- Reserves months
- —
- Total cash needed
- —
Loan-product check · same deal, 3 products live
Conventional
25% down · 7.5% · 30yr
- Down + closing
- —
- Monthly P&I
- —
- Monthly cashflow
- —
- DSCR
- —
- Eligible?
- —
Personal DTI + credit; lowest rate.
DSCR
20% down · 8.5% · 30yr
- Down + closing
- —
- Monthly P&I
- —
- Monthly cashflow
- —
- DSCR
- —
- Eligible?
- —
No personal income docs; deal must DSCR.
Hard money
10% down · 12.0% · 12mo
- Down + closing
- —
- Monthly P&I
- —
- Monthly cashflow
- —
- DSCR
- —
- Eligible?
- —
Short-term bridge; refi at stabilization.
Rent comps 40 comps
| Address | Beds | Baths | Sqft | Rent | $/sqft | DOM | Units | Dist |
|---|---|---|---|---|---|---|---|---|
| 811 King Rd Stone Mountain, GA | 3.0 | 3.0 | 1840 | $3,300 | $1.79 | 45d | 1 | 0.23mi |
| 782 Fox Valley Dr Stone Mountain, GA | 4.0 | 2.0 | 1964 | $2,000 | $1.02 | 26d | 1 | 0.34mi |
| 5486 Fox Valley Ln Stone Mountain, GA | 3.0 | 2.5 | 1536 | $1,850 | $1.20 | 21d | 1 | 0.44mi |
| 5482 Martins Crossing Rd Stone Mountain, GA | 3.0 | 2.0 | 1482 | $1,575 | $1.06 | 14d | 1 | 0.61mi |
| 1078 Forest Path Stone Mountain, GA | 4.0 | 2.5 | 1554 | $1,845 | $1.19 | 45d | 1 | 0.61mi |
| 1076 Martin Rd Stone Mountain, GA | 4.0 | 2.0 | 1760 | $2,011 | $1.14 | 18d | 1 | 0.82mi |
| 5386 Kristian Ct Stone Mountain, GA | 4.0 | 2.0 | 1531 | $1,901 | $1.24 | 26d | 1 | 0.83mi |
| 5349 Tracey Dr Stone Mountain, GA | 3.0 | 2.0 | 1188 | $1,975 | $1.66 | 18d | 1 | 0.85mi |
| 5349 Tracey Dr Stone Mountain, GA | 3.0 | 2.0 | 1188 | $1,975 | $1.66 | 45d | 1 | 0.85mi |
| 1168 Perry Way Stone Mountain, GA | 4.0 | 3.0 | 2100 | $1,200 | $0.57 | 3d | 1 | 0.85mi |
| 905 Hemingway Rd Stone Mountain, GA | 3.0 | 2.0 | 1400 | $1,625 | $1.16 | 14d | 1 | 0.87mi |
| 5702 Wells Cir Stone Mountain, GA | 2.0 | 2.5 | 1160 | $1,495 | $1.29 | 45d | 1 | 0.89mi |
| 5713 Wells Cir Stone Mountain, GA | 3.0 | 2.5 | 1304 | $1,706 | $1.31 | 7d | 1 | 0.90mi |
| 5707 Wells Cir Stone Mountain, GA | 2.0 | 2.5 | 1160 | $1,506 | $1.30 | 6d | 1 | 0.91mi |
| 5621 Stonington Trace Pkwy Stone Mountain, GA | 2.0 | 3.5 | 1292 | $1,581 | $1.22 | 17d | 1 | 0.93mi |
| 5308 Omalley Ln Stone Mountain, GA | 4.0 | 2.5 | 1950 | $1,949 | $1.00 | 45d | 1 | 0.94mi |
| 5035 Martins Crossing Rd Stone Mountain, GA | 3.0 | 2.0 | 1288 | $1,550 | $1.20 | 1d | 1 | 0.95mi |
| 5734 Lanny Ln Lithonia, GA | 3.0 | 2.0 | 1589 | $1,800 | $1.13 | 26d | 1 | 1.06mi |
| 469 Sherwood Grn Stone Mountain, GA | 3.0 | 2.0 | 1792 | $1,810 | $1.01 | 13d | 1 | 1.08mi |
| 4899 Hairston Pl Stone Mountain, GA | 3.0 | 2.5 | 1468 | $1,981 | $1.35 | 14d | 1 | 1.21mi |
| 869 Heritage Oaks Dr Stone Mountain, GA | 3.0 | 2.5 | 1400 | $1,199 | $0.86 | 1d | 1 | 1.23mi |
| 1467 Muirfield Dr Stone Mountain, GA | 3.0 | 2.0 | 1630 | $1,870 | $1.15 | 24d | 1 | 1.25mi |
| 4980 Fairforest Dr Stone Mountain, GA | 3.0 | 2.0 | 2181 | $2,075 | $0.95 | 14d | 1 | 1.26mi |
| 643 Navarre Dr Stone Mountain, GA | 3.0 | 2.5 | 1666 | $2,600 | $1.56 | 45d | 1 | 1.27mi |
| 924 Lake Drive Ter Stone Mountain, GA | 3.0 | 2.0 | 1380 | $1,670 | $1.21 | 45d | 1 | 1.27mi |
| 1228 Mill Lake Cir Stone Mountain, GA | 3.0 | 2.0 | 1344 | $1,645 | $1.22 | 45d | 1 | 1.28mi |
| 1401 Mill Lake Cir Stone Mountain, GA | 3.0 | 2.0 | 1320 | $1,675 | $1.27 | 14d | 1 | 1.33mi |
| 1373 Mill Lake Cir Stone Mountain, GA | 3.0 | 2.0 | 1296 | $1,738 | $1.34 | 1d | 1 | 1.34mi |
| 1183 Mill Lake Cir Stone Mountain, GA | 3.0 | 2.0 | 1373 | $1,751 | $1.28 | 7d | 1 | 1.34mi |
| 1338 Mill Lake Cir Stone Mountain, GA | 3.0 | 2.0 | 1844 | $1,900 | $1.03 | 3d | 1 | 1.35mi |
| 5811 Navarre Ct Stone Mountain, GA | 3.0 | 2.0 | 1864 | $1,911 | $1.03 | 4d | 1 | 1.35mi |
| 5799 Redan Rd Stone Mountain, GA | 3.0 | 2.0 | 1546 | $1,490 | $0.96 | 26d | 1 | 1.36mi |
| 1401 Panola Rd Stone Mountain, GA | 4.0 | 4.5 | 2000 | $2,975 | $1.49 | 45d | 1 | 1.36mi |
| 450 Pennybrook Dr Stone Mountain, GA | 3.0 | 2.0 | 1404 | $1,750 | $1.25 | 26d | 1 | 1.37mi |
| 867 Oakhill Ct Stone Mountain, GA | 3.0 | 2.5 | 1556 | $1,850 | $1.19 | 45d | 1 | 1.38mi |
| 5165 Fairforest Dr Stone Mountain, GA | 3.0 | 2.0 | 1344 | $1,695 | $1.26 | 45d | 1 | 1.40mi |
| 5994 Pattillo Ln Lithonia, GA | 3.0 | 2.5 | 1680 | $1,940 | $1.15 | 7d | 1 | 1.41mi |
| 4813 Hairston Pl Stone Mountain, GA | 2.0 | 2.0 | 1204 | $1,400 | $1.16 | 45d | 1 | 1.41mi |
| 4935 Millstone Walk Stone Mountain, GA | 3.0 | 2.5 | 1248 | $1,950 | $1.56 | 7d | 1 | 1.42mi |
| 5118 Rocky Gln Stone Mountain, GA | 4.0 | 2.0 | 1932 | $2,100 | $1.09 | 45d | 1 | 1.45mi |
Listing history 19 events
-
2026-06-03days on market $224,900 Active 145 DOM
-
2026-06-02days on market $224,900 Active 144 DOM
-
2026-06-01days on market $224,900 Active 143 DOM
-
2026-05-31days on market $224,900 Active 142 DOM
-
2026-04-17price $224,900 574-char remark
Show marketing remark (574 chars)
Traditional two-story home offering approximately 1,588 sq ft of living space with 3 bedrooms and 2.5 bathrooms. The interior features a family room with fireplace, separate dining area, eat-in kitchen, and convenient upper-level laundry room. An attached garage and driveway provide private parking, while the level lot of nearly 0.29 acres offers outdoor space for gardening and recreation. Central heating and air conditioning, public water and sewer, and reliable utility access complete this solid residential property in the Greenhedge Way community of Stone Mountain.
-
2026-01-30price $229,900 574-char remark
Show marketing remark (574 chars)
Traditional two-story home offering approximately 1,588 sq ft of living space with 3 bedrooms and 2.5 bathrooms. The interior features a family room with fireplace, separate dining area, eat-in kitchen, and convenient upper-level laundry room. An attached garage and driveway provide private parking, while the level lot of nearly 0.29 acres offers outdoor space for gardening and recreation. Central heating and air conditioning, public water and sewer, and reliable utility access complete this solid residential property in the Greenhedge Way community of Stone Mountain.
-
2026-01-09$234,900 New 574-char remark
Show marketing remark (574 chars)
Traditional two-story home offering approximately 1,588 sq ft of living space with 3 bedrooms and 2.5 bathrooms. The interior features a family room with fireplace, separate dining area, eat-in kitchen, and convenient upper-level laundry room. An attached garage and driveway provide private parking, while the level lot of nearly 0.29 acres offers outdoor space for gardening and recreation. Central heating and air conditioning, public water and sewer, and reliable utility access complete this solid residential property in the Greenhedge Way community of Stone Mountain.
-
2022-01-05soldstatus $7,435,817
-
2018-07-09soldstatus $467,800
-
2011-04-19historical 183-char remark
Show marketing remark (183 chars)
AMAZING FORECLOSURE OPPORTUNITY! 4 BEDROOM 2.5 BA HOME OPEN KITCHEN W/STAINED CABINETS. SEPARATE LIVING AND DINING ROOMS. FRONT PORCH AND MUCH MORE. SOLD AS IS NO SELLER'S DISCLOSURE.
-
2011-04-15soldstatus $28,100 Sold 183-char remark
Show marketing remark (183 chars)
AMAZING FORECLOSURE OPPORTUNITY! 4 BEDROOM 2.5 BA HOME OPEN KITCHEN W/STAINED CABINETS. SEPARATE LIVING AND DINING ROOMS. FRONT PORCH AND MUCH MORE. SOLD AS IS NO SELLER'S DISCLOSURE.
-
2011-02-25status Pending 183-char remark
Show marketing remark (183 chars)
AMAZING FORECLOSURE OPPORTUNITY! 4 BEDROOM 2.5 BA HOME OPEN KITCHEN W/STAINED CABINETS. SEPARATE LIVING AND DINING ROOMS. FRONT PORCH AND MUCH MORE. SOLD AS IS NO SELLER'S DISCLOSURE.
-
2011-02-19price $29,900 Reduced
-
2011-02-18price $29,900 183-char remark
Show marketing remark (183 chars)
AMAZING FORECLOSURE OPPORTUNITY! 4 BEDROOM 2.5 BA HOME OPEN KITCHEN W/STAINED CABINETS. SEPARATE LIVING AND DINING ROOMS. FRONT PORCH AND MUCH MORE. SOLD AS IS NO SELLER'S DISCLOSURE.
-
2011-01-21$39,900 Active 183-char remark
Show marketing remark (183 chars)
AMAZING FORECLOSURE OPPORTUNITY! 4 BEDROOM 2.5 BA HOME OPEN KITCHEN W/STAINED CABINETS. SEPARATE LIVING AND DINING ROOMS. FRONT PORCH AND MUCH MORE. SOLD AS IS NO SELLER'S DISCLOSURE.
-
2004-10-29soldstatus $118,000
-
1993-10-27soldstatus $83,200
-
1990-08-07soldstatus $83,900
-
1985-09-19soldstatus $79,000
ⓘ Source: listings_history table (triggers on properties + properties_extension) + one-shot
backfill from property_details.listing_events for pre-trigger history.
Tax reassessment forecast GA · Resets to sale price
- Current annual tax
- $4,173 · $348/mo
- Projected year-2 tax
- $4,173 · $348/mo
- Expected delta
- $0/yr ($0/mo · 0.0%)
ⓘ Screening estimate from a state-policy table — verify with the county assessor before closing.
Climate risk First Street
- Flood 1/10 Low FEMA zone X (unshaded) · 0% chance over 30 yrs
- Wildfire 1/10 Low
- Heat 5/10 Major 7 d/yr ≥104°F today · 18 d/yr by 30 yrs out
- Wind 5/10 Major 26% chance of damaging wind over 30 yrs
- Air quality 6/10 Major 8 unhealthy d/yr today · 11 by 30 yrs out
Nearby sold comps map
Loading sold comps map…
Walkable amenities ~0.75 mi
Loading nearby amenities…
Taxation est. · year 1
- Rental income
- $24,009
- − Mortgage interest
- −$12,598
- − Property taxes
- −$4,173
- − Insurance
- −$1,124
- − Repairs & maintenance
- −$1,921
- − Management
- −$1,921
- − Depreciation
- −$6,543
- Taxable loss
- −$4,271
- Est. tax savings @ 24.0%
- +$1,025
- After-tax cash flow
- $541/yr
For passive investors: Depreciation is non-cash, so a rental often shows a tax loss while cash-flowing — sheltering income. Rental losses are passive: they offset passive income freely, and up to $25,000/yr can offset ordinary (W-2) income if you actively participate and your MAGI is under $100k (phasing out to $0 by $150k); unused losses carry forward. On sale, claimed depreciation is recaptured at up to 25%, and gains may owe capital-gains tax (a 1031 exchange can defer both). Figures are a year-1 estimate at your 24.0% rate — not tax advice; consult a CPA.
Schools (NCES district)
- District
- Dekalb County
- NCES district ID
- 1301740
- Math proficiency
- 19% ▼ -12.00%
- Reading proficiency
- 28% ▼ -7.00%
- Median HH income
- $51,448
- Composite
- 20.92/100
- National rank
- #8482
- State rank
- #125 of 174 in GA
Livability — Redan
- Score
- 64/100
- State rank
- #274
- US rank
- #14766
Category grades
Schools grade is shown separately in the Schools card above.
Census & demographics
- County
- Dekalb County · 782,738 people
- City population
- 29,279
- Metro
- Atlanta-Sandy Springs-Alpharetta, GA
- Population (ZIP)
- 29,240
- Household income
- $70,325
- Rent vs Own
- Severe rent burden
- 1106.0
Population outlook (DeKalb County) Hauer SSP2
- Today (2025)
- 839,977 people
- By 2030
- 891,768 · +6.2%
- By 2040
- 988,894 · +17.7%
- By 2050
- 1,074,583 · +27.9%
- By 2075
- 1,245,026 · +48.2%
- By 2100
- 1,303,135 · +55.1%
Race, ethnicity, and origin ACS 2023
- Neighborhood character
- Predominantly Black (84%)
- Race & ethnicity
- Black 84% White 5% Hispanic / Latino 5% Two or more races 5%
- Common ancestry
- Swedish 1% Russian 1%
- Foreign-born
- 11% · Canada
- Languages at home
- 90% English-only · Spanish 4% French/Haitian/Cajun 1% Other Indo-European 1%
Political lean MEDSL · DeKalb
- 2024 margin
- Solid D (+64.8) · D 81.9% · R 17.1% · Other 1.0%
- 2008→2024 swing
- +6.1pp toward D · 2008: 58.6pp · 2024: 64.8pp
- All cycles
- 2024: D+64.8 2020: D+67.4 2016: D+64.8 2012: D+56.8 2008: D+58.6
Not yet ingested
- Civics
- —
Market trends
- HPI YoY
- ▼ -169.92%
- Current HPI
- 206.5421
- Rent YoY
- ▲ 3.72%
- Metro
- Atlanta-Sandy Springs-Alpharetta, GA
- State GDP YoY
- ▲ 2.66%
- F500 in state
- 28
Industry mix (Fortune 500 HQ in GA)
| Industry | F500 HQs | Revenue |
|---|---|---|
| Paper / Packaging | 2 | $29B |
|
||
| Retail | 1 | $160B |
|
||
| Transportation / Logistics | 1 | $91B |
|
||
| Airlines | 1 | $62B |
|
||
| Consumer Goods | 1 | $47B |
|
||
| Utilities | 1 | $25B |
|
||
Price history
+184.7% since first listed15 events — show timeline
- 2026-04-17 Price Changed $224,900 GAMLS
- 2026-01-30 Price Changed $229,900 GAMLS
- 2026-01-09 Listed $234,900 GAMLS
- 2022-01-05 Sold (Public Records) $7,435,817 Public Records
- 2018-07-09 Sold (Public Records) $467,800 Public Records
- 2011-04-19 Listing Removed — FMLS
- 2011-04-15 Sold (MLS) $28,100 FMLS
- 2011-02-25 Pending — FMLS
- 2011-02-19 Price Changed $29,900 GAMLS
- 2011-02-18 Price Changed $29,900 FMLS
- 2011-01-21 Listed $39,900 FMLS
- 2004-10-29 Sold (Public Records) $118,000 Public Records
- 1993-10-27 Sold (Public Records) $83,200 Public Records
- 1990-08-07 Sold (Public Records) $83,900 Public Records
- 1985-09-19 Sold (Public Records) $79,000 Public Records
Property tax history
+4.0%/yrLatest (2025): $4,173 · +0.1% YoY. Source: county tax records.
Cash-flow waterfall
monthlySold comps — $/sqft
last 12 mo · ≤1 miLoading sold comps…