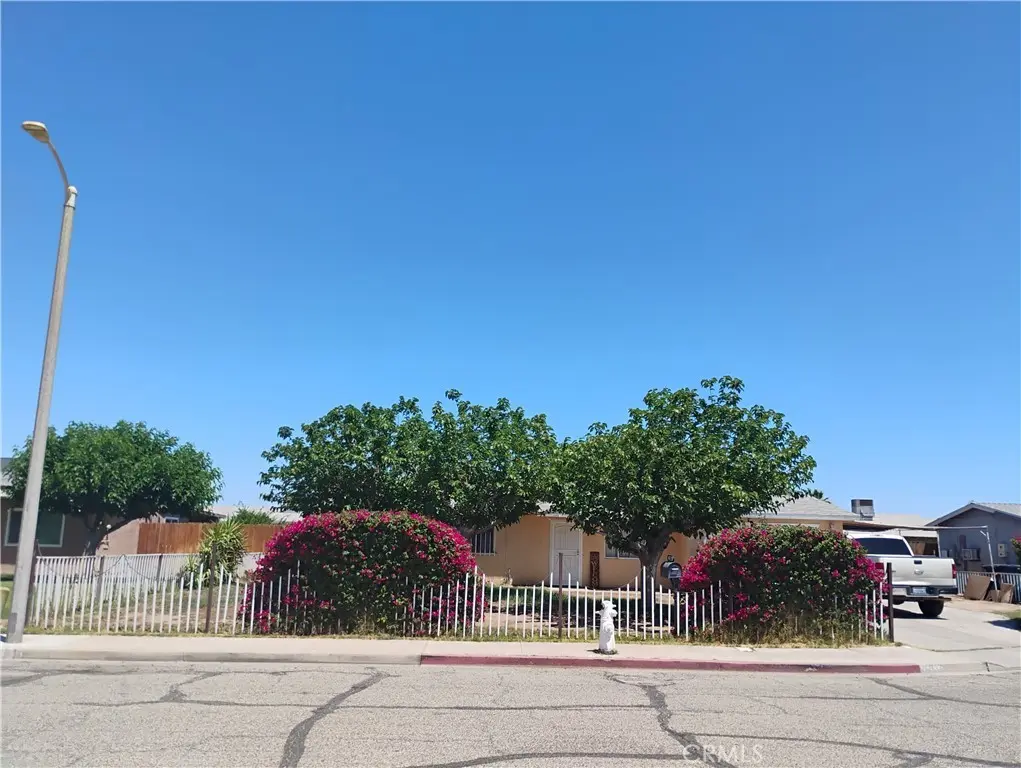
1333 Bruce Ct · Blythe, CA
Flood risk 1/10 · Minimal
- FEMA flood zone
- D
- Chance of flooding over 30 yrs
- 0.0%
- Est. flood insurance / yr
- $544 – $1,084
Fire risk 1/10 · Minimal
- Est. fire insurance / yr
- $659 – $1,223
Heat risk 9/10 · Severe
- Hot days now (above 116°F)
- 7 days/yr
- Hot days in 30 yrs
- 19 days/yr
Wind risk 1/10 · Minimal
- Chance of severe wind over 30 yrs
- —
Air-quality risk 2/10 · Minimal
- Unhealthy air days now
- 1 days/yr
- Unhealthy air days in 30 yrs
- 1 days/yr
Risk factors via First Street. Map © Google.
Why this score? — see what drove the D- grade
The composite is a weighted blend of 9 inputs, each scored 0–100. Each bar is that input's sub-score; the figure is the points it added to the 100-point composite (weight × sub-score).
- Cash flow +13.6/30.0
- DSCR +4.1/10.0
- Livability +3.7/5.0
- ARV discount +3.5/15.0
- 1% rule +3.2/10.0
- Schools +2.6/10.0
- Rent growth +2.5/5.0
- Condition / age +2.5/5.0
- Appreciation +0.0/10.0
$194,999
🖨 Deal sheet 📄 Offer letter ✓ Due diligence
Listing remarks MLS
Very nice home in a well established neighborhood. The home has over 1100 square feet of living space with three bedrooms and two full bathrooms. Good size living room and kitchen with dining area next to it. Has an attached one car garage. Front and back yard are fenced in. Much more to see so make an appointment to view this home.
Key facts
- Near schools
- Near shopping
- Near parks
Tags
Property features AI
Finance
- HOA & community: Rural community setting
Exterior
- Parking: Attached garage (1 car); 1 total parking space
- Utilities: Public sewer; District/Public water; Solar energy generation
- Home design: Single-story; Entry at level 1; No accessory dwelling unit
- Construction: Year built from assessor
- Exterior features: House structure; Front yard; Back yard; Located on a cul-de-sac; No pool
Interior
- Kitchen: Gas range; Gas oven
- Bedrooms: 1 bedroom on the main level
- Bathrooms: 2 full bathrooms
- Heating & cooling: Central cooling; Central furnace heating
- Interior features: One-level home; Entry area
- Laundry & utility: Washer hookup; Laundry facilities available
Neighborhood map
What this means for you Summary
Snapshot
- This is a 3-bed/2.0-bath single-family listed at $195k.
Deal economics
- At list price, monthly cash flow is $10 ($125/yr) — positive.
- The deal already cash-flows at list — no discount required.
- To meet the 1% rule (rent ≥ 1% of price), the offer needs to be $159k (18.5% below list).
- Recommended offer: $159k (18.5% below list) — sets the bar for 1% rule.
- Cap rate 6.4% vs local median 4.6% in Blythe — top-decile yield for the area; either an underpriced asset or a hidden risk that comps aren't pricing in. Stress-test before assuming the spread holds.
Location & tenants
- Location reads 74/100 on livability (#143 in CA, #4,910 nationally) — a middle-class / working-renter tenant base. Strengths: commute A+, housing A+, health & safety A+; Watch: employment D, schools F, amenities F.
- Palo Verde Unified (town): math 20% / reading 34% proficiency, ranked #1,133 of 1,400 in CA (top 81%) — low school quality limits family demand, transient renter base, plan for 1-2y turnover; 64% free/reduced lunch — lower-income household profile, screen leases tightly.
- Market conditions: 189 active listings in the ZIP; 5 comparable units currently listed for rent nearby; rentals leasing fast (median 13d on market — plan ~1-2 weeks tenant-placement turnaround); 40% of comp listings sitting > 30 days — soft ceiling on asking rent; 9,195 units permitted in Riverside County in 2024 (1,512 in 5+ unit buildings).
Forward outlook
- Local home prices are declining (-3.0%/yr); year-one equity from $1k of loan paydown is wiped out by about $6k of value loss. Plan a longer hold.
- Riverside County population projected at +22% by 2050 — long-run rental-demand tailwind backs the buy-and-hold thesis.
Negotiation context
- It's been on market 27 days — a 2% lower offer ($192k) is reasonable based on typical stale-listing flexibility.
- 4 sale attempts since 15y ago with the ask held roughly flat each time — persistent listings suggest the price (not the market) is what's stuck; bring a comps-based counter.
- Current owner paid $77k; list at $195k implies a 153% gain — meaningful room to come down on a strong offer.
Risks & watch-outs
- Climate carrying-cost: extreme-heat days projected 7→19/yr by 2055 (HVAC capex compounding) — expect insurance premiums to compound above CPI over the hold.
Questions for the listing agent
- Is there a deadline driving the sale (1031 exchange, divorce, estate, relocation)? That informs how much negotiation room exists.
- Schools are F-rated, which usually means shorter tenancies and higher turnover. Who's the typical renter profile here, and what's been the actual vacancy rate?
- The area grade is low — what's the realistic commute time and amenity access for the typical tenant pool here? Any planned neighborhood developments (good or bad) we should know about?
- What's the average days-on-market for RENTAL listings here right now (not sales)? A rising rental-DOM trend means longer vacancies and softer asking-rent achievability than the comps imply.
- What's the recent tenant-quality profile in this submarket — average credit score on applications, eviction rate, late-payment / NSF rate, and stable-employment percentage? A property-management company in the area should have these aggregated.
- How much new for-sale + rental construction is in the pipeline within 1–3 miles? Heavy new supply typically softens prices + rents 12–24 months out; constrained supply supports both.
Investment metrics
- 1% rule
- 0.82% ✗
- Cap rate
- 6.36%
- Cash-on-cash
- 0.23%
- DSCR
- 1.01
- GRM
- 10.2
CMA / ARV
- ARV (on-the-fly)
- $179,056
- Comps found
- 11
Show comp detail 11 sales within ~0.75 mi
| Address | Dist | Beds/Ba | Sqft | Sold | Price | $/sf | Match |
|---|---|---|---|---|---|---|---|
| 318 N Carlton Ave | 0.16mi | 3/1.0 | 1,122 (-5%) | 0mo | $139,105 | $124 | 80 |
| 441 N Willow St | 0.42mi | 3/2.0 | 1,132 (-4%) | 1mo | $215,000 | $190 | 73 |
| 491 N Willow St | 0.43mi | 3/2.0 | 1,132 (-4%) | 6mo | $220,000 | $194 | 69 |
| 725 W Chanslor Way | 0.41mi | 3/2.0 | 1,248 (+6%) | 7mo | $130,000 | $104 | 65 |
| 560 Parker Pl | 0.71mi | 3/2.0 | 1,176 (-0%) | 3mo | $220,000 | $187 | 64 |
| 1325 W Michigan Ave | 0.05mi | 3/1.0 | 1,272 (+8%) | 22mo | $190,000 | $149 | 62 |
| 1366 W San Gorgonio St | 0.14mi | 3/1.0 | 1,248 (+6%) | 23mo | $190,000 | $152 | 60 |
| 310 N Lovekin Blvd | 0.41mi | 3/1.5 | 1,132 (-4%) | 17mo | $142,000 | $125 | 58 |
| 300 N Lovekin Blvd | 0.41mi | 3/2.0 | 1,242 (+5%) | 22mo | $200,000 | $161 | 54 |
| 660 Parker Pl | 0.65mi | 2/2.0 (-1) | 1,276 (+8%) | 3mo | $215,000 | $168 | 48 |
| 680 W California St | 0.47mi | 3/1.0 | 1,020 (-13%) | 23mo | $135,000 | $132 | 32 |
Match score weights: distance 35% · size 25% · config 20% · recency 20%. Top-matched comps best support the ARV.
Projected returns pro-forma
-3.0% appreciation · 3.0% rent growth · sell at horizon
- IRR
- -16.0%
- Equity multiple
- 0.43×
- Total profit
- $-30,975
- Equity at exit
- $29,075
- IRR
- -7.6%
- Equity multiple
- 0.52×
- Total profit
- $-26,278
- Equity at exit
- $16,860
Cash invested: $54,600 (down + closing). Projections, not guarantees.
Landlord ↔ Tenant lean methodology
- Overall (STATE)
- 18 Strongly Tenant-Friendly
- State California
- 18 Strongly Tenant-Friendly · D+13
- County
- — inherits STATE
- City
- — inherits STATE
ZIP-level market 92225
- Home prices YoY
- -15.8%
- Active inventory
- 189
- Price-to-rent
- 10.2×
Monthly cashflow live
- Estimated rent
- $1,590 high interval (Pro) →
- Mortgage (P&I)
- −$1,023
- Tax from tax record
- −$142 /mo · $1,699/yr
- Insurance
- −$81
- HOA
- −$0
- Vacancy / Maint / Mgmt
- −$334
- Net cashflow
- $10
Break-even live
UW: 25.0% down · 7.5% · 30yr · 1.5% tax · 5.0% vac · 8.0% maint · 8.0% mgmt
Financing live
Cash to close
- Down payment
- $48,750
- Closing costs
- $5,850
- Reserves months
- —
- Total cash needed
- —
Loan-product check · same deal, 3 products live
Conventional
25% down · 7.5% · 30yr
- Down + closing
- —
- Monthly P&I
- —
- Monthly cashflow
- —
- DSCR
- —
- Eligible?
- —
Personal DTI + credit; lowest rate.
DSCR
20% down · 8.5% · 30yr
- Down + closing
- —
- Monthly P&I
- —
- Monthly cashflow
- —
- DSCR
- —
- Eligible?
- —
No personal income docs; deal must DSCR.
Hard money
10% down · 12.0% · 12mo
- Down + closing
- —
- Monthly P&I
- —
- Monthly cashflow
- —
- DSCR
- —
- Eligible?
- —
Short-term bridge; refi at stabilization.
Rent comps 5 comps
| Address | Beds | Baths | Sqft | Rent | $/sqft | DOM | Units | Dist |
|---|---|---|---|---|---|---|---|---|
| 381 San Luis Way Blythe, CA | 4.0 | 2.0 | 1316 | $1,800 | $1.37 | 43d | 1 | 0.05mi |
| 400 N Palm Dr Blythe, CA | 2.0–3.0 | 1.0–1.5 | 928 | $1,100 | $1.18 | 13d | 1 | 0.54mi |
| 450 W Barnard St Blythe, CA | 2.0–3.0 | 1.0–2.0 | 935 | $1,095 | $1.17 | 13d | 2 | 0.62mi |
| 238 E Rice St Blythe, CA | 2.0 | 1.0 | 800 | $1,100 | $1.38 | 43d | 1 | 1.14mi |
| 551 S 3rd St Blythe, CA | 2.0–3.0 | 1.0–2.0 | 885 | $1,120 | $1.27 | 13d | 9 | 1.42mi |
Listing history 29 events
-
2026-06-19days on market $194,999 Active 27 DOM
-
2026-06-18days on market $194,999 Active 26 DOM
-
2026-06-17days on market $194,999 Active 25 DOM
-
2026-06-16days on market $194,999 Active 24 DOM
-
2026-06-15days on market $194,999 Active 23 DOM
-
2026-06-14days on market $194,999 Active 21 DOM
-
2026-06-12days on market $194,999 Active 20 DOM
-
2026-06-09days on market $194,999 Active 17 DOM
-
2026-06-08days on market $194,999 Active 16 DOM
-
2026-06-07days on market $194,999 Active 15 DOM
-
2026-06-07days on market $194,999 Active 14 DOM
-
2026-06-04days on market $194,999 Active 11 DOM
-
2026-06-02days on market $194,999 Active 10 DOM
-
2026-06-01days on market $194,999 Active 9 DOM
-
2026-05-31days on market $194,999 Active 8 DOM
-
2026-05-31days on market $194,999 Active 7 DOM
-
2026-05-23$194,999 Active
-
2018-04-23soldstatus $77,000 Sold 334-char remark
Show marketing remark (334 chars)
Very nice home in a well established neighborhood. The home has over 1100 square feet of living space with three bedrooms and two full bathrooms. Good size living room and kitchen with dining area next to it. Has an attached one car garage. Front and back yard are fenced in. Much more to see so make an appointment to view this home.
-
2018-04-03soldstatus $75,000
-
2018-01-23status Pending 334-char remark
Show marketing remark (334 chars)
Very nice home in a well established neighborhood. The home has over 1100 square feet of living space with three bedrooms and two full bathrooms. Good size living room and kitchen with dining area next to it. Has an attached one car garage. Front and back yard are fenced in. Much more to see so make an appointment to view this home.
-
2018-01-10$75,000 Active 334-char remark
Show marketing remark (334 chars)
Very nice home in a well established neighborhood. The home has over 1100 square feet of living space with three bedrooms and two full bathrooms. Good size living room and kitchen with dining area next to it. Has an attached one car garage. Front and back yard are fenced in. Much more to see so make an appointment to view this home.
-
2017-12-31historical
-
2017-10-31price $80,000
-
2017-10-30price $75,000
-
2017-06-21$125,000 Active
-
2012-12-08historical
-
2012-06-07price $69,999
-
2011-12-16price $77,400
-
2011-08-20$77,900 Active
ⓘ Source: listings_history table (triggers on properties + properties_extension) + one-shot
backfill from property_details.listing_events for pre-trigger history.
Tax reassessment forecast CA · Resets to sale price
- Current annual tax
- $1,699 · $142/mo
- Projected year-2 tax
- $1,699 · $142/mo
- Expected delta
- $0/yr ($0/mo · 0.0%)
ⓘ Screening estimate from a state-policy table — verify with the county assessor before closing.
Climate risk First Street
- Flood 1/10 Low FEMA zone D · 0% chance over 30 yrs
- Wildfire 1/10 Low
- Heat 9/10 Extreme 7 d/yr ≥116°F today · 19 d/yr by 30 yrs out
- Wind 1/10 Low
- Air quality 2/10 Low 1 unhealthy d/yr today · 1 by 30 yrs out
Nearby sold comps map
Loading sold comps map…
Walkable amenities ~0.75 mi
Loading nearby amenities…
Taxation est. · year 1
- Rental income
- $19,076
- − Mortgage interest
- −$10,923
- − Property taxes
- −$1,699
- − Insurance
- −$975
- − Repairs & maintenance
- −$1,526
- − Management
- −$1,526
- − Depreciation
- −$5,673
- Taxable loss
- −$3,246
- Est. tax savings @ 24.0%
- +$779
- After-tax cash flow
- $904/yr
For passive investors: Depreciation is non-cash, so a rental often shows a tax loss while cash-flowing — sheltering income. Rental losses are passive: they offset passive income freely, and up to $25,000/yr can offset ordinary (W-2) income if you actively participate and your MAGI is under $100k (phasing out to $0 by $150k); unused losses carry forward. On sale, claimed depreciation is recaptured at up to 25%, and gains may owe capital-gains tax (a 1031 exchange can defer both). Figures are a year-1 estimate at your 24.0% rate — not tax advice; consult a CPA.
Schools (NCES district)
- District
- Palo Verde Unified
- NCES district ID
- 0629640
- Math proficiency
- 20% ▲ 3.00%
- Reading proficiency
- 34% ▲ 5.00%
- Median HH income
- $40,808
- Composite
- 25.77/100
- National rank
- #12796
- State rank
- #1133 of 1400 in CA
Livability — Blythe
- Score
- 74/100
- State rank
- #143
- US rank
- #4910
Category grades
Schools grade is shown separately in the Schools card above.
Census & demographics
- Census place
- Blythe, CA
- Population (ZIP)
- 21,101
Population outlook (Riverside County) Hauer SSP2
- Today (2025)
- 2,664,475 people
- By 2030
- 2,802,692 · +5.2%
- By 2040
- 3,050,904 · +14.5%
- By 2050
- 3,256,783 · +22.2%
- By 2075
- 3,655,058 · +37.2%
- By 2100
- 3,766,594 · +41.4%
Race, ethnicity, and origin ACS 2023
- Neighborhood character
- Diverse neighborhood (Simpson 0.58)
- Race & ethnicity
- Hispanic / Latino 59% White 26% Two or more races 13% Black 10% Asian 2% Native American 2%
- Hispanic origin (detail)
- Mexican 54%
- Common ancestry
- Lithuanian 1% Romanian 1% Iranian 1%
- Foreign-born
- 18% · Canada
- Languages at home
- 55% English-only · Spanish 42% Other Indo-European 1% Tagalog/Filipino 0%
Political lean MEDSL · Riverside
- 2024 margin
- Toss-up / Even · D 48.0% · R 49.3% · Other 2.6%
- 2008→2024 swing
- -3.6pp toward R · 2008: 2.3pp · 2024: -1.3pp
- All cycles
- 2024: R+1.3 2020: D+8.0 2016: D+4.3 2012: R+0.4 2008: D+2.3
Not yet ingested
- Civics
- —
Market trends
- HPI YoY
- ▼ -40.53%
- Current HPI
- 215.4794
- Rent YoY
- —
- Metro
- —
- State GDP YoY
- ▲ 3.21%
- F500 in state
- 116
Industry mix (Fortune 500 HQ in CA)
| Industry | F500 HQs | Revenue |
|---|---|---|
| Technology | 27 | $1,492B |
|
||
| Financial Services | 3 | $174B |
|
||
| Retail | 3 | $44B |
|
||
| Insurance | 3 | $26B |
|
||
| Media / Entertainment | 2 | $115B |
|
||
| Pharmaceuticals / Biotech | 2 | $62B |
|
||
Price history
+150.3% since first listed13 events — show timeline
- 2026-05-23 Listed $194,999 CRMLS
- 2018-04-23 Sold (MLS) $77,000 GPSMLS
- 2018-04-03 Sold (Public Records) $75,000 Public Records
- 2018-01-23 Pending — GPSMLS
- 2018-01-10 Listed $75,000 GPSMLS
- 2017-12-31 Listing Removed — GPSMLS
- 2017-10-31 Price Changed $80,000 GPSMLS
- 2017-10-30 Price Changed $75,000 GPSMLS
- 2017-06-21 Listed $125,000 GPSMLS
- 2012-12-08 Listing Removed — GPSMLS
- 2012-06-07 Price Changed $69,999 GPSMLS
- 2011-12-16 Price Changed $77,400 GPSMLS
- 2011-08-20 Listed $77,900 GPSMLS
Property tax history
+3.9%/yrLatest (2025): $1,699 · -0.9% YoY. Source: county tax records.
Cash-flow waterfall
monthlySold comps — $/sqft
last 12 mo · ≤1 miLoading sold comps…