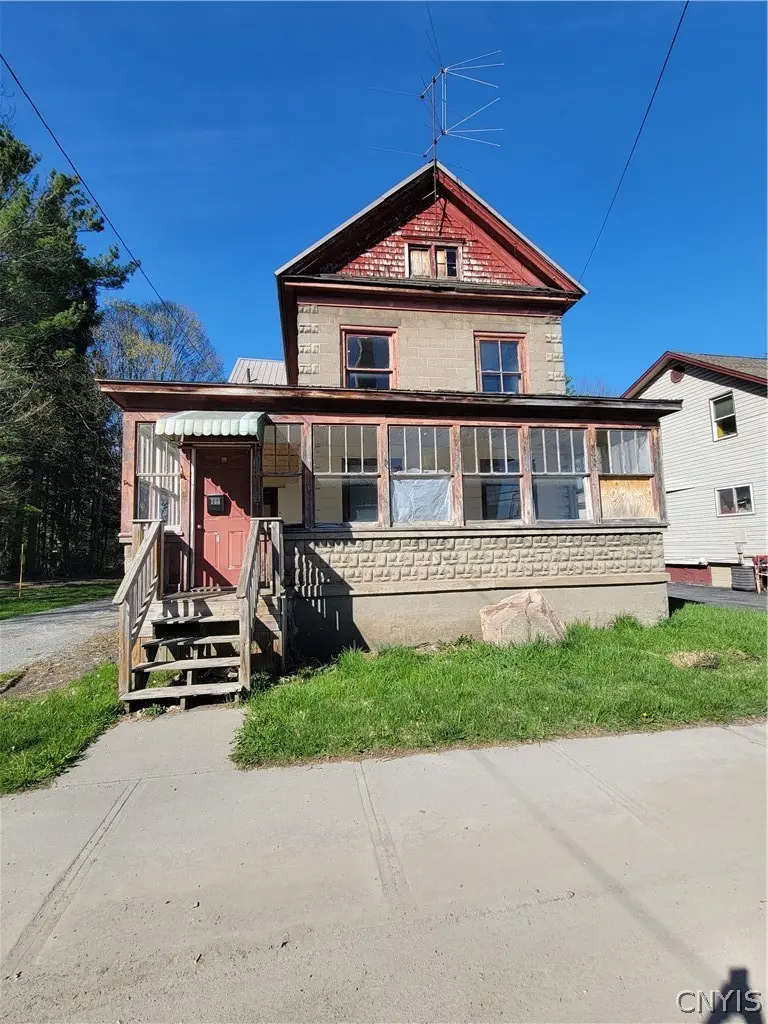
744 W End Ave · Carthage, NY
Flood risk 10/10 · Severe
- FEMA flood zone
- AE
- Chance of flooding over 30 yrs
- 0.99%
- Est. flood insurance / yr
- $2,026 – $9,024
Fire risk 1/10 · Minimal
- Est. fire insurance / yr
- $691 – $1,283
Heat risk 1/10 · Minimal
- Hot days now (above 91°F)
- 7 days/yr
- Hot days in 30 yrs
- 16 days/yr
Wind risk 1/10 · Minimal
- Chance of severe wind over 30 yrs
- —
Air-quality risk 2/10 · Minimal
- Unhealthy air days now
- 0 days/yr
- Unhealthy air days in 30 yrs
- 1 days/yr
Risk factors via First Street. Map © Google.
Why this score? — see what drove the B+ grade
The composite is a weighted blend of 9 inputs, each scored 0–100. Each bar is that input's sub-score; the figure is the points it added to the 100-point composite (weight × sub-score).
- Cash flow +30.0/30.0
- 1% rule +10.0/10.0
- DSCR +10.0/10.0
- Appreciation +10.0/10.0
- ARV discount +7.5/15.0
- Livability +3.5/5.0
- Schools +3.3/10.0
- Rent growth +2.5/5.0
- Condition / age +2.5/5.0
$84,500
🖨 Deal sheet 📄 Offer letter ✓ Due diligence
Listing remarks
A DIAMOND IN THE ROUGH. This home is solid and massive yard double lot used as circular driveway. . Whether you're looking for your forever home or looking use as income property, this is the perfect option. This spacious village home offers incredible potential with 4 bedrooms and 2 full bathrooms set on an impressive deep lot measuring 94x332 feet. Inside, you'll find beautiful hardwood floors, large formal living and dining rooms perfect for gatherings, first-floor laundry, a convenient mud room, and an enclosed porch to enjoy year-round. Major updates include a newer roof on the main house and a new sump pump for added peace of mind. Lot still had remnants of garage foundation. There
Key facts
- Newer roof
- Enclosed porch
- Hardwood floors
Tags
Property features AI
Exterior
- Parking: No garage; Circular driveway
- Utilities: Electricity connected; Public water connected; Sewer connected; High-speed internet available; Cable available
- Home design: 2-story existing home; Poured foundation; Metal roof; Constructed with block and concrete
- Construction: Built previously (existing structure); Block and concrete construction; Metal roof; Poured foundation
- Exterior features: Enclosed porch; Open porch; Shed(s) / storage; Dirt driveway; Gravel driveway; Rectangular lot; Road frontage on a main thoroughfare; Lot dimensions approximately 94 x 332
Interior
- Kitchen: Pantry
- Bedrooms: Total rooms: 11 (includes living and laundry areas)
- Flooring: Carpet; Hardwood; Vinyl; Varied flooring
- Bathrooms: 2 full bathrooms; 1 main-level bathroom
- Heating & cooling: Gas heating; Hot water heating; Radiator heating
- Interior features: Leaded glass windows; Separate/formal dining room; Separate/formal living room; Pantry; Natural woodwork; Full basement with sump pump
- Laundry & utility: Main-level laundry; Gas water heater
Neighborhood map
What this means for you Summary
Snapshot
- This is a 4-bed/1.0-bath single-family listed at $84k.
Deal economics
- At list price, monthly cash flow is $216 ($3k/yr) — positive.
- The deal already cash-flows at list — no discount required.
- Meets the 1% rule at list price ($2k rent vs $84k).
- Recommended offer: $82k (3.0% below list) — sets the bar for market timing.
- Cap rate 15.9% vs local median 5.5% in Carthage — top-decile yield for the area; either an underpriced asset or a hidden risk that comps aren't pricing in. Stress-test before assuming the spread holds.
Location & tenants
- Location reads 69/100 on livability (#506 in NY) — a middle-class / working-renter tenant base. Strengths: health & safety A+, cost of living A, crime B; Watch: schools C-, employment D+, amenities F.
- Carthage Central School District (rural): math 30% / reading 46% proficiency, ranked #539 of 590 in NY (top 91%) — families likely to look elsewhere, expect single-tenant / working-renter base with shorter leases.
- Market conditions: 77 active listings in the ZIP; 196 units permitted in Jefferson County in 2024 (0 in 5+ unit buildings).
- This rent runs 32% of the median local income ($63k/yr) — at the standard rent-burdened threshold; future hikes will face affordability resistance.
Forward outlook
- In year one you build about $9k of equity ($584 loan paydown + $8k appreciation (10.0% local appreciation)).
- Jefferson County population projected at -12% by 2050 — secular population decline; favor cash flow + early exit over multi-decade hold.
- At projected returns (10.0% appreciation + 3.0% rent growth), your $24k cash investment doubles in ~2 years — after that, you're playing with house money.
- By year 4, paydown + projected appreciation supports a ~$32k cash-out refi (75% LTV) — recoverable capital for the next deal without selling this one.
Negotiation context
- It's been on market 33 days — a 3% lower offer ($82k) is reasonable based on typical stale-listing flexibility.
Risks & watch-outs
- Watch-outs: property tax is 2.5% of price; flood insurance adds $460/mo; built in 1811 — expect roof / HVAC / electrical / plumbing capex.
- Climate carrying-cost: in FEMA flood zone AE (mandatory federal flood insurance) — expect insurance premiums to compound above CPI over the hold.
Questions for the listing agent
- It's been on market 33 days. Have you received any prior offers? Is the seller open to a 3% concession, seller financing, or rate buy-down credit?
- Built in 1811 — when were the roof, HVAC, electrical panel, plumbing, and water heater last replaced?
- Property tax is high relative to price — has the assessment been appealed recently, and will the sale trigger a re-assessment?
- What's the actual annual flood-insurance premium (NFIP or private), and is the property in a SFHA with mandatory coverage?
- Is there a deadline driving the sale (1031 exchange, divorce, estate, relocation)? That informs how much negotiation room exists.
- What's the average days-on-market for RENTAL listings here right now (not sales)? A rising rental-DOM trend means longer vacancies and softer asking-rent achievability than the comps imply.
- What's the recent tenant-quality profile in this submarket — average credit score on applications, eviction rate, late-payment / NSF rate, and stable-employment percentage? A property-management company in the area should have these aggregated.
- How much new for-sale + rental construction is in the pipeline within 1–3 miles? Heavy new supply typically softens prices + rents 12–24 months out; constrained supply supports both.
Investment metrics
- 1% rule
- 1.99% ✓
- Cap rate
- 15.90%
- Cash-on-cash
- 34.33%
- DSCR
- 2.53
- GRM
- 4.2
CMA / ARV
- ARV (median comp)
- $214,159
- List price
- $84,500
- Delta
- -60.54%
- Verdict
- UNDERPRICED
- Comps
- 20 within 1.0 mi
Show comp detail 12 sales within ~0.75 mi
| Address | Dist | Beds/Ba | Sqft | Sold | Price | $/sf | Match |
|---|---|---|---|---|---|---|---|
| 82 Champion St | 0.61mi | 4/2.0 | 1,694 (-5%) | 1mo | $236,000 | $139 | 58 |
| 713 Fulton St | 0.70mi | 4/2.0 | 1,737 (-2%) | 2mo | $204,250 | $118 | 57 |
| 838 Alexandria St | 0.47mi | 4/1.5 | 1,762 (-1%) | 22mo | $179,900 | $102 | 56 |
| 66 Champion St | 0.59mi | 3/2.0 (-1) | 1,819 (+2%) | 13mo | $220,000 | $121 | 49 |
| 304 N James St | 0.67mi | 4/1.5 | 1,800 (+1%) | 21mo | $185,000 | $103 | 48 |
| 427 N Clinton St | 0.56mi | 4/2.0 | 1,874 (+5%) | 17mo | $190,000 | $101 | 47 |
| 556 Adelaide St | 0.35mi | 5/3.0 (+1) | 1,890 (+6%) | 17mo | $1,000 | $1 | 46 |
| 47 N Jefferson St | 0.67mi | 3/2.5 (-1) | 1,674 (-6%) | 3mo | $286,700 | $171 | 45 |
| 20392 County Route 45 | 0.60mi | 4/1.0 | 1,536 (-14%) | 9mo | $151,000 | $98 | 41 |
| 37 N Main St | 0.70mi | 3/2.0 (-1) | 1,760 (-1%) | 21mo | $223,200 | $127 | 39 |
| 67 Champion St | 0.62mi | 4/2.0 | 1,631 (-8%) | 23mo | $195,000 | $120 | 34 |
| 614 Fulton St | 0.71mi | 3/1.5 (-1) | 2,018 (+13%) | 21mo | $230,000 | $114 | 20 |
Match score weights: distance 35% · size 25% · config 20% · recency 20%. Top-matched comps best support the ARV.
Projected returns pro-forma
10.0% appreciation · 3.0% rent growth · sell at horizon
- IRR
- 32.5%
- Equity multiple
- 3.54×
- Total profit
- $60,156
- Equity at exit
- $76,124
- IRR
- 28.1%
- Equity multiple
- 8.06×
- Total profit
- $167,011
- Equity at exit
- $164,165
Cash invested: $23,660 (down + closing). Projections, not guarantees.
Landlord ↔ Tenant lean methodology
- Overall (STATE)
- 15 Strongly Tenant-Friendly
- State New York
- 15 Strongly Tenant-Friendly · D+10
- County
- — inherits STATE
- City
- — inherits STATE
ZIP-level market 13619
- Home prices YoY
- 26.0%
- Active inventory
- 77
- Price-to-rent
- 4.2×
Monthly cashflow live
- Estimated rent
- $1,686 medium interval (Pro) →
- Mortgage (P&I)
- −$443
- Tax from tax record
- −$176 /mo · $2,118/yr
- Insurance
- −$35
- Flood insurance flood zone
- −$460 /mo · $5,525/yr
- HOA
- −$0
- Vacancy / Maint / Mgmt
- −$354
- Net cashflow
- $216
Break-even live
UW: 25.0% down · 7.5% · 30yr · 1.5% tax · 5.0% vac · 8.0% maint · 8.0% mgmt
Financing live
Cash to close
- Down payment
- $21,125
- Closing costs
- $2,535
- Reserves months
- —
- Total cash needed
- —
Loan-product check · same deal, 3 products live
Conventional
25% down · 7.5% · 30yr
- Down + closing
- —
- Monthly P&I
- —
- Monthly cashflow
- —
- DSCR
- —
- Eligible?
- —
Personal DTI + credit; lowest rate.
DSCR
20% down · 8.5% · 30yr
- Down + closing
- —
- Monthly P&I
- —
- Monthly cashflow
- —
- DSCR
- —
- Eligible?
- —
No personal income docs; deal must DSCR.
Hard money
10% down · 12.0% · 12mo
- Down + closing
- —
- Monthly P&I
- —
- Monthly cashflow
- —
- DSCR
- —
- Eligible?
- —
Short-term bridge; refi at stabilization.
Listing history 11 events
-
2026-06-12statusdays on market $84,500 Pending 33 DOM
-
2026-06-09days on market $84,500 Active 31 DOM
-
2026-06-08days on market $84,500 Active 30 DOM
-
2026-06-07days on market $84,500 Active 29 DOM
-
2026-06-05days on market $84,500 Active 26 DOM
-
2026-06-03days on market $84,500 Active 25 DOM
-
2026-06-02days on market $84,500 Active 24 DOM
-
2026-06-01days on market $84,500 Active 23 DOM
-
2026-05-31days on market $84,500 Active 22 DOM
-
2026-05-30days on market $84,500 Active 21 DOM
-
2026-05-09$84,500 Active 852-char remark
ⓘ Source: listings_history table (triggers on properties + properties_extension) + one-shot
backfill from property_details.listing_events for pre-trigger history.
Tax reassessment forecast NY · Partial reset (capped growth)
- Current annual tax
- $2,118 · $176/mo
- Projected year-2 tax
- $2,118 · $176/mo
- Expected delta
- $0/yr ($0/mo · 0.0%)
ⓘ Screening estimate from a state-policy table — verify with the county assessor before closing.
Climate risk First Street
- Flood 10/10 Extreme FEMA zone AE · 99% chance over 30 yrs
- Wildfire 1/10 Low
- Heat 1/10 Low 7 d/yr ≥91°F today · 16 d/yr by 30 yrs out
- Wind 1/10 Low
- Air quality 2/10 Low 0 unhealthy d/yr today · 1 by 30 yrs out
Nearby sold comps map
Loading sold comps map…
Walkable amenities ~0.75 mi
Loading nearby amenities…
Taxation est. · year 1
- Rental income
- $20,227
- − Mortgage interest
- −$4,733
- − Property taxes
- −$2,118
- − Insurance
- −$5,948
- − Repairs & maintenance
- −$1,618
- − Management
- −$1,618
- − Depreciation
- −$2,458
- Taxable income
- $1,734
- Est. tax owed @ 24.0%
- −$416
- After-tax cash flow
- $2,181/yr
For passive investors: Depreciation is non-cash, so a rental often shows a tax loss while cash-flowing — sheltering income. Rental losses are passive: they offset passive income freely, and up to $25,000/yr can offset ordinary (W-2) income if you actively participate and your MAGI is under $100k (phasing out to $0 by $150k); unused losses carry forward. On sale, claimed depreciation is recaptured at up to 25%, and gains may owe capital-gains tax (a 1031 exchange can defer both). Figures are a year-1 estimate at your 24.0% rate — not tax advice; consult a CPA.
Schools (NCES district)
- District
- Carthage Central School District
- NCES district ID
- 3606630
- Math proficiency
- 30% ▼ -18.00%
- Reading proficiency
- 46% ▲ 2.00%
- Median HH income
- $48,450
- Composite
- 32.63/100
- National rank
- #5668
- State rank
- #539 of 590 in NY
Livability — Carthage
- Score
- 69/100
- State rank
- #506
- US rank
- #8895
Category grades
Schools grade is shown separately in the Schools card above.
Census & demographics
- Census place
- Carthage, NY
- County
- Jefferson County · 47,417 people
- City population
- 10,578
- Metro
- Watertown-Fort Drum, NY
- Population (ZIP)
- 10,578
- Household income
- $63,120
- Rent vs Own
- Severe rent burden
- 379.0
Population outlook (Jefferson County) Hauer SSP2
- Today (2025)
- 111,748 people
- By 2030
- 109,370 · -2.1%
- By 2040
- 103,828 · -7.1%
- By 2050
- 98,523 · -11.8%
- By 2075
- 91,422 · -18.2%
- By 2100
- 78,214 · -30.0%
Race, ethnicity, and origin ACS 2023
- Neighborhood character
- Predominantly White (83%)
- Race & ethnicity
- White 83% Two or more races 8% Hispanic / Latino 6% Black 2%
- Hispanic origin (detail)
- Mexican 1% Puerto Rican 2%
- Common ancestry
- Lithuanian 9% Romanian 3% Iranian 1%
- Foreign-born
- 4% · Canada
- Languages at home
- 95% English-only · Spanish 3% Tagalog/Filipino 1%
Political lean MEDSL · Jefferson
- 2024 margin
- Strong R (+23.6) · D 38.2% · R 61.8%
- 2008→2024 swing
- -18.3pp toward R · 2008: -5.3pp · 2024: -23.6pp
- All cycles
- 2024: R+23.6 2020: R+19.0 2016: R+22.4 2012: R+2.9 2008: R+5.3
Not yet ingested
- Civics
- —
Market trends
- HPI YoY
- ▲ 84.02%
- Current HPI
- 406.9439
- Rent YoY
- —
- Metro
- Watertown-Fort Drum, NY
- State GDP YoY
- ▲ 2.60%
- F500 in state
- 92
Industry mix (Fortune 500 HQ in NY)
| Industry | F500 HQs | Revenue |
|---|---|---|
| Financial Services | 10 | $950B |
|
||
| Consumer Goods | 9 | $162B |
|
||
| Insurance | 4 | $225B |
|
||
| Telecommunications | 2 | $144B |
|
||
| Pharmaceuticals | 2 | $112B |
|
||
| Media / Entertainment | 2 | $69B |
|
||
Price history
2 events — show timeline
- 2026-06-11 Pending — CNYIS
- 2026-05-09 Listed $84,500 CNYIS
Property tax history
-2.2%/yrLatest (2025): $2,118 · +1.5% YoY. Source: county tax records.
Cash-flow waterfall
monthlySold comps — $/sqft
last 12 mo · ≤1 miLoading sold comps…