 Duplex
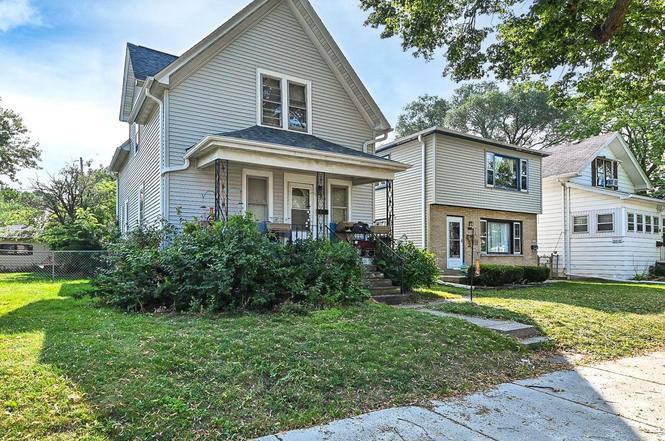
1950 S 56th St #1952 · West Allis, WI
Flood risk 1/10 · Minimal
- FEMA flood zone
- X (unshaded)
- Chance of flooding over 30 yrs
- 0.0%
- Est. flood insurance / yr
- $473 – $860
Fire risk 1/10 · Minimal
- Est. fire insurance / yr
- $636 – $1,182
Heat risk 2/10 · Minimal
- Hot days now (above 99°F)
- 7 days/yr
- Hot days in 30 yrs
- 13 days/yr
Wind risk 2/10 · Minimal
- Chance of severe wind over 30 yrs
- —
Air-quality risk 2/10 · Minimal
- Unhealthy air days now
- 1 days/yr
- Unhealthy air days in 30 yrs
- 1 days/yr
Risk factors via First Street. Map © Google.
Why this score? — see what drove the B+ grade
The composite is a weighted blend of 9 inputs, each scored 0–100. Each bar is that input's sub-score; the figure is the points it added to the 100-point composite (weight × sub-score).
- Cash flow +30.0/30.0
- ARV discount +15.0/15.0
- DSCR +10.0/10.0
- 1% rule +9.3/10.0
- Livability +4.0/5.0
- Rent growth +3.8/5.0
- Condition / age +2.5/5.0
- Schools +1.9/10.0
- Appreciation +0.0/10.0
$180,000
🖨 Deal sheet 📄 Offer letter ✓ Due diligence
Multi-family units
County records classify this as Multi-Family (2-4 Unit). Listing-text estimate: 2 units. confirmed
Listing remarks MLS
Attention investors priced to sell 2/2 duplex. Long term tenants. Extra large parking slab for off street parking. Separate utilities. Close to public transportation.
Key facts
- Off street parking
- Newer roof
- Newer siding
Tags
Neighborhood map
What this means for you Summary
Snapshot
- This is a 2 × 2-bed/1.0-bath units multifamily listed at $180k.
Deal economics
- At list price, monthly cash flow is $790 ($9k/yr) — positive. Per door: $395/mo.
- The deal already cash-flows at list — no discount required.
- Meets the 1% rule at list price ($3k rent vs $180k).
- Cap rate 11.6% vs local median 4.3% in West Allis — top-decile yield for the area; either an underpriced asset or a hidden risk that comps aren't pricing in. Stress-test before assuming the spread holds.
Location & tenants
- Location reads 79/100 on livability (#69 in WI, #1,958 nationally) — a middle-class / working-renter tenant base. Strengths: commute A+, cost of living A+, housing A+; Watch: amenities F.
- West Allis-West Milwaukee School District (urban): math 17% / reading 26% proficiency, ranked #328 of 342 in WI (top 96%) — low school quality limits family demand, transient renter base, plan for 1-2y turnover.
- Market conditions: Rents rising fast (+5.1%/yr); 55 active listings in the ZIP; 7 comparable units currently listed for rent nearby; rentals at typical pace (median 15d on market — plan ~3-4 weeks tenant-placement turnaround); 1,017 units permitted in Milwaukee County in 2024 (803 in 5+ unit buildings).
- This rent runs 44% of the median local income ($70k/yr) — at the standard rent-burdened threshold; future hikes will face affordability resistance.
Forward outlook
- Local home prices are declining (-3.0%/yr); year-one equity from $1k of loan paydown is wiped out by about $5k of value loss. Plan a longer hold.
- Milwaukee County population projected at +4% by 2050 — modest demand growth; plan on rents tracking national, not racing it.
- At projected returns (-3.0% appreciation + 5.1% rent growth), your $50k cash investment doubles in ~6 years — after that, you're playing with house money.
Negotiation context
- Only 10 days on market — expect competitive offers; lowballing is unlikely to land.
- 4 sale attempts since 9y ago; this cycle's ask has dropped $15k (8%) from the opening price — seller is motivated, your offer sets the floor, not the list.
- Current owner paid $62k; list at $180k implies a 191% gain — meaningful room to come down on a strong offer.
Risks & watch-outs
- Watch-outs: built in 1912 — expect roof / HVAC / electrical / plumbing capex.
Questions for the listing agent
- Can we see the unit-by-unit rent roll, current vacancy, and any below-market leases? What's the average tenancy length?
- What capital expenditures (roof, boiler, parking lot, exteriors) have been made in the last 5 years, and what's planned in the next 2?
- Built in 1912 — when were the roof, HVAC, electrical panel, plumbing, and water heater last replaced?
- Is there a deadline driving the sale (1031 exchange, divorce, estate, relocation)? That informs how much negotiation room exists.
- What's the average days-on-market for RENTAL listings here right now (not sales)? A rising rental-DOM trend means longer vacancies and softer asking-rent achievability than the comps imply.
- What's the recent tenant-quality profile in this submarket — average credit score on applications, eviction rate, late-payment / NSF rate, and stable-employment percentage? A property-management company in the area should have these aggregated.
- How much new apartment / multifamily construction is in the pipeline within 1–3 miles? Heavy new supply (>2% of stock underway) typically softens rents 12–24 months out; light construction supports rent growth.
Investment metrics
- 1% rule
- 1.43% ✓
- Cap rate
- 11.56%
- Cash-on-cash
- 18.82%
- DSCR
- 1.84
- GRM
- 5.8
CMA / ARV
- ARV (on-the-fly)
- $245,718
- Comps found
- 3
Show comp detail 3 sales within ~0.75 mi
| Address | Dist | Beds/Ba | Sqft | Sold | Price | $/sf | Match |
|---|---|---|---|---|---|---|---|
| 1731 S 60th St | 0.33mi | 3/2.0 (-1) | 1,122 (0%) | 5mo | $246,000 | $219 | 76 |
| 2080 S 61st St | 0.36mi | 3/2.0 (-1) | 1,094 (-2%) | 18mo | $240,000 | $219 | 59 |
| 1507 S 52nd St #1509 | 0.46mi | 3/2.0 (-1) | 1,233 (+10%) | 10mo | $273,000 | $221 | 49 |
Match score weights: distance 35% · size 25% · config 20% · recency 20%. Top-matched comps best support the ARV.
Projected returns pro-forma
-3.0% appreciation · 5.09% rent growth · sell at horizon
- IRR
- 13.0%
- Equity multiple
- 1.53×
- Total profit
- $26,734
- Equity at exit
- $26,839
- IRR
- 23.4%
- Equity multiple
- 3.22×
- Total profit
- $111,926
- Equity at exit
- $15,563
Cash invested: $50,400 (down + closing). Projections, not guarantees.
Landlord ↔ Tenant lean methodology
- Overall (STATE)
- 73 Landlord-Friendly
- State Wisconsin
- 73 Landlord-Friendly · R+2
- County
- — inherits STATE
- City
- — inherits STATE
ZIP-level market 53219
- Home prices YoY
- -29.8%
- Rents YoY
- 5.1%
- Active inventory
- 55
- Price-to-rent
- 11.7×
Monthly cashflow live
- Estimated rent
- $2,575 medium interval (Pro) →
- Mortgage (P&I)
- −$944
- Tax est. 1.5%
- −$225 /mo · $2,700/yr
- Insurance
- −$75
- HOA
- −$0
- Vacancy / Maint / Mgmt
- −$541
- Net cashflow
- $790
Break-even live
2-unit breakdown (identical units grouped — click to expand)
| Units | Beds | Baths | Est. rent |
|---|---|---|---|
| 2× units | 2 | 1 | $2,574 |
| #1 | 2 | 1 | $1,287 |
| #2 | 2 | 1 | $1,287 |
| Total (2 units) | $2,575 | ||
UW: 25.0% down · 7.5% · 30yr · 1.5% tax · 5.0% vac · 8.0% maint · 8.0% mgmt
Financing live
Cash to close
- Down payment
- $45,000
- Closing costs
- $5,400
- Reserves months
- —
- Total cash needed
- —
Loan-product check · same deal, 3 products live
Conventional
25% down · 7.5% · 30yr
- Down + closing
- —
- Monthly P&I
- —
- Monthly cashflow
- —
- DSCR
- —
- Eligible?
- —
Personal DTI + credit; lowest rate.
DSCR
20% down · 8.5% · 30yr
- Down + closing
- —
- Monthly P&I
- —
- Monthly cashflow
- —
- DSCR
- —
- Eligible?
- —
No personal income docs; deal must DSCR.
Hard money
10% down · 12.0% · 12mo
- Down + closing
- —
- Monthly P&I
- —
- Monthly cashflow
- —
- DSCR
- —
- Eligible?
- —
Short-term bridge; refi at stabilization.
Rent comps 7 comps
| Address | Beds | Baths | Sqft | Rent | $/sqft | DOM | Units | Dist |
|---|---|---|---|---|---|---|---|---|
| 1301 S 63rd St Uppr -6307 West Allis, WI | 3.0 | 1.0 | 1150 | $1,650 | $1.43 | 24d | 1 | 0.79mi |
| 5832 W Walker St Milwaukee, WI | 3.0 | 1.0 | 981 | $1,300 | $1.33 | 24d | 1 | 0.98mi |
| 1732 S 71st St Unit 1732 West Allis, WI | 3.0 | 1.0 | 912 | $1,795 | $1.97 | 12d | 1 | 0.99mi |
| 2958 S 58th St Milwaukee, WI | 4.0 | 2.0 | 1086 | $2,500 | $2.30 | 2d | 1 | 1.26mi |
| 642 S 66th St Milwaukee, WI | 3.0 | 1.0 | 1059 | $1,770 | $1.67 | 17d | 1 | 1.28mi |
| 638 S 66th St Milwaukee, WI | 3.0 | 1.0 | 1104 | $1,795 | $1.63 | 15d | 1 | 1.29mi |
| 2122 S 77th St Milwaukee, WI | 4.0 | 1.5 | 1434 | $1,895 | $1.32 | 14d | 1 | 1.35mi |
Listing history 13 events
-
2026-01-09status Pending
-
2026-01-06price $180,000
-
2026-01-06status Active
-
2025-08-15status Pending
-
2025-08-15historical
-
2025-08-08$195,000 Active
-
2017-10-16historical 166-char remark
Show marketing remark (166 chars)
Attention investors priced to sell 2/2 duplex. Long term tenants. Extra large parking slab for off street parking. Separate utilities. Close to public transportation.
-
2017-10-12soldstatus $61,900 Sold 166-char remark
Show marketing remark (166 chars)
Attention investors priced to sell 2/2 duplex. Long term tenants. Extra large parking slab for off street parking. Separate utilities. Close to public transportation.
-
2017-09-16historical Contingent 166-char remark
Show marketing remark (166 chars)
Attention investors priced to sell 2/2 duplex. Long term tenants. Extra large parking slab for off street parking. Separate utilities. Close to public transportation.
-
2017-09-06price $70,000 166-char remark
Show marketing remark (166 chars)
Attention investors priced to sell 2/2 duplex. Long term tenants. Extra large parking slab for off street parking. Separate utilities. Close to public transportation.
-
2017-09-01status Active 166-char remark
Show marketing remark (166 chars)
Attention investors priced to sell 2/2 duplex. Long term tenants. Extra large parking slab for off street parking. Separate utilities. Close to public transportation.
-
2017-08-24status Pending 166-char remark
Show marketing remark (166 chars)
Attention investors priced to sell 2/2 duplex. Long term tenants. Extra large parking slab for off street parking. Separate utilities. Close to public transportation.
-
2017-08-11$80,000 Active 166-char remark
Show marketing remark (166 chars)
Attention investors priced to sell 2/2 duplex. Long term tenants. Extra large parking slab for off street parking. Separate utilities. Close to public transportation.
ⓘ Source: listings_history table (triggers on properties + properties_extension) + one-shot
backfill from property_details.listing_events for pre-trigger history.
Climate risk First Street
- Flood 1/10 Low FEMA zone X (unshaded) · 0% chance over 30 yrs
- Wildfire 1/10 Low
- Heat 2/10 Low 7 d/yr ≥99°F today · 13 d/yr by 30 yrs out
- Wind 2/10 Low
- Air quality 2/10 Low 1 unhealthy d/yr today · 1 by 30 yrs out
Nearby sold comps map
Loading sold comps map…
Walkable amenities ~0.75 mi
Loading nearby amenities…
Taxation est. · year 1
- Rental income
- $30,900
- − Mortgage interest
- −$10,083
- − Property taxes
- −$2,700
- − Insurance
- −$900
- − Repairs & maintenance
- −$2,472
- − Management
- −$2,472
- − Depreciation
- −$5,236
- Taxable income
- $7,037
- Est. tax owed @ 24.0%
- −$1,689
- After-tax cash flow
- $7,795/yr
For passive investors: Depreciation is non-cash, so a rental often shows a tax loss while cash-flowing — sheltering income. Rental losses are passive: they offset passive income freely, and up to $25,000/yr can offset ordinary (W-2) income if you actively participate and your MAGI is under $100k (phasing out to $0 by $150k); unused losses carry forward. On sale, claimed depreciation is recaptured at up to 25%, and gains may owe capital-gains tax (a 1031 exchange can defer both). Figures are a year-1 estimate at your 24.0% rate — not tax advice; consult a CPA.
Schools (NCES district)
- District
- West Allis-West Milwaukee School District
- NCES district ID
- 5516260
- Math proficiency
- 17% ▼ -16.00%
- Reading proficiency
- 26% ▼ -12.00%
- Median HH income
- $45,620
- Composite
- 18.71/100
- National rank
- #8881
- State rank
- #328 of 342 in WI
Livability — West Allis
- Score
- 79/100
- State rank
- #69
- US rank
- #1958
Category grades
Schools grade is shown separately in the Schools card above.
Census & demographics
- Census place
- West Allis, WI
- County
- Milwaukee County · 926,379 people
- City population
- 57,365
- Metro
- Milwaukee-Waukesha, WI
- Population (ZIP)
- 34,764
- Household income
- $70,388
- Rent vs Own
- Severe rent burden
- 902.0
Population outlook (Milwaukee County) Hauer SSP2
- Today (2025)
- 995,758 people
- By 2030
- 1,009,124 · +1.3%
- By 2040
- 1,028,128 · +3.3%
- By 2050
- 1,040,066 · +4.4%
- By 2075
- 1,057,849 · +6.2%
- By 2100
- 1,039,774 · +4.4%
Race, ethnicity, and origin ACS 2023
- Neighborhood character
- Diverse neighborhood (Simpson 0.56)
- Race & ethnicity
- White 59% Hispanic / Latino 31% Two or more races 16% Black 5% Asian 3% Native American 1%
- Hispanic origin (detail)
- Mexican 22% Puerto Rican 7%
- Common ancestry
- Romanian 12% Portuguese 3% Lithuanian 3%
- Foreign-born
- 10% · Canada, Philippines, China
- Languages at home
- 77% English-only · Spanish 19% Other Asian/Pacific 2%
Political lean MEDSL · Milwaukee
- 2024 margin
- Solid D (+38.5) · D 68.3% · R 29.8% · Other 1.8%
- 2008→2024 swing
- +2.7pp toward D · 2008: 35.9pp · 2024: 38.5pp
- All cycles
- 2024: D+38.5 2020: D+39.9 2016: D+37.5 2012: D+34.6 2008: D+35.9
Not yet ingested
- Civics
- —
Market trends
- HPI YoY
- ▼ -118.46%
- Current HPI
- 278.8314
- Rent YoY
- ▲ 5.09%
- Metro
- Milwaukee-Waukesha, WI
- State GDP YoY
- ▲ 2.10%
- F500 in state
- 20
Industry mix (Fortune 500 HQ in WI)
| Industry | F500 HQs | Revenue |
|---|---|---|
| Industrial Machinery | 4 | $23B |
|
||
| Industrial Technology | 2 | $36B |
|
||
| Insurance | 1 | $36B |
|
||
| Professional Services | 1 | $19B |
|
||
| Utilities | 1 | $9B |
|
||
| Consumer Goods | 1 | $3B |
|
||
Price history
+125.0% since first listed13 events — show timeline
- 2026-01-09 Pending — METROMLS
- 2026-01-06 Price Changed $180,000 METROMLS
- 2026-01-06 Relisted — METROMLS
- 2025-08-15 Pending — METROMLS
- 2025-08-15 Listing Removed — METROMLS
- 2025-08-08 Listed $195,000 METROMLS
- 2017-10-16 Listing Removed — METROMLS
- 2017-10-12 Sold (MLS) $61,900 METROMLS
- 2017-09-16 Contingent — METROMLS
- 2017-09-06 Price Changed $70,000 METROMLS
- 2017-09-01 Relisted — METROMLS
- 2017-08-24 Pending — METROMLS
- 2017-08-11 Listed $80,000 METROMLS
Cash-flow waterfall
monthlySold comps — $/sqft
last 12 mo · ≤1 miLoading sold comps…