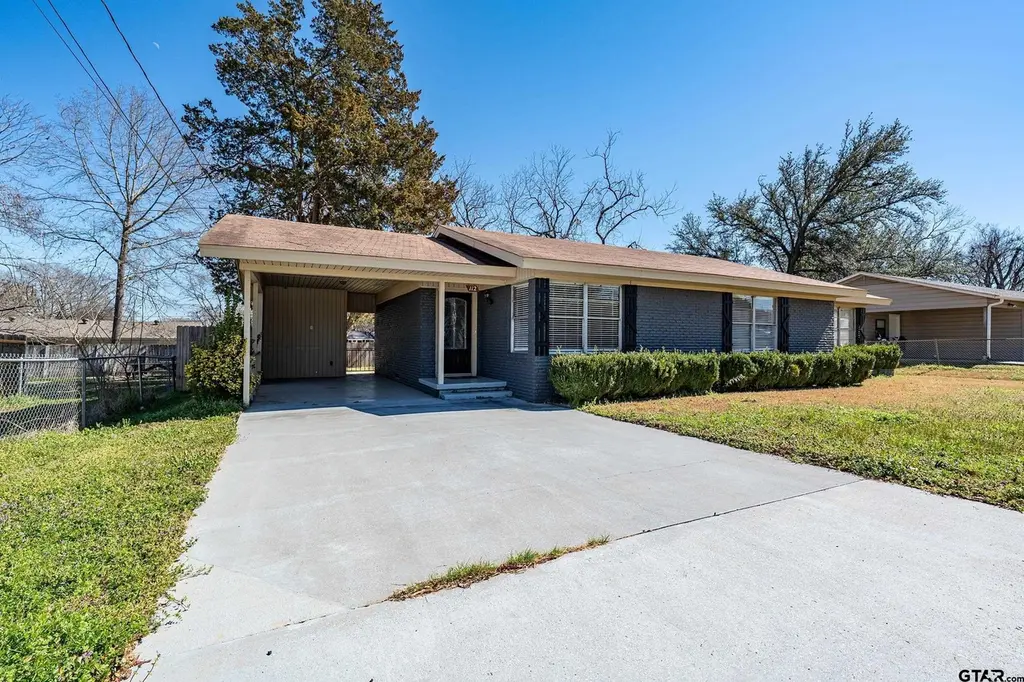
112 Lakeview St · Whitehouse, TX
Flood risk 1/10 · Minimal
- FEMA flood zone
- X (unshaded)
- Chance of flooding over 30 yrs
- 0.0%
- Est. flood insurance / yr
- $507 – $1,088
Fire risk 4/10 · Minor
- Est. fire insurance / yr
- $1,222 – $2,270
Heat risk 7/10 · Major
- Hot days now (above 109°F)
- 7 days/yr
- Hot days in 30 yrs
- 25 days/yr
Wind risk 6/10 · Moderate
- Chance of severe wind over 30 yrs
- 66.0%
Air-quality risk 1/10 · Minimal
- Unhealthy air days now
- 0 days/yr
- Unhealthy air days in 30 yrs
- 0 days/yr
Risk factors via First Street. Map © Google.
Why this score? — see what drove the D grade
The composite is a weighted blend of 9 inputs, each scored 0–100. Each bar is that input's sub-score; the figure is the points it added to the 100-point composite (weight × sub-score).
- ARV discount +15.0/15.0
- Cash flow +8.4/30.0
- Schools +5.5/10.0
- Livability +4.0/5.0
- Rent growth +3.2/5.0
- 1% rule +2.6/10.0
- Condition / age +2.5/5.0
- DSCR +2.3/10.0
- Appreciation +0.0/10.0
$199,500
🖨 Deal sheet (PDF) 📄 Offer letter ✓ Due diligence
Listing remarks MLS
Welcome to 112 Lakeview Street in the heart of Whitehouse! This charming 2-bedroom, 2-bath home offers timeless character with thoughtful updates and a functional single-story layout. Built in 1957 and situated in the established Massey Waters subdivision, this 1,340 square foot home features original hardwood flooring, spacious living areas, and abundant natural light throughout. The updated primary suite includes a private en-suite bath, providing comfort and privacy. The kitchen offers a practical layout with an electric range/oven, ample cabinetry, and an adjoining dining space perfect for everyday living. Updated lighting and ceiling fans add a fresh touch while maintaining the home's classic appeal. Outside, enjoy a covered carport, concrete driveway, fenced backyard, and inviting porch space ideal for relaxing evenings. The pier and beam foundation, brick veneer exterior, composition roof, and central heat/air add to the home's solid construction and functionality. Conveniently located just minutes from Whitehouse schools, shopping, and dining, this property offers small-town charm with everyday accessibility. Whether you're a first-time buyer, investor, or looking to downsize, this home presents a great opportunity in a desirable Whitehouse location.
Key facts
- Inviting porch space
- Covered carport
- Fenced backyard
Tags
Neighborhood map
What this means for you Summary
Snapshot
- This is a 2-bed/1.0-bath single-family listed at $200k.
Deal economics
- At list price, monthly cash flow is $-177 ($-2k/yr) — negative.
- To cash-flow at today's rent, offer at most $168k (15.7% below list).
- To meet the 1% rule (rent ≥ 1% of price), the offer needs to be $151k (24.1% below list).
- Recommended offer: $151k (24.1% below list) — sets the bar for 1% rule.
- Cap rate 5.2% vs local median 3.7% in Whitehouse — top-decile yield for the area; either an underpriced asset or a hidden risk that comps aren't pricing in. Stress-test before assuming the spread holds.
Location & tenants
- Location reads 79/100 on livability (#55 in TX, #2,180 nationally) — a middle-class / working-renter tenant base. Strengths: crime A+, cost of living A+, housing A+; Watch: amenities F, commute F.
- Whitehouse ISD (suburban): math 68% / reading 59% proficiency, ranked #38 of 826 in TX (top 5%) — acceptable for families but not a draw, mixed tenant base, ~2y average lease.
- Zoned schools: H L Higgins El (math 63% / reading 54%, grade B-, #467 of 4,322 statewide, top 11%, 597 students, 57% FRL); Whitehouse J H (math 65% / reading 53%, grade B, #181 of 1,662 statewide, top 11%, 776 students, 49% FRL); Whitehouse H S (math 71% / reading 69%, grade B+, #116 of 1,632 statewide, top 7%, 1,532 students, 44% FRL).
- Market conditions: Rents rising (+2.9%/yr); 201 active listings in the ZIP; 9 comparable units currently listed for rent nearby; rentals at typical pace (median 23d on market — plan ~3-4 weeks tenant-placement turnaround); solid renter incomes; 595 units permitted in Smith County in 2024 (45 in 5+ unit buildings).
Forward outlook
- Local home prices are declining (-3.0%/yr); year-one equity from $1k of loan paydown is wiped out by about $6k of value loss. Plan a longer hold.
- Smith County population projected at +24% by 2050 — long-run rental-demand tailwind backs the buy-and-hold thesis.
Negotiation context
- It's been on market 80 days — a 6% lower offer ($188k) is reasonable based on typical stale-listing flexibility.
- 4 sale attempts since 5y ago with the ask held roughly flat each time — persistent listings suggest the price (not the market) is what's stuck; bring a comps-based counter.
Risks & watch-outs
- Watch-outs: built in 1957 — expect roof / HVAC / electrical / plumbing capex.
- Climate carrying-cost: major wind risk, 66% chance of damaging wind over 30y; extreme-heat days projected 7→25/yr by 2055 (HVAC capex compounding) — expect insurance premiums to compound above CPI over the hold.
Questions for the listing agent
- What do current leases actually rent for vs. the listed asking? Can we see a recent rent roll and the last 12 months of T-12 income?
- It's been on market 80 days. Have you received any prior offers? Is the seller open to a 24% concession, seller financing, or rate buy-down credit?
- Built in 1957 — when were the roof, HVAC, electrical panel, plumbing, and water heater last replaced?
- Why hasn't it sold? Are there any deal-killer items the seller is aware of (foundation, flood, title, zoning, code violations)?
- Is there a deadline driving the sale (1031 exchange, divorce, estate, relocation)? That informs how much negotiation room exists.
- Schools are A-rated — typically a magnet for longer-tenancy family renters. What's the average tenant stay here, and is there a school-zone premium baked into asking?
- The area grade is low — what's the realistic commute time and amenity access for the typical tenant pool here? Any planned neighborhood developments (good or bad) we should know about?
- What's the average days-on-market for RENTAL listings here right now (not sales)? A rising rental-DOM trend means longer vacancies and softer asking-rent achievability than the comps imply.
- What's the recent tenant-quality profile in this submarket — average credit score on applications, eviction rate, late-payment / NSF rate, and stable-employment percentage? A property-management company in the area should have these aggregated.
- How much new for-sale + rental construction is in the pipeline within 1–3 miles? Heavy new supply typically softens prices + rents 12–24 months out; constrained supply supports both.
Investment metrics
- 1% rule
- 0.76% ✗
- Cap rate
- 5.23%
- Cash-on-cash
- -3.80%
- DSCR
- 0.83
- GRM
- 11.0
CMA / ARV
- ARV (median comp)
- $246,745
- List price
- $199,500
- Delta
- -19.15%
- Verdict
- UNDERPRICED
- Comps
- 12 within 1.0 mi
Show comp detail 1 sale within ~0.75 mi
| Address | Dist | Beds/Ba | Sqft | Sold | Price | $/sf | Match |
|---|---|---|---|---|---|---|---|
| 101 Merri Ln | 0.20mi | 3/2.0 (+1) | 1,329 (-1%) | 9mo | $215,000 | $162 | 73 |
Match score weights: distance 35% · size 25% · config 20% · recency 20%. Top-matched comps best support the ARV.
Projected returns pro-forma
-3.0% appreciation · 2.94% rent growth · sell at horizon
- IRR
- -22.7%
- Equity multiple
- 0.22×
- Total profit
- $-43,676
- Equity at exit
- $29,746
- IRR
- -17.2%
- Equity multiple
- 0.05×
- Total profit
- $-52,847
- Equity at exit
- $17,249
Cash invested: $55,860 (down + closing). Projections, not guarantees.
Landlord ↔ Tenant lean methodology
- Overall (STATE)
- 87 Strongly Landlord-Friendly
- State Texas
- 87 Strongly Landlord-Friendly · R+5
- County
- — inherits STATE
- City
- — inherits STATE
ZIP-level market 75791
- Home prices YoY
- -29.0%
- Rents YoY
- 2.9%
- Active inventory
- 201
- Price-to-rent
- 11.0×
Monthly cashflow live
- Estimated rent
- $1,515 high interval (Pro) →
- Mortgage (P&I)
- −$1,046
- Tax from tax record
- −$244 /mo · $2,931/yr
- Insurance
- −$83
- HOA
- −$0
- Vacancy / Maint / Mgmt
- −$318
- Net cashflow
- $-177
Break-even live
Sensitivity live
| Price | -10% $-64 | -5% $-121 | +0% $-177 | +5% $-234 | +10% $-290 |
|---|---|---|---|---|---|
| Rent | -10% $-297 | -5% $-237 | +0% $-177 | +5% $-117 | +10% $-57 |
| Rate | -1.0pp $-77 | -0.5pp $-126 | base $-177 | +0.5pp $-229 | +1.0pp $-281 |
UW: 25.0% down · 7.5% · 30yr · 1.5% tax · 5.0% vac · 8.0% maint · 8.0% mgmt
Financing live
Cash to close
- Down payment
- $49,875
- Closing costs
- $5,985
- Reserves months
- —
- Total cash needed
- —
Loan-product check · same deal, 3 products live
Conventional
25% down · 7.5% · 30yr
- Down + closing
- —
- Monthly P&I
- —
- Monthly cashflow
- —
- DSCR
- —
- Eligible?
- —
Personal DTI + credit; lowest rate.
DSCR
20% down · 8.5% · 30yr
- Down + closing
- —
- Monthly P&I
- —
- Monthly cashflow
- —
- DSCR
- —
- Eligible?
- —
No personal income docs; deal must DSCR.
Hard money
10% down · 12.0% · 12mo
- Down + closing
- —
- Monthly P&I
- —
- Monthly cashflow
- —
- DSCR
- —
- Eligible?
- —
Short-term bridge; refi at stabilization.
Rent comps 9 comps
| Address | Beds | Baths | Sqft | Rent | $/sqft | DOM | Units | Dist |
|---|---|---|---|---|---|---|---|---|
| 205 Shady Ln Whitehouse, TX | 3.0 | 2.0 | 1097 | $1,700 | $1.55 | 45d | 1 | 0.12mi |
| 806 Fleetwood Whitehouse, TX | 2.0 | 1.0 | 1033 | $1,050 | $1.02 | 22d | 1 | 0.31mi |
| 804 Fleetwood Whitehouse, TX | 2.0 | 1.0 | 1033 | $1,025 | $0.99 | 22d | 1 | 0.31mi |
| 820 Lindsey Ln Whitehouse, TX | 3.0 | 2.0 | 1340 | $1,895 | $1.41 | 45d | 1 | 0.32mi |
| 210 Memory Ln Whitehouse, TX | 2.0 | 1.0 | 962 | $1,050 | $1.09 | 22d | 1 | 0.39mi |
| 405 Amanda Ct Whitehouse, TX | 3.0 | 2.0 | 1658 | $1,900 | $1.15 | 22d | 1 | 0.58mi |
| 308 Hanks St Whitehouse, TX | 3.0 | 2.0 | 1500 | $1,650 | $1.10 | 45d | 1 | 0.69mi |
| 703 Memory Ln Whitehouse, TX | 3.0 | 2.0 | 1300 | $1,700 | $1.31 | 15d | 1 | 0.73mi |
| 805 Corey Dr Whitehouse, TX | 3.0 | 2.0 | 1504 | $1,725 | $1.15 | 15d | 1 | 0.85mi |
Listing history 8 events
-
2026-05-18status Pending 1278-char remark
Show marketing remark (1278 chars)
Welcome to 112 Lakeview Street in the heart of Whitehouse! This charming 2-bedroom, 2-bath home offers timeless character with thoughtful updates and a functional single-story layout. Built in 1957 and situated in the established Massey Waters subdivision, this 1,340 square foot home features original hardwood flooring, spacious living areas, and abundant natural light throughout. The updated primary suite includes a private en-suite bath, providing comfort and privacy. The kitchen offers a practical layout with an electric range/oven, ample cabinetry, and an adjoining dining space perfect for everyday living. Updated lighting and ceiling fans add a fresh touch while maintaining the home's classic appeal. Outside, enjoy a covered carport, concrete driveway, fenced backyard, and inviting porch space ideal for relaxing evenings. The pier and beam foundation, brick veneer exterior, composition roof, and central heat/air add to the home's solid construction and functionality. Conveniently located just minutes from Whitehouse schools, shopping, and dining, this property offers small-town charm with everyday accessibility. Whether you're a first-time buyer, investor, or looking to downsize, this home presents a great opportunity in a desirable Whitehouse location.
-
2026-02-26$199,500 Active 1278-char remark
Show marketing remark (1278 chars)
Welcome to 112 Lakeview Street in the heart of Whitehouse! This charming 2-bedroom, 2-bath home offers timeless character with thoughtful updates and a functional single-story layout. Built in 1957 and situated in the established Massey Waters subdivision, this 1,340 square foot home features original hardwood flooring, spacious living areas, and abundant natural light throughout. The updated primary suite includes a private en-suite bath, providing comfort and privacy. The kitchen offers a practical layout with an electric range/oven, ample cabinetry, and an adjoining dining space perfect for everyday living. Updated lighting and ceiling fans add a fresh touch while maintaining the home's classic appeal. Outside, enjoy a covered carport, concrete driveway, fenced backyard, and inviting porch space ideal for relaxing evenings. The pier and beam foundation, brick veneer exterior, composition roof, and central heat/air add to the home's solid construction and functionality. Conveniently located just minutes from Whitehouse schools, shopping, and dining, this property offers small-town charm with everyday accessibility. Whether you're a first-time buyer, investor, or looking to downsize, this home presents a great opportunity in a desirable Whitehouse location.
-
2025-08-20price $235,000
-
2024-12-05price $245,000
-
2024-08-14$260,000 Active
-
2023-05-19$260,000 Active
-
2021-11-19soldstatus
-
2021-10-26$137,500
ⓘ Source: listings_history table (triggers on properties + properties_extension) + one-shot
backfill from property_details.listing_events for pre-trigger history.
Tax reassessment forecast TX · Resets to sale price
- Current annual tax
- $2,931 · $244/mo
- Projected year-2 tax
- $3,651 · $304/mo
- Expected delta
- +$720/yr (+$60/mo · 24.6%)
ⓘ Screening estimate from a state-policy table — verify with the county assessor before closing.
Climate risk First Street
- Flood 1/10 Low FEMA zone X (unshaded) · 0% chance over 30 yrs
- Wildfire 4/10 Moderate
- Heat 7/10 Severe 7 d/yr ≥109°F today · 25 d/yr by 30 yrs out
- Wind 6/10 Major 66% chance of damaging wind over 30 yrs
- Air quality 1/10 Low 0 unhealthy d/yr today · 0 by 30 yrs out
Nearby sold comps map
Loading sold comps map…
Walkable amenities ~0.75 mi
Loading nearby amenities…
Taxation est. · year 1
- Rental income
- $18,175
- − Mortgage interest
- −$11,175
- − Property taxes
- −$2,931
- − Insurance
- −$998
- − Repairs & maintenance
- −$1,454
- − Management
- −$1,454
- − Depreciation
- −$5,804
- Taxable loss
- −$5,640
- Est. tax savings @ 24.0%
- +$1,354
- After-tax cash flow
- $-771/yr
For passive investors: Depreciation is non-cash, so a rental often shows a tax loss while cash-flowing — sheltering income. Rental losses are passive: they offset passive income freely, and up to $25,000/yr can offset ordinary (W-2) income if you actively participate and your MAGI is under $100k (phasing out to $0 by $150k); unused losses carry forward. On sale, claimed depreciation is recaptured at up to 25%, and gains may owe capital-gains tax (a 1031 exchange can defer both). Figures are a year-1 estimate at your 24.0% rate — not tax advice; consult a CPA.
Schools (NCES district)
- District
- Whitehouse ISD
- NCES district ID
- 4845600
- Math proficiency
- 68% ▼ -4.00%
- Reading proficiency
- 59% ▼ -1.00%
- Median HH income
- $62,060
- Composite
- 55.18/100
- National rank
- #1274
- State rank
- #38 of 826 in TX
Livability — Whitehouse
- Score
- 79/100
- State rank
- #55
- US rank
- #2180
Category grades
Schools grade is shown separately in the Schools card above.
Census & demographics
- Census place
- Whitehouse, TX
- County
- Smith County · 180,570 people
- City population
- 15,786
- Metro
- Tyler, TX
- Population (ZIP)
- 15,786
- Household income
- $92,107
- Rent vs Own
- Severe rent burden
- 313.0
Population outlook (Smith County) Hauer SSP2
- Today (2025)
- 248,890 people
- By 2030
- 261,665 · +5.1%
- By 2040
- 286,114 · +15.0%
- By 2050
- 308,006 · +23.8%
- By 2075
- 354,171 · +42.3%
- By 2100
- 372,828 · +49.8%
Race, ethnicity, and origin ACS 2023
- Neighborhood character
- Predominantly White (81%)
- Race & ethnicity
- White 81% Hispanic / Latino 8% Two or more races 8% Black 6%
- Hispanic origin (detail)
- Mexican 7% Salvadoran 1%
- Common ancestry
- Lithuanian 2% Italian 2% Iranian 2%
- Foreign-born
- 3% · Canada, Dominican Republic
- Languages at home
- 93% English-only · Spanish 6% Chinese 1%
Political lean MEDSL · Smith
- 2024 margin
- Solid R (+45.1) · D 27.0% · R 72.1%
- 2008→2024 swing
- -5.6pp toward R · 2008: -39.5pp · 2024: -45.1pp
- All cycles
- 2024: R+45.1 2020: R+39.4 2016: R+43.9 2012: R+46.9 2008: R+39.5
Not yet ingested
- Civics
- —
Market trends
- HPI YoY
- ▼ -82.16%
- Current HPI
- 201.297
- Rent YoY
- ▲ 2.94%
- Metro
- Tyler, TX
- State GDP YoY
- ▲ 3.95%
- F500 in state
- 110
Industry mix (Fortune 500 HQ in TX)
| Industry | F500 HQs | Revenue |
|---|---|---|
| Energy | 16 | $1,198B |
|
||
| Technology | 5 | $198B |
|
||
| Engineering / Construction | 4 | $72B |
|
||
| Energy Services | 3 | $60B |
|
||
| Utilities | 3 | $41B |
|
||
| Healthcare | 2 | $330B |
|
||
Price history
+45.1% since first listed8 events — show timeline
- 2026-05-18 Pending — GTAR
- 2026-02-26 Listed $199,500 GTAR
- 2025-08-20 Price Changed $235,000 GTAR
- 2024-12-05 Price Changed $245,000 GTAR
- 2024-08-14 Listed $260,000 GTAR
- 2023-05-19 Listed $260,000 GTAR
- 2021-11-19 Sold (MLS) — GTAR
- 2021-10-26 Listed $137,500 GTAR
Property tax history
+6.7%/yrLatest (2024): $2,931 · +7.7% YoY. Source: county tax records.
Cash-flow waterfall
monthlySold comps — $/sqft
last 12 mo · ≤1 miLoading sold comps…