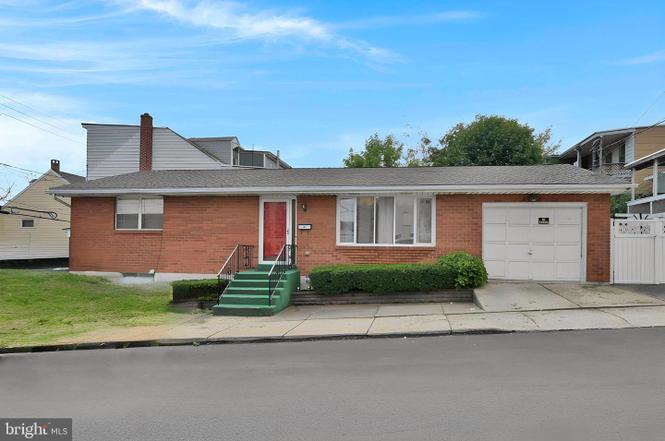
22 W Cherry St · Shenandoah, PA
Flood risk No data
- FEMA flood zone
- —
- Chance of flooding over 30 yrs
- —
- Est. flood insurance / yr
- —
Fire risk No data
- Est. fire insurance / yr
- —
Heat risk No data
- Hot days now (above threshold)
- —
- Hot days in 30 yrs
- —
Wind risk No data
- Chance of severe wind over 30 yrs
- —
Air-quality risk No data
- Unhealthy air days now
- —
- Unhealthy air days in 30 yrs
- —
Risk factors via First Street. Map © Google.
Why this score? — see what drove the D grade
The composite is a weighted blend of 9 inputs, each scored 0–100. Each bar is that input's sub-score; the figure is the points it added to the 100-point composite (weight × sub-score).
- Cash flow +10.5/30.0
- ARV discount +7.5/15.0
- Appreciation +6.9/10.0
- Livability +3.6/5.0
- 1% rule +3.1/10.0
- DSCR +3.0/10.0
- Rent growth +2.5/5.0
- Condition / age +2.5/5.0
- Schools +2.4/10.0
$160,000
🖨 Deal sheet (PDF) 📄 Offer letter ✓ Due diligence
Key facts
- 2,614 sq ft lot
- 2 garage spots
- Built 1979
Neighborhood map
What this means for you Summary
Snapshot
- This is a 2-bed/1.0-bath single-family listed at $160k.
Deal economics
- At list price, monthly cash flow is $-82 ($-986/yr) — negative.
- To cash-flow at today's rent, offer at most $145k (9.1% below list).
- To meet the 1% rule (rent ≥ 1% of price), the offer needs to be $129k (19.1% below list).
- Recommended offer: $129k (19.1% below list) — sets the bar for 1% rule.
- Cap rate 5.7% vs local median 12.5% in Shenandoah — below-typical yield; the buyer is paying a premium for something (appreciation thesis, condition, location) that the cap rate doesn't capture.
Location & tenants
- Location reads 71/100 on livability (#720 in PA) — a middle-class / working-renter tenant base. Strengths: amenities A+, cost of living A+, health & safety A+; Watch: commute F, employment F.
- Shenandoah Valley SD (town): math 20% / reading 38% proficiency, ranked #454 of 539 in PA (top 84%) — low school quality limits family demand, transient renter base, plan for 1-2y turnover; 66% free/reduced lunch — lower-income household profile, screen leases tightly.
- Zoned schools: Shenandoah Valley El Sch (math 21% / reading 41%, grade F, #1,116 of 1,518 statewide, top 74%, 667 students, 100% FRL); Shenandoah Valley Jshs (math 22% / reading 32%, grade F, #365 of 437 statewide, top 85%, 539 students, 96% FRL) — zoned schools average 98% FRL vs 66% district-wide (32 pts higher); higher-poverty schools than district average — tighter screening recommended.
- Market conditions: 63 active listings in the ZIP; 2 comparable units currently listed for rent nearby; 169 units permitted in Schuylkill County in 2024 (0 in 5+ unit buildings).
Forward outlook
- In year one you build about $7k of equity ($1k loan paydown + $6k appreciation (3.8% local appreciation)).
- Schuylkill County population projected at -16% by 2050 — secular population decline; favor cash flow + early exit over multi-decade hold.
- At projected returns (3.8% appreciation + 3.0% rent growth), your $45k cash investment doubles in ~6 years — after that, you're playing with house money.
- By year 5, paydown + projected appreciation supports a ~$31k cash-out refi (75% LTV) — recoverable capital for the next deal without selling this one.
Negotiation context
- It's been on market 223 days — a 12% lower offer ($141k) is reasonable based on typical stale-listing flexibility.
- 3 sale attempts; this cycle's ask has dropped $20k (11%) from the opening price — seller is motivated, your offer sets the floor, not the list.
- Current owner paid $125k; 28% above their basis — modest negotiation headroom, anchor on the comps not their cost.
Questions for the listing agent
- What do current leases actually rent for vs. the listed asking? Can we see a recent rent roll and the last 12 months of T-12 income?
- It's been on market 223 days. Have you received any prior offers? Is the seller open to a 19% concession, seller financing, or rate buy-down credit?
- Built in 1979 — when were the roof, HVAC, electrical panel, plumbing, and water heater last replaced?
- Why hasn't it sold? Are there any deal-killer items the seller is aware of (foundation, flood, title, zoning, code violations)?
- Is there a deadline driving the sale (1031 exchange, divorce, estate, relocation)? That informs how much negotiation room exists.
- Schools are D-rated, which usually means shorter tenancies and higher turnover. Who's the typical renter profile here, and what's been the actual vacancy rate?
- The area grade is low — what's the realistic commute time and amenity access for the typical tenant pool here? Any planned neighborhood developments (good or bad) we should know about?
- What's the average days-on-market for RENTAL listings here right now (not sales)? A rising rental-DOM trend means longer vacancies and softer asking-rent achievability than the comps imply.
- What's the recent tenant-quality profile in this submarket — average credit score on applications, eviction rate, late-payment / NSF rate, and stable-employment percentage? A property-management company in the area should have these aggregated.
- How much new for-sale + rental construction is in the pipeline within 1–3 miles? Heavy new supply typically softens prices + rents 12–24 months out; constrained supply supports both.
Investment metrics
- 1% rule
- 0.81% ✗
- Cap rate
- 5.68%
- Cash-on-cash
- -2.20%
- DSCR
- 0.90
- GRM
- 10.3
CMA / ARV
- ARV (on-the-fly)
- $49,392
- Comps found
- 4
Show comp detail 4 sales within ~0.75 mi
| Address | Dist | Beds/Ba | Sqft | Sold | Price | $/sf | Match |
|---|---|---|---|---|---|---|---|
| 330 W Poplar St | 0.19mi | 2/1.0 | 1,120 (+11%) | 11mo | $55,000 | $49 | 64 |
| 333 S West St | 0.12mi | 3/1.0 (+1) | 936 (-7%) | 21mo | $46,000 | $49 | 60 |
| 328 W Cherry St | 0.17mi | 2/1.0 | 884 (-12%) | 17mo | $55,000 | $62 | 57 |
| 326 Arlington St | 0.30mi | 3/1.0 (+1) | 1,140 (+13%) | 5mo | $42,500 | $37 | 55 |
Match score weights: distance 35% · size 25% · config 20% · recency 20%. Top-matched comps best support the ARV.
Projected returns pro-forma
3.84% appreciation · 3.0% rent growth · sell at horizon
- IRR
- 7.9%
- Equity multiple
- 1.48×
- Total profit
- $21,320
- Equity at exit
- $79,669
- IRR
- 10.2%
- Equity multiple
- 2.67×
- Total profit
- $74,621
- Equity at exit
- $129,159
Cash invested: $44,800 (down + closing). Projections, not guarantees.
Landlord ↔ Tenant lean methodology
- Overall (STATE)
- 62 Landlord-Friendly
- State Pennsylvania
- 62 Landlord-Friendly · EVEN
- County
- — inherits STATE
- City
- — inherits STATE
ZIP-level market 17976
- Home prices YoY
- 1.3%
- Active inventory
- 63
- Price-to-rent
- 10.3×
Monthly cashflow live
- Estimated rent
- $1,294 medium interval (Pro) →
- Mortgage (P&I)
- −$839
- Tax from tax record
- −$199 /mo · $2,388/yr
- Insurance
- −$67
- HOA
- −$0
- Vacancy / Maint / Mgmt
- −$272
- Net cashflow
- $-82
Break-even live
Sensitivity live
| Price | -10% $8 | -5% $-37 | +0% $-82 | +5% $-127 | +10% $-173 |
|---|---|---|---|---|---|
| Rent | -10% $-184 | -5% $-133 | +0% $-82 | +5% $-31 | +10% $20 |
| Rate | -1.0pp $-2 | -0.5pp $-42 | base $-82 | +0.5pp $-124 | +1.0pp $-166 |
UW: 25.0% down · 7.5% · 30yr · 1.5% tax · 5.0% vac · 8.0% maint · 8.0% mgmt
Financing live
Cash to close
- Down payment
- $40,000
- Closing costs
- $4,800
- Reserves months
- —
- Total cash needed
- —
Loan-product check · same deal, 3 products live
Conventional
25% down · 7.5% · 30yr
- Down + closing
- —
- Monthly P&I
- —
- Monthly cashflow
- —
- DSCR
- —
- Eligible?
- —
Personal DTI + credit; lowest rate.
DSCR
20% down · 8.5% · 30yr
- Down + closing
- —
- Monthly P&I
- —
- Monthly cashflow
- —
- DSCR
- —
- Eligible?
- —
No personal income docs; deal must DSCR.
Hard money
10% down · 12.0% · 12mo
- Down + closing
- —
- Monthly P&I
- —
- Monthly cashflow
- —
- DSCR
- —
- Eligible?
- —
Short-term bridge; refi at stabilization.
Rent comps 2 comps
| Address | Beds | Baths | Sqft | Rent | $/sqft | DOM | Units | Dist |
|---|---|---|---|---|---|---|---|---|
| 15 N Gilbert St Shenandoah, PA | 1.0 | 1.5 | 910 | $1,200 | $1.32 | 45d | 1 | 0.25mi |
| 230 W Arlington St Shenandoah, PA | 3.0 | 1.0 | 1143 | $1,400 | $1.22 | 45d | 1 | 0.27mi |
Listing history 12 events
-
2026-04-17status Pending
-
2026-04-14status Active
-
2026-04-07soldstatus $125,000
-
2026-03-01status Pending
-
2026-03-01status Active
-
2026-02-28historical
-
2025-11-28price $160,000
-
2025-09-24price $170,000
-
2025-07-23$180,000 Active
-
2025-07-17historical $180,000
-
2025-06-27soldstatus $125,000
-
2000-10-25soldstatus $75,000
ⓘ Source: listings_history table (triggers on properties + properties_extension) + one-shot
backfill from property_details.listing_events for pre-trigger history.
Tax reassessment forecast PA · Partial reset (capped growth)
- Current annual tax
- $2,388 · $199/mo
- Projected year-2 tax
- $2,458 · $205/mo
- Expected delta
- +$70/yr (+$6/mo · 2.9%)
ⓘ Screening estimate from a state-policy table — verify with the county assessor before closing.
Nearby sold comps map
Loading sold comps map…
Walkable amenities ~0.75 mi
Loading nearby amenities…
Taxation est. · year 1
- Rental income
- $15,531
- − Mortgage interest
- −$8,962
- − Property taxes
- −$2,388
- − Insurance
- −$800
- − Repairs & maintenance
- −$1,243
- − Management
- −$1,243
- − Depreciation
- −$4,655
- Taxable loss
- −$3,758
- Est. tax savings @ 24.0%
- +$902
- After-tax cash flow
- $-84/yr
For passive investors: Depreciation is non-cash, so a rental often shows a tax loss while cash-flowing — sheltering income. Rental losses are passive: they offset passive income freely, and up to $25,000/yr can offset ordinary (W-2) income if you actively participate and your MAGI is under $100k (phasing out to $0 by $150k); unused losses carry forward. On sale, claimed depreciation is recaptured at up to 25%, and gains may owe capital-gains tax (a 1031 exchange can defer both). Figures are a year-1 estimate at your 24.0% rate — not tax advice; consult a CPA.
Schools (NCES district)
- District
- Shenandoah Valley SD
- NCES district ID
- 4221490
- Math proficiency
- 20% ▼ -8.00%
- Reading proficiency
- 38% ▼ -6.00%
- Median HH income
- $31,968
- Composite
- 23.58/100
- National rank
- #7851
- State rank
- #454 of 539 in PA
Livability — Shenandoah
- Score
- 71/100
- State rank
- #720
- US rank
- #7134
Category grades
Schools grade is shown separately in the Schools card above.
Census & demographics
- Census place
- Shenandoah, PA
- City population
- 5,988
- Population (ZIP)
- 5,988
Population outlook (Schuylkill County) Hauer SSP2
- Today (2025)
- 137,447 people
- By 2030
- 133,121 · -3.1%
- By 2040
- 124,172 · -9.7%
- By 2050
- 115,611 · -15.9%
- By 2075
- 100,796 · -26.7%
- By 2100
- 86,667 · -36.9%
Race, ethnicity, and origin ACS 2023
- Neighborhood character
- Majority White (63%)
- Race & ethnicity
- White 63% Hispanic / Latino 34% Two or more races 12% Black 2%
- Hispanic origin (detail)
- Mexican 10% Puerto Rican 8% Dominican 11%
- Common ancestry
- Romanian 20% Iranian 2% Scotch-Irish 2%
- Foreign-born
- 10% · Canada
- Languages at home
- 68% English-only · Spanish 30% Russian/Polish/Slavic 1%
Political lean MEDSL · Schuylkill
- 2024 margin
- Solid R (+42.1) · D 28.5% · R 70.6%
- 2008→2024 swing
- -33.4pp toward R · 2008: -8.7pp · 2024: -42.1pp
- All cycles
- 2024: R+42.1 2020: R+39.9 2016: R+43.4 2012: R+13.4 2008: R+8.7
Not yet ingested
- Civics
- —
Market trends
- HPI YoY
- ▲ 3.84%
- Current HPI
- 308.8036
- Rent YoY
- —
- Metro
- —
- State GDP YoY
- ▲ 1.68%
- F500 in state
- 34
Industry mix (Fortune 500 HQ in PA)
| Industry | F500 HQs | Revenue |
|---|---|---|
| Healthcare | 2 | $309B |
|
||
| Insurance | 2 | $27B |
|
||
| Telecommunications / Media | 1 | $124B |
|
||
| Industrial Distribution | 1 | $22B |
|
||
| Financial Services | 1 | $20B |
|
||
| Chemicals / Materials | 1 | $18B |
|
||
Price history
+66.7% since first listed12 events — show timeline
- 2026-04-17 Pending — BRIGHT MLS
- 2026-04-14 Relisted — BRIGHT MLS
- 2026-04-07 Sold (Public Records) $125,000 Public Records
- 2026-03-01 Pending — BRIGHT MLS
- 2026-03-01 Relisted — BRIGHT MLS
- 2026-02-28 Listing Removed — BRIGHT MLS
- 2025-11-28 Price Changed $160,000 BRIGHT MLS
- 2025-09-24 Price Changed $170,000 BRIGHT MLS
- 2025-07-23 Listed $180,000 BRIGHT MLS
- 2025-07-17 Coming Soon $180,000 BRIGHT MLS
- 2025-06-27 Sold (Public Records) $125,000 Public Records
- 2000-10-25 Sold (Public Records) $75,000 Public Records
Property tax history
+1.1%/yrLatest (2025): $2,388 · +3.3% YoY. Source: county tax records.
Cash-flow waterfall
monthlySold comps — $/sqft
last 12 mo · ≤1 miLoading sold comps…