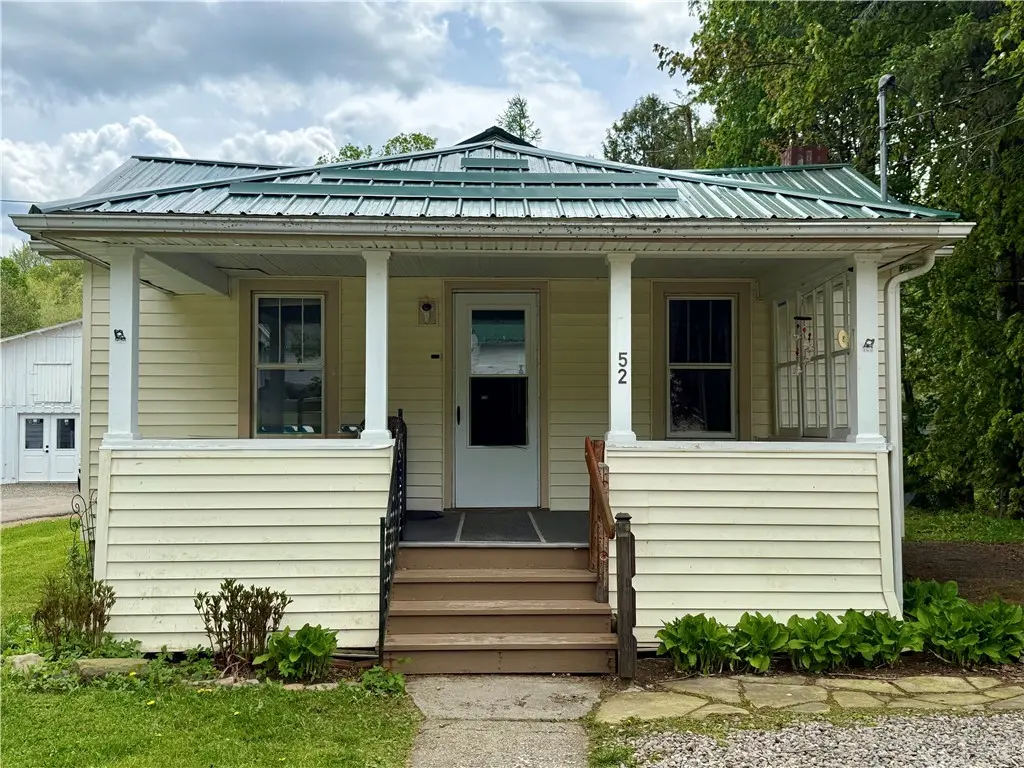
52 Dyke St · Andover, NY
Flood risk 1/10 · Minimal
- FEMA flood zone
- X (shaded)
- Chance of flooding over 30 yrs
- 0.0%
- Est. flood insurance / yr
- $473 – $860
Fire risk 3/10 · Minor
- Est. fire insurance / yr
- $691 – $1,283
Heat risk 1/10 · Minimal
- Hot days now (above 89°F)
- 7 days/yr
- Hot days in 30 yrs
- 18 days/yr
Wind risk 1/10 · Minimal
- Chance of severe wind over 30 yrs
- —
Air-quality risk 1/10 · Minimal
- Unhealthy air days now
- 0 days/yr
- Unhealthy air days in 30 yrs
- 0 days/yr
Risk factors via First Street. Map © Google.
Why this score? — see what drove the B grade
The composite is a weighted blend of 9 inputs, each scored 0–100. Each bar is that input's sub-score; the figure is the points it added to the 100-point composite (weight × sub-score).
- Cash flow +28.0/30.0
- DSCR +9.9/10.0
- 1% rule +8.5/10.0
- Appreciation +7.6/10.0
- ARV discount +7.5/15.0
- Schools +3.5/10.0
- Livability +3.2/5.0
- Rent growth +2.5/5.0
- Condition / age +2.5/5.0
$65,000
🖨 Deal sheet 📄 Offer letter ✓ Due diligence
Listing remarks
Charming and well maintained 2-bedroom, 1-bathroom home located on a quiet neighborhood street. This cozy property offers comfortable living with first floor bedrooms and laundry, as well as great curb appeal with vinyl siding and a new metal roof that's only 6 years old. Enjoy the sunshine and breeze on the covered front porch! Perfect opportunity for first-time home buyers looking to build equity or investors seeking a solid rental property. Conveniently located in the village close to local amenities. Move in ready and full of potential!
Key facts
- Covered front porch
- New metal roof
- First floor bedrooms
Tags
Property features AI
Exterior
- Parking: No garage
- Utilities: Electricity connected; Public water connected; Septic tank sewer
- Home design: Single-story property; Resale condition; Metal roof; Facing: Not specified
- Construction: Vinyl siding; Attic/crawl hatchway(s) insulated; Stone foundation; Existing construction
- Exterior features: Covered porch; Gravel driveway; Shed(s) / storage
Interior
- Kitchen: Gas oven; Gas range; Refrigerator
- Bedrooms: 2 main-level bedrooms
- Flooring: Carpet; Vinyl; Varied flooring
- Bathrooms: 1 full bathroom (main level)
- Heating & cooling: Has heating; Gas and electric heating; Forced-air heating; Hot water heating
- Interior features: Separate/formal living room; Galley kitchen; Country-style kitchen; Bedroom on main level; Partial basement
- Laundry & utility: Washer; Dryer; Main-level laundry
Neighborhood map
What this means for you Summary
Snapshot
- This is a 2-bed/1.0-bath single-family listed at $65k.
Deal economics
- At list price, monthly cash flow is $202 ($2k/yr) — positive.
- The deal already cash-flows at list — no discount required.
- Meets the 1% rule at list price ($874 rent vs $65k).
Location & tenants
- Location reads 65/100 on livability (#676 in NY) — a middle-class / working-renter tenant base. Strengths: cost of living A+, housing A+; Watch: schools C-, employment C-, health & safety D.
- Andover Central School District (rural): math 45% / reading 30% proficiency, ranked #667 of 755 in NY (top 88%) — families likely to look elsewhere, expect single-tenant / working-renter base with shorter leases.
- Market conditions: 15 active listings in the ZIP; 87 units permitted in Allegany County in 2024 (0 in 5+ unit buildings).
Forward outlook
- In year one you build about $4k of equity ($449 loan paydown + $3k appreciation (5.1% local appreciation)).
- Allegany County population projected at -26% by 2050 — secular population decline; favor cash flow + early exit over multi-decade hold.
- At projected returns (5.1% appreciation + 3.0% rent growth), your $18k cash investment doubles in ~3 years — after that, you're playing with house money.
- By year 9, paydown + projected appreciation supports a ~$33k cash-out refi (75% LTV) — recoverable capital for the next deal without selling this one.
Negotiation context
- Only 9 days on market — expect competitive offers; lowballing is unlikely to land.
Risks & watch-outs
- Watch-outs: built in 1939 — expect roof / HVAC / electrical / plumbing capex.
Questions for the listing agent
- Built in 1939 — when were the roof, HVAC, electrical panel, plumbing, and water heater last replaced?
- Is there a deadline driving the sale (1031 exchange, divorce, estate, relocation)? That informs how much negotiation room exists.
- Crime grade is F in this area — have there been break-ins, vandalism, or insurance claims at this property in the last 3 years? What carrier currently insures it and at what premium?
- What's the average days-on-market for RENTAL listings here right now (not sales)? A rising rental-DOM trend means longer vacancies and softer asking-rent achievability than the comps imply.
- What's the recent tenant-quality profile in this submarket — average credit score on applications, eviction rate, late-payment / NSF rate, and stable-employment percentage? A property-management company in the area should have these aggregated.
- How much new for-sale + rental construction is in the pipeline within 1–3 miles? Heavy new supply typically softens prices + rents 12–24 months out; constrained supply supports both.
Investment metrics
- 1% rule
- 1.35% ✓
- Cap rate
- 10.02%
- Cash-on-cash
- 13.30%
- DSCR
- 1.59
- GRM
- 6.2
CMA / ARV
No comps found within radius.
Projected returns pro-forma
5.11% appreciation · 3.0% rent growth · sell at horizon
- IRR
- 24.6%
- Equity multiple
- 2.55×
- Total profit
- $28,264
- Equity at exit
- $37,260
- IRR
- 23.8%
- Equity multiple
- 5.08×
- Total profit
- $74,237
- Equity at exit
- $64,660
Cash invested: $18,200 (down + closing). Projections, not guarantees.
Landlord ↔ Tenant lean methodology
- Overall (STATE)
- 15 Strongly Tenant-Friendly
- State New York
- 15 Strongly Tenant-Friendly · D+10
- County
- — inherits STATE
- City
- — inherits STATE
ZIP-level market 14806
- Home prices YoY
- 2.0%
- Active inventory
- 15
- Price-to-rent
- 6.2×
Monthly cashflow live
- Estimated rent
- $874 medium interval (Pro) →
- Mortgage (P&I)
- −$341
- Tax from tax record
- −$121 /mo · $1,454/yr
- Insurance
- −$27
- HOA
- −$0
- Vacancy / Maint / Mgmt
- −$184
- Net cashflow
- $202
Break-even live
UW: 25.0% down · 7.5% · 30yr · 1.5% tax · 5.0% vac · 8.0% maint · 8.0% mgmt
Financing live
Cash to close
- Down payment
- $16,250
- Closing costs
- $1,950
- Reserves months
- —
- Total cash needed
- —
Loan-product check · same deal, 3 products live
Conventional
25% down · 7.5% · 30yr
- Down + closing
- —
- Monthly P&I
- —
- Monthly cashflow
- —
- DSCR
- —
- Eligible?
- —
Personal DTI + credit; lowest rate.
DSCR
20% down · 8.5% · 30yr
- Down + closing
- —
- Monthly P&I
- —
- Monthly cashflow
- —
- DSCR
- —
- Eligible?
- —
No personal income docs; deal must DSCR.
Hard money
10% down · 12.0% · 12mo
- Down + closing
- —
- Monthly P&I
- —
- Monthly cashflow
- —
- DSCR
- —
- Eligible?
- —
Short-term bridge; refi at stabilization.
Listing history 2 events
-
2026-05-21historical Active Under Contract
-
2026-05-19$65,000 Active
ⓘ Source: listings_history table (triggers on properties + properties_extension) + one-shot
backfill from property_details.listing_events for pre-trigger history.
Tax reassessment forecast NY · Partial reset (capped growth)
- Current annual tax
- $1,454 · $121/mo
- Projected year-2 tax
- $1,454 · $121/mo
- Expected delta
- $0/yr ($0/mo · 0.0%)
ⓘ Screening estimate from a state-policy table — verify with the county assessor before closing.
Climate risk First Street
- Flood 1/10 Low FEMA zone X (shaded) · 0% chance over 30 yrs
- Wildfire 3/10 Moderate
- Heat 1/10 Low 7 d/yr ≥89°F today · 18 d/yr by 30 yrs out
- Wind 1/10 Low
- Air quality 1/10 Low 0 unhealthy d/yr today · 0 by 30 yrs out
Nearby sold comps map
Loading sold comps map…
Walkable amenities ~0.75 mi
Loading nearby amenities…
Taxation est. · year 1
- Rental income
- $10,494
- − Mortgage interest
- −$3,641
- − Property taxes
- −$1,454
- − Insurance
- −$325
- − Repairs & maintenance
- −$839
- − Management
- −$839
- − Depreciation
- −$1,891
- Taxable income
- $1,503
- Est. tax owed @ 24.0%
- −$361
- After-tax cash flow
- $2,059/yr
For passive investors: Depreciation is non-cash, so a rental often shows a tax loss while cash-flowing — sheltering income. Rental losses are passive: they offset passive income freely, and up to $25,000/yr can offset ordinary (W-2) income if you actively participate and your MAGI is under $100k (phasing out to $0 by $150k); unused losses carry forward. On sale, claimed depreciation is recaptured at up to 25%, and gains may owe capital-gains tax (a 1031 exchange can defer both). Figures are a year-1 estimate at your 24.0% rate — not tax advice; consult a CPA.
Schools (NCES district)
- District
- Andover Central School District
- NCES district ID
- 3603030
- Math proficiency
- 45% ▲ 5.00%
- Reading proficiency
- 30% ▼ -5.00%
- Median HH income
- $48,098
- Composite
- 34.8/100
- National rank
- #10022
- State rank
- #667 of 755 in NY
Livability — Andover
- Score
- 65/100
- State rank
- #676
- US rank
- #12685
Category grades
Schools grade is shown separately in the Schools card above.
Census & demographics
- Census place
- Andover, NY
- City population
- 2,131
- Population (ZIP)
- 2,131
Population outlook (Allegany County) Hauer SSP2
- Today (2025)
- 45,362 people
- By 2030
- 43,078 · -5.0%
- By 2040
- 38,031 · -16.2%
- By 2050
- 33,634 · -25.9%
- By 2075
- 25,285 · -44.3%
- By 2100
- 18,902 · -58.3%
Race, ethnicity, and origin ACS 2023
- Neighborhood character
- Predominantly White (98%)
- Race & ethnicity
- White 98% Two or more races 2%
- Common ancestry
- Iranian 2% Slovak 1% Lithuanian 1%
- Foreign-born
- 0% · China
- Languages at home
- 99% English-only · Spanish 1%
Political lean MEDSL · Allegany
- 2024 margin
- Solid R (+43.2) · D 28.4% · R 71.6%
- 2008→2024 swing
- -21.5pp toward R · 2008: -21.7pp · 2024: -43.2pp
- All cycles
- 2024: R+43.2 2020: R+38.9 2016: R+42.3 2012: R+25.3 2008: R+21.7
Not yet ingested
- Civics
- —
Market trends
- HPI YoY
- ▲ 5.11%
- Current HPI
- 257.4957
- Rent YoY
- —
- Metro
- —
- State GDP YoY
- ▲ 2.60%
- F500 in state
- 92
Industry mix (Fortune 500 HQ in NY)
| Industry | F500 HQs | Revenue |
|---|---|---|
| Financial Services | 10 | $950B |
|
||
| Consumer Goods | 9 | $162B |
|
||
| Insurance | 4 | $225B |
|
||
| Telecommunications | 2 | $144B |
|
||
| Pharmaceuticals | 2 | $112B |
|
||
| Media / Entertainment | 2 | $69B |
|
||
Price history
2 events — show timeline
- 2026-05-21 Contingent — UNYREIS
- 2026-05-19 Listed $65,000 UNYREIS
Property tax history
+7.1%/yrLatest (2025): $1,454 · -6.2% YoY. Source: county tax records.
Cash-flow waterfall
monthlySold comps — $/sqft
last 12 mo · ≤1 miLoading sold comps…