 Multi-family
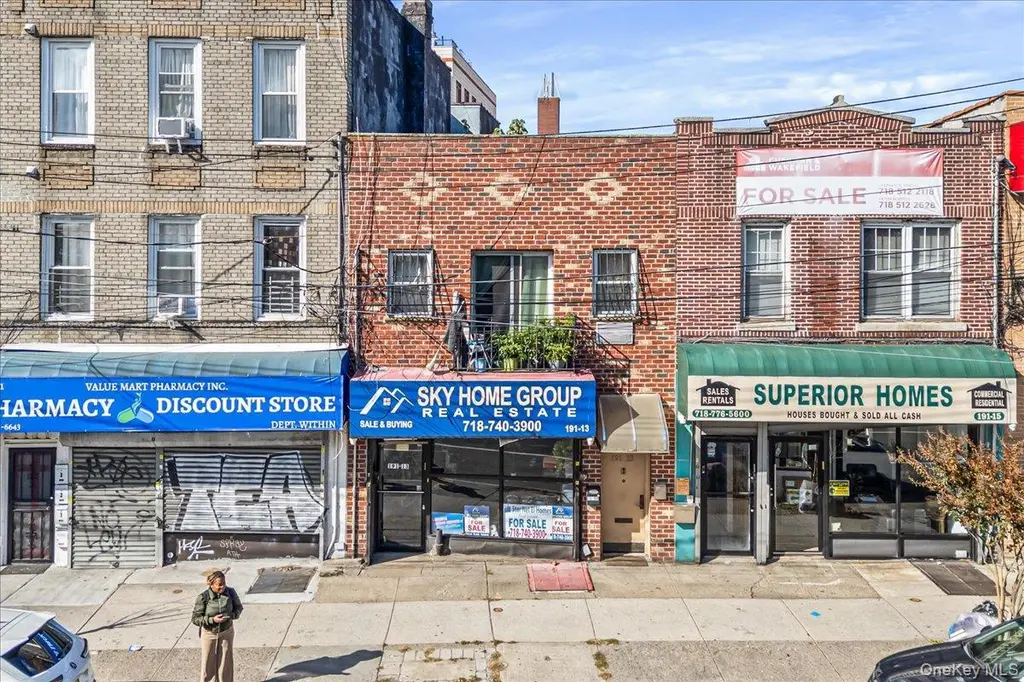
191-13 Jamaica Ave · New York, NY
Flood risk No data
- FEMA flood zone
- —
- Chance of flooding over 30 yrs
- —
- Est. flood insurance / yr
- —
Fire risk No data
- Est. fire insurance / yr
- —
Heat risk No data
- Hot days now (above threshold)
- —
- Hot days in 30 yrs
- —
Wind risk No data
- Chance of severe wind over 30 yrs
- —
Air-quality risk No data
- Unhealthy air days now
- —
- Unhealthy air days in 30 yrs
- —
Risk factors via First Street. Map © Google.
Why this score? — see what drove the D- grade
The composite is a weighted blend of 9 inputs, each scored 0–100. Each bar is that input's sub-score; the figure is the points it added to the 100-point composite (weight × sub-score).
- Cash flow +11.5/30.0
- ARV discount +7.5/15.0
- Schools +5.0/10.0
- Livability +3.8/5.0
- DSCR +3.4/10.0
- 1% rule +3.3/10.0
- Rent growth +2.5/5.0
- Condition / age +1.0/5.0
- Appreciation +0.0/10.0
$1,200,000
🖨 Deal sheet (PDF) 📄 Offer letter ✓ Due diligence
Multi-family units
County records classify this as Multi-Family (2-4 Unit). Listing-text estimate: 1 unit. estimate disagrees with records
Listing remarks
Excellent mixed-use property (Block/Lot: 10447/0043), selling as a package deal with 2 additional lots (Block/Lot: 10447/0040 & 0140) on the back. Located right on Jamaica Avenue, Hollis, features 2-story mixed-use with a 775 sqft retail store on the front, One 1-bedroom unit on the rear, two 1-bedroom units on the 2nd floor, and a finished basement for storage purposes. The second lot (0040) has entrance from the 192nd street, 12.43ftx82ft, 1145 sqft, R5, C1-2 zoning, could be use for garage/warehouse/studio/commercial space. The third lot (0140) 14ftx19ft, 266 sqft, R5, C1-2 zoning, could be used for storage. The property is in well-kept condition. Close to bus, LIRR, shops and othe
Key facts
- Built 1997
- Listed 36 days
Property features AI
Exterior
- Parking: No carport; Other parking features
- Utilities: Public sewer; Electricity available; Natural gas available; Water available; Sewer available
- Home design: Duplex
- Construction: Brick and frame construction
- Exterior features: Brick and frame construction; Not waterfront
Interior
- Kitchen: Eat-in kitchen(s)
- Bedrooms: Three 1-bedroom units
- Bathrooms: Three full bathrooms
- Heating & cooling: Natural gas heating; No central cooling
- Interior features: First floor bedroom; First floor full bathroom; Eat-in kitchen; Finished basement with storage space; No attic
Neighborhood map
What this means for you Summary
Snapshot
- This is a 3-bed/3.0-bath multifamily listed at $1.20M. Condition is rated poor.
Deal economics
- At list price, monthly cash flow is $-396 ($-5k/yr) — negative.
- To cash-flow at today's rent, offer at most $1.14M (4.8% below list).
- To meet the 1% rule (rent ≥ 1% of price), the offer needs to be $1000k (16.7% below list).
- Recommended offer: $1000k (16.7% below list) — sets the bar for 1% rule.
- Cap rate 5.9% vs local median 2.6% in New York — top-decile yield for the area; either an underpriced asset or a hidden risk that comps aren't pricing in. Stress-test before assuming the spread holds.
Location & tenants
- Location reads 75/100 on livability (#268 in NY, #4,188 nationally) — a middle-class / working-renter tenant base. Strengths: amenities A+, commute A+, health & safety A; Watch: crime F, cost of living F.
- Market conditions: 119 active listings in the ZIP; 10 comparable units currently listed for rent nearby; rentals at typical pace (median 25d on market — plan ~3-4 weeks tenant-placement turnaround); 5,302 units permitted in Queens County in 2024 (4,918 in 5+ unit buildings).
Forward outlook
- Local home prices are declining (-3.0%/yr); year-one equity from $8k of loan paydown is wiped out by about $36k of value loss. Plan a longer hold.
- Queens County population projected at +16% by 2050 — long-run rental-demand tailwind backs the buy-and-hold thesis.
Negotiation context
- It's been on market 36 days — a 3% lower offer ($1.16M) is reasonable based on typical stale-listing flexibility.
- 2 sale attempts with the ask held roughly flat each time — persistent listings suggest the price (not the market) is what's stuck; bring a comps-based counter.
Questions for the listing agent
- What do current leases actually rent for vs. the listed asking? Can we see a recent rent roll and the last 12 months of T-12 income?
- It's been on market 36 days. Have you received any prior offers? Is the seller open to a 17% concession, seller financing, or rate buy-down credit?
- Have any recent inspections been done? Can we get a copy of the seller's disclosures and any deferred-maintenance estimates?
- Is there a deadline driving the sale (1031 exchange, divorce, estate, relocation)? That informs how much negotiation room exists.
- Schools are B-rated — typically a magnet for longer-tenancy family renters. What's the average tenant stay here, and is there a school-zone premium baked into asking?
- Crime grade is F in this area — have there been break-ins, vandalism, or insurance claims at this property in the last 3 years? What carrier currently insures it and at what premium?
- The area grade is low — what's the realistic commute time and amenity access for the typical tenant pool here? Any planned neighborhood developments (good or bad) we should know about?
- What's the average days-on-market for RENTAL listings here right now (not sales)? A rising rental-DOM trend means longer vacancies and softer asking-rent achievability than the comps imply.
- What's the recent tenant-quality profile in this submarket — average credit score on applications, eviction rate, late-payment / NSF rate, and stable-employment percentage? A property-management company in the area should have these aggregated.
- How much new apartment / multifamily construction is in the pipeline within 1–3 miles? Heavy new supply (>2% of stock underway) typically softens rents 12–24 months out; light construction supports rent growth.
Investment metrics
- 1% rule
- 0.83% ✗
- Cap rate
- 5.90%
- Cash-on-cash
- -1.41%
- DSCR
- 0.94
- GRM
- 10.0
CMA / ARV
No comps found within radius.
Projected returns pro-forma
-3.0% appreciation · 3.0% rent growth · sell at horizon
- IRR
- -18.6%
- Equity multiple
- 0.35×
- Total profit
- $-219,528
- Equity at exit
- $178,924
- IRR
- -11.0%
- Equity multiple
- 0.34×
- Total profit
- $-223,032
- Equity at exit
- $103,754
Cash invested: $336,000 (down + closing). Projections, not guarantees.
Landlord ↔ Tenant lean methodology
- Overall (CITY)
- 0 Strongly Tenant-Friendly
- State New York
- 15 Strongly Tenant-Friendly · D+10
- County
- — inherits STATE
- City New York
- 0 Strongly Tenant-Friendly · D+34
ZIP-level market 11423
- Active inventory
- 119
- Price-to-rent
- 40.0×
Monthly cashflow live
- Estimated rent
- $9,996 high interval (Pro) →
- Mortgage (P&I)
- −$6,293
- Tax est. 1.5%
- −$1,500 /mo · $18,000/yr
- Insurance
- −$500
- HOA
- −$0
- Vacancy / Maint / Mgmt
- −$2,099
- Net cashflow
- $-396
Break-even live
Sensitivity live
| Price | -10% $433 | -5% $19 | +0% $-396 | +5% $-811 | +10% $-1,225 |
|---|---|---|---|---|---|
| Rent | -10% $-1,186 | -5% $-791 | +0% $-396 | +5% $-1 | +10% $394 |
| Rate | -1.0pp $208 | -0.5pp $-91 | base $-396 | +0.5pp $-707 | +1.0pp $-1,023 |
4-unit breakdown (identical units grouped — click to expand)
| Units | Beds | Baths | Est. rent |
|---|---|---|---|
| 4× units | 1 | 1 | $9,996 |
| #1 | 1 | 1 | $2,499 |
| #2 | 1 | 1 | $2,499 |
| #3 | 1 | 1 | $2,499 |
| #4 | 1 | 1 | $2,499 |
| Total (4 units) | $9,996 | ||
UW: 25.0% down · 7.5% · 30yr · 1.5% tax · 5.0% vac · 8.0% maint · 8.0% mgmt
Financing live
Cash to close
- Down payment
- $300,000
- Closing costs
- $36,000
- Reserves months
- —
- Total cash needed
- —
Loan-product check · same deal, 3 products live
Conventional
25% down · 7.5% · 30yr
- Down + closing
- —
- Monthly P&I
- —
- Monthly cashflow
- —
- DSCR
- —
- Eligible?
- —
Personal DTI + credit; lowest rate.
DSCR
20% down · 8.5% · 30yr
- Down + closing
- —
- Monthly P&I
- —
- Monthly cashflow
- —
- DSCR
- —
- Eligible?
- —
No personal income docs; deal must DSCR.
Hard money
10% down · 12.0% · 12mo
- Down + closing
- —
- Monthly P&I
- —
- Monthly cashflow
- —
- DSCR
- —
- Eligible?
- —
Short-term bridge; refi at stabilization.
Rent comps 10 comps
| Address | Beds | Baths | Sqft | Rent | $/sqft | DOM | Units | Dist |
|---|---|---|---|---|---|---|---|---|
| 19512 100th Ave Hollis, NY | 2.0 | 1.0 | 1980 | $2,700 | $1.36 | 19d | 1 | 0.35mi |
| 8679 Palo Alto St Hollis, NY | 4.0 | 3.0 | 2310 | $5,500 | $2.38 | 25d | 1 | 0.48mi |
| 10031 200th St Hollis, NY | 3.0 | 2.0 | 2691 | $3,000 | $1.11 | 5d | 1 | 0.53mi |
| 9050 Francis Lewis Blvd Queens Village, NY | 3.0 | 1.5 | 2396 | $3,000 | $1.25 | 5d | 1 | 0.65mi |
| 89-28 207th St Unit 2 Jamaica, NY | 2.0 | 1.0 | 3330 | $2,600 | $0.78 | 25d | 1 | 0.71mi |
| 18015 Dalny Rd Jamaica, NY | 3.0 | 3.5 | 2112 | $5,000 | $2.37 | 24d | 1 | 0.85mi |
| 205-11 Hollis Ave Unit 2nd Queens, NY | 3.0 | 1.0 | 2020 | $3,777 | $1.87 | 25d | 1 | 0.90mi |
| 211-57 Jamaica Ave Unit 2F Jamaica, NY | 2.0 | 1.0 | 2520 | $2,650 | $1.05 | 25d | 1 | 1.09mi |
| 18620 Troon Rd Jamaica, NY | 4.0 | 3.5 | 2528 | $6,000 | $2.37 | 15d | 1 | 1.16mi |
| 16847 93rd Ave Jamaica, NY | 3.0 | 1.5 | 1948 | $2,900 | $1.49 | 25d | 1 | 1.26mi |
Listing history 16 events
-
2026-06-18days on market $1,200,000 Active 36 DOM
-
2026-06-17days on market $1,200,000 Active 35 DOM
-
2026-06-16days on market $1,200,000 Active 34 DOM
-
2026-06-15days on market $1,200,000 Active 33 DOM
-
2026-06-13days on market $1,200,000 Active 31 DOM
-
2026-06-10days on market $1,200,000 Active 27 DOM
-
2026-06-08days on market $1,200,000 Active 26 DOM
-
2026-06-08days on market $1,200,000 Active 25 DOM
-
2026-06-04days on market $1,200,000 Active 22 DOM
-
2026-06-03days on market $1,200,000 Active 21 DOM
-
2026-06-02days on market $1,200,000 Active 20 DOM
-
2026-06-01days on market $1,200,000 Active 19 DOM
-
2026-05-31days on market $1,200,000 Active 18 DOM
-
2026-05-13$1,200,000 Active
-
2025-10-22price $1,400,000
-
2025-07-17$1,599,999 Active
ⓘ Source: listings_history table (triggers on properties + properties_extension) + one-shot
backfill from property_details.listing_events for pre-trigger history.
Nearby sold comps map
Loading sold comps map…
Walkable amenities ~0.75 mi
Loading nearby amenities…
Taxation est. · year 1
- Rental income
- $119,952
- − Mortgage interest
- −$67,219
- − Property taxes
- −$18,000
- − Insurance
- −$6,000
- − Repairs & maintenance
- −$9,596
- − Management
- −$9,596
- − Depreciation
- −$34,909
- Taxable loss
- −$25,368
- Est. tax savings @ 24.0%
- +$6,088
- After-tax cash flow
- $1,335/yr
For passive investors: Depreciation is non-cash, so a rental often shows a tax loss while cash-flowing — sheltering income. Rental losses are passive: they offset passive income freely, and up to $25,000/yr can offset ordinary (W-2) income if you actively participate and your MAGI is under $100k (phasing out to $0 by $150k); unused losses carry forward. On sale, claimed depreciation is recaptured at up to 25%, and gains may owe capital-gains tax (a 1031 exchange can defer both). Figures are a year-1 estimate at your 24.0% rate — not tax advice; consult a CPA.
Condition & rehab AI · 11 photos
This property requires extensive repairs and maintenance, including roof replacement, exterior wall repairs, and flooring and interior updates. Significant value can be added through these improvements, enhancing both resale and rental potential.
Repairs flagged
- Major roof — Significant damage and wear
- Major exterior walls — Significant cracks and discoloration
- Major flooring — Visible wear and tear
- Major interior walls/paint — Peeling paint and discoloration
- Major HVAC/mechanicals — No visible signs, likely in poor condition
Value-add opportunities
- Both roof replacement — Critical to the structural integrity and appearance of the property
- Both exterior wall repairs — Improves appearance and structural integrity
- Both flooring replacement — Improves appearance and functionality
- Both painting and interior repairs — Improves appearance and functionality
- Both HVAC/mechanical upgrades — Improves comfort and energy efficiency
- Both landscaping and curb appeal — Improves overall appearance and appeal
Renovation cost estimate screening
| Repair item | Severity | Est. cost |
|---|---|---|
| roof · Significant damage and wear | Major | $15,000–50,000 |
| exterior walls · Significant cracks and discoloration | Major | $15,000–50,000 |
| flooring · Visible wear and tear | Major | $15,000–50,000 |
| interior walls/paint · Peeling paint and discoloration | Major | $15,000–50,000 |
| HVAC/mechanicals · No visible signs, likely in poor condition | Major | $15,000–50,000 |
| Total estimated repair cost · 5 items | $75,000–250,000 |
Value-add ROI direction
- Both roof replacement — Critical to the structural integrity and appearance of the property ↑
- Both exterior wall repairs — Improves appearance and structural integrity ↑
- Both flooring replacement — Improves appearance and functionality ↑
- Both painting and interior repairs — Improves appearance and functionality ↑
- Both HVAC/mechanical upgrades — Improves comfort and energy efficiency ↑
- Both landscaping and curb appeal — Improves overall appearance and appeal ↑
ⓘ Cost ranges are severity-bucket heuristics (US national rule-of-thumb). Get contractor quotes + a written scope before underwriting a rehab budget.
Schools (NCES district)
No district data.
Livability — New York
- Score
- 75/100
- State rank
- #268
- US rank
- #4188
Category grades
Schools grade is shown separately in the Schools card above.
Census & demographics
- Census place
- New York, NY
- City population
- 7,731,280
- Population (ZIP)
- 29,105
Population outlook (Queens County) Hauer SSP2
- Today (2025)
- 2,546,320 people
- By 2030
- 2,643,059 · +3.8%
- By 2040
- 2,815,563 · +10.6%
- By 2050
- 2,944,423 · +15.6%
- By 2075
- 3,123,338 · +22.7%
- By 2100
- 3,098,688 · +21.7%
Race, ethnicity, and origin ACS 2023
- Neighborhood character
- Highly diverse neighborhood (Simpson 0.76)
- Race & ethnicity
- Black 34% Asian 31% Hispanic / Latino 15% White 10% Two or more races 8%
- Hispanic origin (detail)
- Puerto Rican 2% Dominican 4%
- Common ancestry
- Hispanic 5% Danish 1% Scotch-Irish 1%
- Foreign-born
- 55% · Canada, China, Jamaica
- Languages at home
- 57% English-only · Other Indo-European 14% Spanish 14% French/Haitian/Cajun 6%
Political lean MEDSL · Queens
- 2024 margin
- Strong D (+24.6) · D 62.3% · R 37.7%
- 2008→2024 swing
- -26.2pp toward R · 2008: 50.8pp · 2024: 24.6pp
- All cycles
- 2024: D+24.6 2020: D+45.2 2016: D+53.4 2012: D+58.5 2008: D+50.8
Not yet ingested
- Civics
- —
Market trends
- HPI YoY
- ▼ -490.74%
- Current HPI
- 273.0152
- Rent YoY
- —
- Metro
- —
- State GDP YoY
- ▲ 2.60%
- F500 in state
- 92
Industry mix (Fortune 500 HQ in NY)
| Industry | F500 HQs | Revenue |
|---|---|---|
| Financial Services | 10 | $950B |
|
||
| Consumer Goods | 9 | $162B |
|
||
| Insurance | 4 | $225B |
|
||
| Telecommunications | 2 | $144B |
|
||
| Pharmaceuticals | 2 | $112B |
|
||
| Media / Entertainment | 2 | $69B |
|
||
Price history
-25.0% since first listed3 events — show timeline
- 2026-05-13 Listed $1,200,000 OneKey® MLS as Distributed by MLS Grid
- 2025-10-22 Price Changed $1,400,000 OneKey® MLS as Distributed by MLS Grid
- 2025-07-17 Listed $1,599,999 OneKey® MLS as Distributed by MLS Grid
Cash-flow waterfall
monthlySold comps — $/sqft
last 12 mo · ≤1 miLoading sold comps…