1231 W 7th St · Freeport, TX
Flood risk 8/10 · Major
- FEMA flood zone
- X (unshaded)
- Chance of flooding over 30 yrs
- 0.75%
- Est. flood insurance / yr
- $507 – $1,088
Fire risk 5/10 · Moderate
- Est. fire insurance / yr
- $1,222 – $2,270
Heat risk 10/10 · Severe
- Hot days now (above 113°F)
- 7 days/yr
- Hot days in 30 yrs
- 25 days/yr
Wind risk 9/10 · Severe
- Chance of severe wind over 30 yrs
- 99.0%
Air-quality risk 3/10 · Minor
- Unhealthy air days now
- 2 days/yr
- Unhealthy air days in 30 yrs
- 2 days/yr
Risk factors via First Street. Map © Google.
Why this score? — see what drove the B+ grade
The composite is a weighted blend of 9 inputs, each scored 0–100. Each bar is that input's sub-score; the figure is the points it added to the 100-point composite (weight × sub-score).
- Cash flow +30.0/30.0
- ARV discount +15.0/15.0
- 1% rule +10.0/10.0
- DSCR +10.0/10.0
- Schools +3.7/10.0
- Livability +2.9/5.0
- Rent growth +2.5/5.0
- Condition / age +2.5/5.0
- Appreciation +0.0/10.0
$100,000
🖨 Deal sheet (PDF) 📄 Offer letter ✓ Due diligence
Listing remarks
Calling all investors, flippers, and buy-and-hold buyers! Don’t miss your chance to own this property located at 1231 W 7th St, Freeport, TX 77541. This home has strong potential for rental income, renovation, or your next investment project. Located in an established area with easy access to local plants, industry jobs, schools, shopping, and the coast, this property offers an excellent opportunity to add value and build equity. Whether you’re looking for your next fix-and-flip, rental property, or long-term investment, this one is worth a look! 1231 W 7th St, Freeport, TX 77541 Contact Candice McClintock with eXp Realty for more information or to schedule a showing.
Key facts
- 7,000 sq ft lot
- Built 1942
- Listed 47 days
Property features AI
Exterior
- Utilities: Public water; Public sewer
- Home design: Residential property; Built in 1942; Slab foundation; Composition roof
- Construction: Wood siding construction
- Exterior features: Fully fenced yard; Back yard fence
Interior
- Kitchen: Dishwasher
- Bedrooms: Primary bedroom on the first floor (approx. 10 x 10); Bedroom on the first floor (approx. 10 x 18); Bedroom on the first floor (approx. 10 x 12); Bedroom on the first floor (approx. 10 x 11)
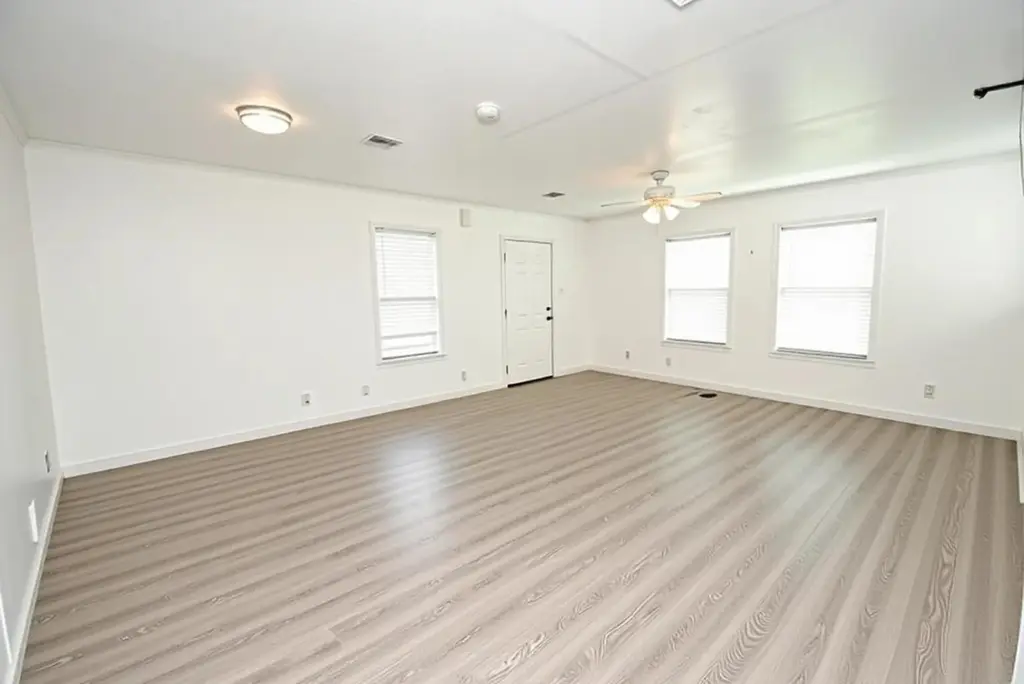
- Flooring: Plank; Tile; Vinyl
- Bathrooms: 1 full bathroom
- Heating & cooling: Central heating (gas); Central air (electric)
- Interior features: Seller disclosure available
- Laundry & utility: Electric dryer hookup
Neighborhood map
What this means for you Summary
Snapshot
- This is a 4-bed/1.0-bath single-family listed at $100k.
Deal economics
- At list price, monthly cash flow is $331 ($4k/yr) — positive.
- The deal already cash-flows at list — no discount required.
- Meets the 1% rule at list price ($2k rent vs $100k).
- Recommended offer: $97k (3.0% below list) — sets the bar for market timing.
- Cap rate 11.1% vs local median 4.1% in Freeport — top-decile yield for the area; either an underpriced asset or a hidden risk that comps aren't pricing in. Stress-test before assuming the spread holds.
Location & tenants
- Location reads 58/100 on livability (#1,205 in TX) — a working-class tenant base; expect higher turnover. Strengths: cost of living A+, housing A+; Watch: crime D, amenities F, commute F.
- Brazosport ISD (suburban): math 43% / reading 41% proficiency, ranked #305 of 826 in TX (top 37%) — families likely to look elsewhere, expect single-tenant / working-renter base with shorter leases.
- Zoned schools: Freeport El (579 students, 89% FRL); O'Hara Lanier Middle (math 41% / reading 29%, grade F, #842 of 1,662 statewide, top 51%, 340 students, 92% FRL); Brazosport H S (math 40% / reading 27%, grade F, #1,011 of 1,632 statewide, top 63%, 948 students, 78% FRL) — zoned schools average 86% FRL vs 53% district-wide (33 pts higher); higher-poverty schools than district average — tighter screening recommended.
- Market conditions: 593 active listings in the ZIP; 4 comparable units currently listed for rent nearby; rentals lingering (median 46d on market — plan ~5-8 weeks vacancy on turnover, expect pricing pressure); 100% of comp listings sitting > 30 days — soft ceiling on asking rent; 3,960 units permitted in Brazoria County in 2024 (593 in 5+ unit buildings).
Forward outlook
- Local home prices are declining (-3.0%/yr); year-one equity from $691 of loan paydown is wiped out by about $3k of value loss. Plan a longer hold.
- Brazoria County population projected at +44% by 2050 — long-run rental-demand tailwind backs the buy-and-hold thesis.
- At projected returns (-3.0% appreciation + 3.0% rent growth), your $28k cash investment doubles in ~9 years — after that, you're playing with house money.
Negotiation context
- It's been on market 48 days — a 3% lower offer ($97k) is reasonable based on typical stale-listing flexibility.
- 2 sale attempts; this cycle's ask has dropped $16k (14%) from the opening price — seller is motivated, your offer sets the floor, not the list.
Risks & watch-outs
- Watch-outs: property tax is 2.8% of price; flood insurance adds $66/mo; built in 1942 — expect roof / HVAC / electrical / plumbing capex.
- Climate carrying-cost: severe flood risk; severe wind risk, 99% chance of damaging wind over 30y; moderate wildfire risk; extreme-heat days projected 7→25/yr by 2055 (HVAC capex compounding) — expect insurance premiums to compound above CPI over the hold.
Questions for the listing agent
- It's been on market 48 days. Have you received any prior offers? Is the seller open to a 3% concession, seller financing, or rate buy-down credit?
- Built in 1942 — when were the roof, HVAC, electrical panel, plumbing, and water heater last replaced?
- Property tax is high relative to price — has the assessment been appealed recently, and will the sale trigger a re-assessment?
- What's the actual annual flood-insurance premium (NFIP or private), and is the property in a SFHA with mandatory coverage?
- Is there a deadline driving the sale (1031 exchange, divorce, estate, relocation)? That informs how much negotiation room exists.
- Schools are F-rated, which usually means shorter tenancies and higher turnover. Who's the typical renter profile here, and what's been the actual vacancy rate?
- Crime grade is D in this area — have there been break-ins, vandalism, or insurance claims at this property in the last 3 years? What carrier currently insures it and at what premium?
- What's the average days-on-market for RENTAL listings here right now (not sales)? A rising rental-DOM trend means longer vacancies and softer asking-rent achievability than the comps imply.
- What's the recent tenant-quality profile in this submarket — average credit score on applications, eviction rate, late-payment / NSF rate, and stable-employment percentage? A property-management company in the area should have these aggregated.
- How much new for-sale + rental construction is in the pipeline within 1–3 miles? Heavy new supply typically softens prices + rents 12–24 months out; constrained supply supports both.
Investment metrics
- 1% rule
- 1.51% ✓
- Cap rate
- 11.06%
- Cash-on-cash
- 17.04%
- DSCR
- 1.76
- GRM
- 5.5
CMA / ARV
- ARV (median comp)
- $142,472
- List price
- $100,000
- Delta
- -29.81%
- Verdict
- UNDERPRICED
- Comps
- 20 within 1.0 mi
Show comp detail 12 sales within ~0.75 mi
| Address | Dist | Beds/Ba | Sqft | Sold | Price | $/sf | Match |
|---|---|---|---|---|---|---|---|
| 1530 W 10th St | 0.31mi | 4/2.0 | 1,453 (+1%) | 1mo | $184,900 | $127 | 79 |
| 1427 W 7th St | 0.17mi | 3/2.0 (-1) | 1,368 (-5%) | 1mo | $145,000 | $106 | 74 |
| 1118 W 11th St | 0.23mi | 4/2.0 | 1,520 (+6%) | 4mo | $178,000 | $117 | 72 |
| 923 W 9th St | 0.30mi | 3/2.0 (-1) | 1,391 (-3%) | 4mo | $197,495 | $142 | 68 |
| 922 W 11th St | 0.34mi | 3/2.0 (-1) | 1,383 (-4%) | 8mo | $149,900 | $108 | 62 |
| 706 W 7th St | 0.49mi | 4/2.0 | 1,380 (-4%) | 6mo | $105,000 | $76 | 61 |
| 606 W 6th St | 0.59mi | 3/2.0 (-1) | 1,458 (+1%) | 2mo | $99,900 | $69 | 60 |
| 1502 W 11th St | 0.30mi | 3/2.0 (-1) | 1,293 (-10%) | 5mo | $179,999 | $139 | 56 |
| 631 W 8th St | 0.53mi | 4/2.5 | 1,581 (+10%) | 8mo | $234,900 | $149 | 46 |
| 1607 W 11th St | 0.40mi | 3/2.0 (-1) | 1,635 (+14%) | 5mo | $199,000 | $122 | 46 |
| 529 W 4th St | 0.65mi | 3/2.0 (-1) | 1,292 (-10%) | 5mo | $194,900 | $151 | 40 |
| 522 W Broad St | 0.70mi | 3/2.0 (-1) | 1,250 (-13%) | 10mo | $177,500 | $142 | 28 |
Match score weights: distance 35% · size 25% · config 20% · recency 20%. Top-matched comps best support the ARV.
Projected returns pro-forma
-3.0% appreciation · 3.0% rent growth · sell at horizon
- IRR
- 4.6%
- Equity multiple
- 1.18×
- Total profit
- $5,017
- Equity at exit
- $14,910
- IRR
- 14.2%
- Equity multiple
- 2.14×
- Total profit
- $32,051
- Equity at exit
- $8,646
Cash invested: $28,000 (down + closing). Projections, not guarantees.
Landlord ↔ Tenant lean methodology
- Overall (STATE)
- 87 Strongly Landlord-Friendly
- State Texas
- 87 Strongly Landlord-Friendly · R+5
- County
- — inherits STATE
- City
- — inherits STATE
ZIP-level market 77541
- Home prices YoY
- -29.3%
- Active inventory
- 593
- Price-to-rent
- 5.5×
Monthly cashflow live
- Estimated rent
- $1,512 medium interval (Pro) →
- Mortgage (P&I)
- −$524
- Tax from tax record
- −$231 /mo · $2,770/yr
- Insurance
- −$42
- Flood insurance flood zone
- −$66 /mo · $798/yr
- HOA
- −$0
- Vacancy / Maint / Mgmt
- −$318
- Net cashflow
- $331
Break-even live
Sensitivity live
| Price | -10% $388 | -5% $359 | +0% $331 | +5% $303 | +10% $275 |
|---|---|---|---|---|---|
| Rent | -10% $212 | -5% $271 | +0% $331 | +5% $391 | +10% $451 |
| Rate | -1.0pp $382 | -0.5pp $357 | base $331 | +0.5pp $305 | +1.0pp $279 |
UW: 25.0% down · 7.5% · 30yr · 1.5% tax · 5.0% vac · 8.0% maint · 8.0% mgmt
Financing live
Cash to close
- Down payment
- $25,000
- Closing costs
- $3,000
- Reserves months
- —
- Total cash needed
- —
Loan-product check · same deal, 3 products live
Conventional
25% down · 7.5% · 30yr
- Down + closing
- —
- Monthly P&I
- —
- Monthly cashflow
- —
- DSCR
- —
- Eligible?
- —
Personal DTI + credit; lowest rate.
DSCR
20% down · 8.5% · 30yr
- Down + closing
- —
- Monthly P&I
- —
- Monthly cashflow
- —
- DSCR
- —
- Eligible?
- —
No personal income docs; deal must DSCR.
Hard money
10% down · 12.0% · 12mo
- Down + closing
- —
- Monthly P&I
- —
- Monthly cashflow
- —
- DSCR
- —
- Eligible?
- —
Short-term bridge; refi at stabilization.
Rent comps 4 comps
| Address | Beds | Baths | Sqft | Rent | $/sqft | DOM | Units | Dist |
|---|---|---|---|---|---|---|---|---|
| 310 Yaupon St Unit ST402 Freeport, TX | 3.0 | 1.0 | 1050 | $1,150 | $1.10 | 45d | 1 | 0.47mi |
| 527 W 8th St Freeport, TX | 3.0 | 1.0 | 950 | $995 | $1.05 | 45d | 1 | 0.61mi |
| 102 North Avenue C Unit C Freeport, TX | 4.0 | 2.0 | 1500 | $1,550 | $1.03 | 45d | 1 | 0.84mi |
| 905 N Avenue J Freeport, TX | 3.0 | 2.0 | 1161 | $871 | $0.75 | 45d | 1 | 1.50mi |
Listing history 27 events
-
2026-06-21days on market $100,000 Active 48 DOM
-
2026-06-18days on market $100,000 Active 45 DOM
-
2026-06-17days on market $100,000 Active 44 DOM
-
2026-06-16days on market $100,000 Active 43 DOM
-
2026-06-15pricedays on market $100,000 Active 42 DOM
-
2026-06-13days on market $116,000 Active 40 DOM
-
2026-06-09days on market $116,000 Active 36 DOM
-
2026-06-08days on market $116,000 Active 35 DOM
-
2026-06-07days on market $116,000 Active 34 DOM
-
2026-06-04days on market $116,000 Active 31 DOM
-
2026-06-03days on market $116,000 Active 30 DOM
-
2026-06-02days on market $116,000 Active 29 DOM
-
2026-06-01days on market $116,000 Active 28 DOM
-
2026-05-31days on market $116,000 Active 27 DOM
-
2026-05-04$116,000 Active 702-char remark
-
2026-03-27historical
-
2026-03-02price $126,000
-
2025-11-17price $130,000
-
2025-10-26price $140,000
-
2025-09-05price $144,500
-
2025-08-07price $146,500
-
2025-07-09price $151,000
-
2025-05-31price $155,900
-
2025-05-08price $159,900
-
2025-04-11$164,000 Active
-
2025-04-01historical
-
2015-08-07soldstatus
ⓘ Source: listings_history table (triggers on properties + properties_extension) + one-shot
backfill from property_details.listing_events for pre-trigger history.
Tax reassessment forecast TX · Resets to sale price
- Current annual tax
- $2,770 · $231/mo
- Projected year-2 tax
- $2,770 · $231/mo
- Expected delta
- $0/yr ($0/mo · 0.0%)
ⓘ Screening estimate from a state-policy table — verify with the county assessor before closing.
Climate risk First Street
- Flood 8/10 Severe FEMA zone X (unshaded) · 75% chance over 30 yrs
- Wildfire 5/10 Major
- Heat 10/10 Extreme 7 d/yr ≥113°F today · 25 d/yr by 30 yrs out
- Wind 9/10 Extreme 99% chance of damaging wind over 30 yrs
- Air quality 3/10 Moderate 2 unhealthy d/yr today · 2 by 30 yrs out
Nearby sold comps map
Loading sold comps map…
Walkable amenities ~0.75 mi
Loading nearby amenities…
Taxation est. · year 1
- Rental income
- $18,144
- − Mortgage interest
- −$5,602
- − Property taxes
- −$2,770
- − Insurance
- −$1,298
- − Repairs & maintenance
- −$1,452
- − Management
- −$1,452
- − Depreciation
- −$2,909
- Taxable income
- $2,664
- Est. tax owed @ 24.0%
- −$639
- After-tax cash flow
- $3,335/yr
For passive investors: Depreciation is non-cash, so a rental often shows a tax loss while cash-flowing — sheltering income. Rental losses are passive: they offset passive income freely, and up to $25,000/yr can offset ordinary (W-2) income if you actively participate and your MAGI is under $100k (phasing out to $0 by $150k); unused losses carry forward. On sale, claimed depreciation is recaptured at up to 25%, and gains may owe capital-gains tax (a 1031 exchange can defer both). Figures are a year-1 estimate at your 24.0% rate — not tax advice; consult a CPA.
Schools (NCES district)
- District
- Brazosport ISD
- NCES district ID
- 4811190
- Math proficiency
- 43% ▼ -6.00%
- Reading proficiency
- 41% ▼ -2.00%
- Median HH income
- $57,024
- Composite
- 36.84/100
- National rank
- #4557
- State rank
- #305 of 826 in TX
Livability — Freeport
- Score
- 58/100
- State rank
- #1205
- US rank
- #21044
Category grades
Schools grade is shown separately in the Schools card above.
Census & demographics
- Census place
- Freeport, TX
- County
- Brazoria County · 374,982 people
- City population
- 16,996
- Metro
- Houston-The Woodlands-Sugar Land, TX
- Population (ZIP)
- 16,996
- Household income
- $66,507
- Rent vs Own
- Severe rent burden
- 354.0
Population outlook (Brazoria County) Hauer SSP2
- Today (2025)
- 420,414 people
- By 2030
- 457,585 · +8.8%
- By 2040
- 532,232 · +26.6%
- By 2050
- 605,399 · +44.0%
- By 2075
- 779,358 · +85.4%
- By 2100
- 883,759 · +110.2%
Race, ethnicity, and origin ACS 2023
- Neighborhood character
- Diverse neighborhood (Simpson 0.62)
- Race & ethnicity
- Hispanic / Latino 47% White 38% Two or more races 23% Black 12%
- Hispanic origin (detail)
- Mexican 42%
- Common ancestry
- Romanian 1% Italian 1% Lithuanian 1%
- Foreign-born
- 12% · Canada
- Languages at home
- 71% English-only · Spanish 29%
Political lean MEDSL · Brazoria
- 2024 margin
- R (+19.7) · D 39.5% · R 59.2% · Other 1.3%
- 2008→2024 swing
- +9.9pp toward D · 2008: -29.6pp · 2024: -19.7pp
- All cycles
- 2024: R+19.7 2020: R+18.2 2016: R+24.6 2012: R+34.2 2008: R+29.6
Not yet ingested
- Civics
- —
Market trends
- HPI YoY
- ▼ -110.12%
- Current HPI
- 265.9301
- Rent YoY
- —
- Metro
- Houston-The Woodlands-Sugar Land, TX
- State GDP YoY
- ▲ 3.95%
- F500 in state
- 110
Industry mix (Fortune 500 HQ in TX)
| Industry | F500 HQs | Revenue |
|---|---|---|
| Energy | 16 | $1,198B |
|
||
| Technology | 5 | $198B |
|
||
| Engineering / Construction | 4 | $72B |
|
||
| Energy Services | 3 | $60B |
|
||
| Utilities | 3 | $41B |
|
||
| Healthcare | 2 | $330B |
|
||
Price history
-39.0% since first listed14 events — show timeline
- 2026-06-14 Price Changed $100,000 HARMLS
- 2026-05-04 Listed $116,000 HARMLS
- 2026-03-27 Listing Removed — HARMLS
- 2026-03-02 Price Changed $126,000 HARMLS
- 2025-11-17 Price Changed $130,000 HARMLS
- 2025-10-26 Price Changed $140,000 HARMLS
- 2025-09-05 Price Changed $144,500 HARMLS
- 2025-08-07 Price Changed $146,500 HARMLS
- 2025-07-09 Price Changed $151,000 HARMLS
- 2025-05-31 Price Changed $155,900 HARMLS
- 2025-05-08 Price Changed $159,900 HARMLS
- 2025-04-11 Listed $164,000 HARMLS
- 2025-04-01 Coming Soon — HARMLS
- 2015-08-07 Sold (Public Records) — Public Records
Property tax history
+6.6%/yrLatest (2025): $2,770 · -5.6% YoY. Source: county tax records.
Cash-flow waterfall
monthlySold comps — $/sqft
last 12 mo · ≤1 miLoading sold comps…