701 Chase St · Florence, SC
Flood risk 1/10 · Minimal
- FEMA flood zone
- X (unshaded)
- Chance of flooding over 30 yrs
- 0.0%
- Est. flood insurance / yr
- $507 – $1,088
Fire risk 4/10 · Minor
- Est. fire insurance / yr
- $783 – $1,453
Heat risk 7/10 · Major
- Hot days now (above 107°F)
- 7 days/yr
- Hot days in 30 yrs
- 16 days/yr
Wind risk 8/10 · Major
- Chance of severe wind over 30 yrs
- 80.0%
Air-quality risk 1/10 · Minimal
- Unhealthy air days now
- 0 days/yr
- Unhealthy air days in 30 yrs
- 0 days/yr
Risk factors via First Street. Map © Google.
Why this score? — see what drove the B- grade
The composite is a weighted blend of 9 inputs, each scored 0–100. Each bar is that input's sub-score; the figure is the points it added to the 100-point composite (weight × sub-score).
- Cash flow +30.0/30.0
- 1% rule +10.0/10.0
- DSCR +10.0/10.0
- ARV discount +4.6/15.0
- Rent growth +3.7/5.0
- Schools +3.2/10.0
- Livability +3.1/5.0
- Condition / age +2.5/5.0
- Appreciation +0.0/10.0
$55,000
🖨 Deal sheet 📄 Offer letter ✓ Due diligence
Listing remarks MLS
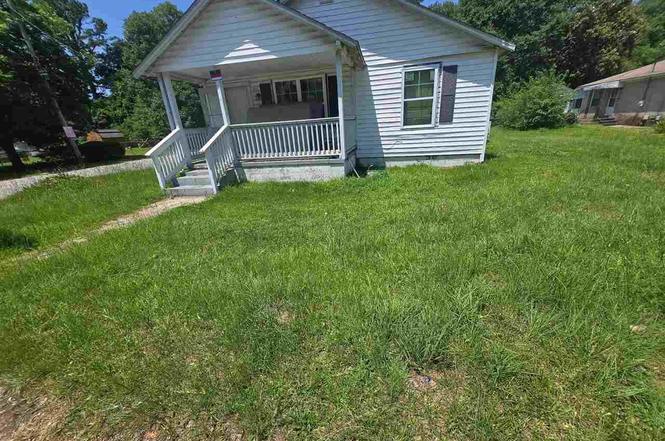
Calling all investors!! 2BD 1 BA, Home situated on a corner lot that is . 21 acre parcel. Home is being sold As-is, great investment property that would be a good addition to your portfolio. Located just minutes from the heart of downtown Florence. Call the office today to schedule a showing 843-667-1100
Key facts
- Convenient location
- Corner lot
- 0.23 acre lot
Tags
Property features AI
Exterior
- Utilities: Public water; Public sewer
- Home design: Single-family residence; Residential property; Corner lot
- Construction: Wood siding exterior; Shingle roof; Built area above grade: 876
- Exterior features: Front porch
Interior
- Bathrooms: 1 full bathroom
- Interior features: Crawl space basement
Neighborhood map
What this means for you Summary
Snapshot
- This is a 2-bed/1.0-bath single-family listed at $55k.
Deal economics
- At list price, monthly cash flow is $598 ($7k/yr) — positive.
- The deal already cash-flows at list — no discount required.
- Meets the 1% rule at list price ($1k rent vs $55k).
- Recommended offer: $48k (12.0% below list) — sets the bar for market timing.
- Cap rate 19.3% vs local median 3.5% in Florence — top-decile yield for the area; either an underpriced asset or a hidden risk that comps aren't pricing in. Stress-test before assuming the spread holds.
Location & tenants
- Location reads 62/100 on livability (#196 in SC) — a middle-class / working-renter tenant base. Strengths: cost of living A+, housing A+, health & safety B+; Watch: employment C-, crime F, amenities F.
- Florence 01 (urban): math 29% / reading 47% proficiency, ranked #34 of 80 in SC (top 42%) — families likely to look elsewhere, expect single-tenant / working-renter base with shorter leases.
- Zoned schools: Lucy T. Davis Elementary (math 40% / reading 47%, grade F, #246 of 597 statewide, top 42%, 564 students, 66% FRL); John W. Moore Middle (math 32% / reading 49%, grade F, #75 of 229 statewide, top 33%, 1,044 students, 73% FRL); West Florence High (math 57% / reading 88%, grade B+, #46 of 196 statewide, top 24%, 1,807 students, 65% FRL).
- Zoned-school proficiency averages 52% at this address vs 38% district-wide (+14 pts) — the actual schools serving this property are materially stronger than the Florence 01 average implies; a family-tenant draw the district grade alone would hide.
- Market conditions: Rents rising fast (+4.7%/yr); 328 active listings in the ZIP; 657 units permitted in Florence County in 2024 (40 in 5+ unit buildings).
Forward outlook
- Local home prices are declining (-3.0%/yr); year-one equity from $380 of loan paydown is wiped out by about $2k of value loss. Plan a longer hold.
- At projected returns (-3.0% appreciation + 4.7% rent growth), your $15k cash investment doubles in ~3 years — after that, you're playing with house money.
Negotiation context
- It's been on market 148 days — a 12% lower offer ($48k) is reasonable based on typical stale-listing flexibility.
- 3 sale attempts since 4y ago with the ask held roughly flat each time — persistent listings suggest the price (not the market) is what's stuck; bring a comps-based counter.
Risks & watch-outs
- Watch-outs: built in 1940 — expect roof / HVAC / electrical / plumbing capex.
- Climate carrying-cost: severe wind risk, 80% chance of damaging wind over 30y; extreme-heat days projected 7→16/yr by 2055 (HVAC capex compounding) — expect insurance premiums to compound above CPI over the hold.
Questions for the listing agent
- It's been on market 148 days. Have you received any prior offers? Is the seller open to a 12% concession, seller financing, or rate buy-down credit?
- Built in 1940 — when were the roof, HVAC, electrical panel, plumbing, and water heater last replaced?
- Why hasn't it sold? Are there any deal-killer items the seller is aware of (foundation, flood, title, zoning, code violations)?
- Is there a deadline driving the sale (1031 exchange, divorce, estate, relocation)? That informs how much negotiation room exists.
- Crime grade is F in this area — have there been break-ins, vandalism, or insurance claims at this property in the last 3 years? What carrier currently insures it and at what premium?
- What's the average days-on-market for RENTAL listings here right now (not sales)? A rising rental-DOM trend means longer vacancies and softer asking-rent achievability than the comps imply.
- What's the recent tenant-quality profile in this submarket — average credit score on applications, eviction rate, late-payment / NSF rate, and stable-employment percentage? A property-management company in the area should have these aggregated.
- How much new for-sale + rental construction is in the pipeline within 1–3 miles? Heavy new supply typically softens prices + rents 12–24 months out; constrained supply supports both.
Investment metrics
- 1% rule
- 2.27% ✓
- Cap rate
- 19.34%
- Cash-on-cash
- 46.59%
- DSCR
- 3.07
- GRM
- 3.7
CMA / ARV
- ARV (on-the-fly)
- $51,684
- Comps found
- 5
Show comp detail 5 sales within ~0.75 mi
| Address | Dist | Beds/Ba | Sqft | Sold | Price | $/sf | Match |
|---|---|---|---|---|---|---|---|
| 517 N Mcqueen St | 0.23mi | 2/1.0 | 832 (-5%) | 22mo | $85,000 | $102 | 63 |
| 506 Sanborn St | 0.20mi | 3/2.0 (+1) | 950 (+8%) | 13mo | $115,000 | $121 | 57 |
| 715 N Mcqueen St | 0.23mi | 3/1.0 (+1) | 996 (+14%) | 6mo | $54,000 | $54 | 56 |
| 311 W Sumter St | 0.32mi | 3/1.0 (+1) | 829 (-5%) | 24mo | $48,750 | $59 | 51 |
| 921 Ingram St | 0.38mi | 2/1.0 | 945 (+8%) | 23mo | $50,000 | $53 | 50 |
Match score weights: distance 35% · size 25% · config 20% · recency 20%. Top-matched comps best support the ARV.
Projected returns pro-forma
-3.0% appreciation · 4.7% rent growth · sell at horizon
- IRR
- 45.8%
- Equity multiple
- 3.04×
- Total profit
- $31,367
- Equity at exit
- $8,201
- IRR
- 52.4%
- Equity multiple
- 6.56×
- Total profit
- $85,675
- Equity at exit
- $4,755
Cash invested: $15,400 (down + closing). Projections, not guarantees.
Landlord ↔ Tenant lean methodology
- Overall (STATE)
- 90 Strongly Landlord-Friendly
- State South Carolina
- 90 Strongly Landlord-Friendly · R+6
- County
- — inherits STATE
- City
- — inherits STATE
ZIP-level market 29501
- Rents YoY
- 4.7%
- Active inventory
- 328
- Price-to-rent
- 3.7×
Monthly cashflow live
- Estimated rent
- $1,248 medium interval (Pro) →
- Mortgage (P&I)
- −$288
- Tax from tax record
- −$77 /mo · $923/yr
- Insurance
- −$23
- HOA
- −$0
- Vacancy / Maint / Mgmt
- −$262
- Net cashflow
- $598
Break-even live
UW: 25.0% down · 7.5% · 30yr · 1.5% tax · 5.0% vac · 8.0% maint · 8.0% mgmt
Financing live
Cash to close
- Down payment
- $13,750
- Closing costs
- $1,650
- Reserves months
- —
- Total cash needed
- —
Loan-product check · same deal, 3 products live
Conventional
25% down · 7.5% · 30yr
- Down + closing
- —
- Monthly P&I
- —
- Monthly cashflow
- —
- DSCR
- —
- Eligible?
- —
Personal DTI + credit; lowest rate.
DSCR
20% down · 8.5% · 30yr
- Down + closing
- —
- Monthly P&I
- —
- Monthly cashflow
- —
- DSCR
- —
- Eligible?
- —
No personal income docs; deal must DSCR.
Hard money
10% down · 12.0% · 12mo
- Down + closing
- —
- Monthly P&I
- —
- Monthly cashflow
- —
- DSCR
- —
- Eligible?
- —
Short-term bridge; refi at stabilization.
Listing history 20 events
-
2026-06-19days on market $55,000 Active 148 DOM
-
2026-06-18days on market $55,000 Active 147 DOM
-
2026-06-17days on market $55,000 Active 146 DOM
-
2026-06-16days on market $55,000 Active 145 DOM
-
2026-06-15days on market $55,000 Active 144 DOM
-
2026-06-14days on market $55,000 Active 142 DOM
-
2026-06-13days on market $55,000 Active 141 DOM
-
2026-06-10days on market $55,000 Active 139 DOM
-
2026-06-09days on market $55,000 Active 138 DOM
-
2026-06-08days on market $55,000 Active 137 DOM
-
2026-06-07days on market $55,000 Active 136 DOM
-
2026-06-05days on market $55,000 Active 133 DOM
-
2026-06-02days on market $55,000 Active 131 DOM
-
2026-06-01days on market $55,000 Active 130 DOM
-
2026-05-31days on market $55,000 Active 129 DOM
-
2026-05-30days on market $55,000 Active 128 DOM
-
2026-01-22$55,000 Active
-
2023-10-16soldstatus 305-char remark
Show marketing remark (305 chars)
Calling all investors!! 2BD 1 BA, Home situated on a corner lot that is . 21 acre parcel. Home is being sold As-is, great investment property that would be a good addition to your portfolio. Located just minutes from the heart of downtown Florence. Call the office today to schedule a showing 843-667-1100
-
2022-12-22$45,000 305-char remark
Show marketing remark (305 chars)
Calling all investors!! 2BD 1 BA, Home situated on a corner lot that is . 21 acre parcel. Home is being sold As-is, great investment property that would be a good addition to your portfolio. Located just minutes from the heart of downtown Florence. Call the office today to schedule a showing 843-667-1100
-
2022-05-03$88,000
ⓘ Source: listings_history table (triggers on properties + properties_extension) + one-shot
backfill from property_details.listing_events for pre-trigger history.
Tax reassessment forecast SC · Resets to sale price
- Current annual tax
- $923 · $77/mo
- Projected year-2 tax
- $923 · $77/mo
- Expected delta
- $0/yr ($0/mo · 0.0%)
ⓘ Screening estimate from a state-policy table — verify with the county assessor before closing.
Climate risk First Street
- Flood 1/10 Low FEMA zone X (unshaded) · 0% chance over 30 yrs
- Wildfire 4/10 Moderate
- Heat 7/10 Severe 7 d/yr ≥107°F today · 16 d/yr by 30 yrs out
- Wind 8/10 Severe 80% chance of damaging wind over 30 yrs
- Air quality 1/10 Low 0 unhealthy d/yr today · 0 by 30 yrs out
Nearby sold comps map
Loading sold comps map…
Walkable amenities ~0.75 mi
Loading nearby amenities…
Taxation est. · year 1
- Rental income
- $14,981
- − Mortgage interest
- −$3,081
- − Property taxes
- −$923
- − Insurance
- −$275
- − Repairs & maintenance
- −$1,198
- − Management
- −$1,198
- − Depreciation
- −$1,600
- Taxable income
- $6,705
- Est. tax owed @ 24.0%
- −$1,609
- After-tax cash flow
- $5,566/yr
For passive investors: Depreciation is non-cash, so a rental often shows a tax loss while cash-flowing — sheltering income. Rental losses are passive: they offset passive income freely, and up to $25,000/yr can offset ordinary (W-2) income if you actively participate and your MAGI is under $100k (phasing out to $0 by $150k); unused losses carry forward. On sale, claimed depreciation is recaptured at up to 25%, and gains may owe capital-gains tax (a 1031 exchange can defer both). Figures are a year-1 estimate at your 24.0% rate — not tax advice; consult a CPA.
Schools (NCES district)
- District
- Florence 01
- NCES district ID
- 4502130
- Math proficiency
- 29% ▼ -10.00%
- Reading proficiency
- 47% ▬ 0.00%
- Median HH income
- $45,782
- Composite
- 32.36/100
- National rank
- #5737
- State rank
- #34 of 80 in SC
Livability — Florence
- Score
- 62/100
- State rank
- #196
- US rank
- #17076
Category grades
Schools grade is shown separately in the Schools card above.
Census & demographics
- Census place
- Florence, SC
- County
- Florence County · 93,345 people
- City population
- 93,345
- Metro
- Florence, SC
- Population (ZIP)
- 48,673
- Household income
- $71,671
- Rent vs Own
- Severe rent burden
- 1792.0
Population outlook (Florence County) Hauer SSP2
- Today (2025)
- 141,714 people
- By 2030
- 142,121 · +0.3%
- By 2040
- 141,344 · -0.3%
- By 2050
- 139,478 · -1.6%
- By 2075
- 132,275 · -6.7%
- By 2100
- 118,374 · -16.5%
Race, ethnicity, and origin ACS 2023
- Neighborhood character
- Diverse neighborhood (Simpson 0.56)
- Race & ethnicity
- White 56% Black 35% Asian 3% Hispanic / Latino 3% Two or more races 3%
- Common ancestry
- Serbian 2% Slovak 2% Lithuanian 1%
- Foreign-born
- 4% · Canada, China
- Languages at home
- 93% English-only · Spanish 3% Other Indo-European 1% Russian/Polish/Slavic 1%
Political lean MEDSL · Florence
- 2024 margin
- Lean R (+8.0) · D 45.3% · R 53.3% · Other 1.3%
- 2008→2024 swing
- -4.8pp toward R · 2008: -3.2pp · 2024: -8.0pp
- All cycles
- 2024: R+8.0 2020: R+2.3 2016: R+5.0 2012: R+0.5 2008: R+3.2
Not yet ingested
- Civics
- —
Market trends
- HPI YoY
- ▼ -181.85%
- Current HPI
- 171.4154
- Rent YoY
- ▲ 4.70%
- Metro
- Florence, SC
- State GDP YoY
- ▲ 4.51%
- F500 in state
- 2
Industry mix (Fortune 500 HQ in SC)
| Industry | F500 HQs | Revenue |
|---|---|---|
| Packaging | 1 | $7B |
|
||
Price history
-37.5% since first listed4 events — show timeline
- 2026-01-22 Listed $55,000 RAGPD
- 2023-10-16 Sold (MLS) — RAGPD
- 2022-12-22 Listed $45,000 RAGPD
- 2022-05-03 Listed $88,000 RAGPD
Property tax history
+9.7%/yrLatest (2025): $923 · +6.4% YoY. Source: county tax records.
Cash-flow waterfall
monthlySold comps — $/sqft
last 12 mo · ≤1 miLoading sold comps…