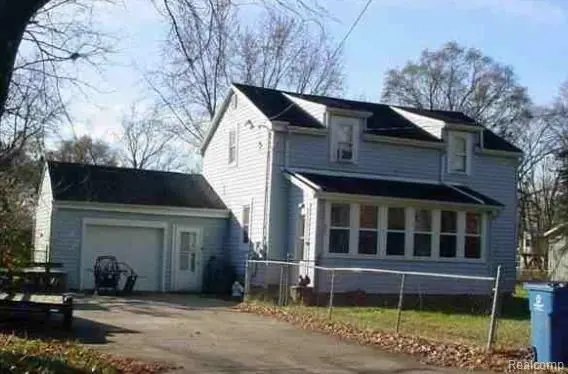
657 Marie Ave · Level Park-Oak Park, MI
Flood risk 1/10 · Minimal
- FEMA flood zone
- X (unshaded)
- Chance of flooding over 30 yrs
- 0.0%
- Est. flood insurance / yr
- $473 – $860
Fire risk 2/10 · Minimal
- Est. fire insurance / yr
- $784 – $1,456
Heat risk 2/10 · Minimal
- Hot days now (above 97°F)
- 7 days/yr
- Hot days in 30 yrs
- 16 days/yr
Wind risk 2/10 · Minimal
- Chance of severe wind over 30 yrs
- —
Air-quality risk 3/10 · Minor
- Unhealthy air days now
- 2 days/yr
- Unhealthy air days in 30 yrs
- 3 days/yr
Risk factors via First Street. Map © Google.
Why this score? — see what drove the C+ grade
The composite is a weighted blend of 9 inputs, each scored 0–100. Each bar is that input's sub-score; the figure is the points it added to the 100-point composite (weight × sub-score).
- Cash flow +24.0/30.0
- ARV discount +15.0/15.0
- DSCR +7.7/10.0
- 1% rule +5.4/10.0
- Rent growth +5.0/5.0
- Livability +2.5/5.0
- Condition / age +2.5/5.0
- Schools +1.1/10.0
- Appreciation +0.0/10.0
$123,200
🖨 Deal sheet 📄 Offer letter ✓ Due diligence
Listing remarks MLS
Sweet Cape Cod on large lot 17,424 sf lot! Spacious 1 car attached garage with separate entry. 3 bedrooms, 1 bathroom and lots of windows. Past updating. May need some repairs. Reserve Auction – NO ACCESS OR VIEWINGS of this property. "As is" sale with no contingencies or inspections. Seller cannot guarantee occupancy. Buyer will be responsible for obtaining possession of the property upon closing. * * * SPECIAL NOTES: (1) This is a CASH ONLY transaction. (2) Seller to pay Taxes, HOA, and Municipal/Utility Liens. (3) Please read the Auction disclaimers carefully before placing a bid or submitting an offer. * * * List price is $123,200. Right of Redemption active until 7/7/2026.
Key facts
- 0.4 acre lot
- Garage
- Built 1940
Neighborhood map
What this means for you Summary
Snapshot
- This is a 3-bed/1.0-bath single-family listed at $123k.
Deal economics
- At list price, monthly cash flow is $241 ($3k/yr) — positive.
- The deal already cash-flows at list — no discount required.
- Meets the 1% rule at list price ($1k rent vs $123k).
- Recommended offer: $108k (12.0% below list) — sets the bar for market timing.
Location & tenants
- Location reads: area grade C — affects rentability + tenant quality, not the cash-flow math above.
- Battle Creek Public Schools (urban): math 8% / reading 19% proficiency, ranked #510 of 540 in MI (top 94%) — low school quality limits family demand, transient renter base, plan for 1-2y turnover; 75% free/reduced lunch — lower-income household profile, screen leases tightly.
- Market conditions: Rents rising fast (+11.8%/yr); 236 active listings in the ZIP; 1 comparable units currently listed for rent nearby; lower-income renter base — watch delinquency; 132 units permitted in Calhoun County in 2024 (0 in 5+ unit buildings).
- This rent runs 36% of the median local income ($43k/yr) — at the standard rent-burdened threshold; future hikes will face affordability resistance.
Forward outlook
- Local home prices are declining (-3.0%/yr); year-one equity from $852 of loan paydown is wiped out by about $4k of value loss. Plan a longer hold.
- Calhoun County population projected at -16% by 2050 — secular population decline; favor cash flow + early exit over multi-decade hold.
- At projected returns (-3.0% appreciation + 8.0% rent growth), your $34k cash investment doubles in ~8 years — after that, you're playing with house money.
Negotiation context
- It's been on market 156 days — a 12% lower offer ($108k) is reasonable based on typical stale-listing flexibility.
- 9 sale attempts since 16y ago with the ask held roughly flat each time — persistent listings suggest the price (not the market) is what's stuck; bring a comps-based counter.
Risks & watch-outs
- Watch-outs: built in 1940 — expect roof / HVAC / electrical / plumbing capex.
Questions for the listing agent
- It's been on market 156 days. Have you received any prior offers? Is the seller open to a 12% concession, seller financing, or rate buy-down credit?
- Built in 1940 — when were the roof, HVAC, electrical panel, plumbing, and water heater last replaced?
- Why hasn't it sold? Are there any deal-killer items the seller is aware of (foundation, flood, title, zoning, code violations)?
- Is there a deadline driving the sale (1031 exchange, divorce, estate, relocation)? That informs how much negotiation room exists.
- What's the average days-on-market for RENTAL listings here right now (not sales)? A rising rental-DOM trend means longer vacancies and softer asking-rent achievability than the comps imply.
- What's the recent tenant-quality profile in this submarket — average credit score on applications, eviction rate, late-payment / NSF rate, and stable-employment percentage? A property-management company in the area should have these aggregated.
- How much new for-sale + rental construction is in the pipeline within 1–3 miles? Heavy new supply typically softens prices + rents 12–24 months out; constrained supply supports both.
Investment metrics
- 1% rule
- 1.04% ✓
- Cap rate
- 8.64%
- Cash-on-cash
- 8.39%
- DSCR
- 1.37
- GRM
- 8.0
CMA / ARV
- ARV (median comp)
- $174,318
- List price
- $123,200
- Delta
- -29.32%
- Verdict
- UNDERPRICED
- Comps
- 20 within 1.0 mi
Show comp detail 12 sales within ~0.75 mi
| Address | Dist | Beds/Ba | Sqft | Sold | Price | $/sf | Match |
|---|---|---|---|---|---|---|---|
| 235 Oak St | 0.25mi | 3/1.0 | 954 (-1%) | 5mo | $169,000 | $177 | 82 |
| 338 Cross St | 0.25mi | 3/1.0 | 992 (+3%) | 6mo | $145,000 | $146 | 78 |
| 233 Oak St | 0.25mi | 2/1.0 (-1) | 994 (+3%) | 2mo | $148,000 | $149 | 77 |
| 124 Bansill Dr | 0.65mi | 3/1.0 | 964 (-0%) | 2mo | $150,000 | $156 | 68 |
| 52 N Mason Ave | 0.62mi | 3/1.0 | 925 (-4%) | 13mo | $135,900 | $147 | 53 |
| 88 N Cedar Ave | 0.58mi | 3/1.0 | 864 (-11%) | 10mo | $126,000 | $146 | 48 |
| 2901 Michigan Ave W | 0.59mi | 4/1.0 (+1) | 1,053 (+9%) | 6mo | $148,000 | $141 | 47 |
| 247 N Woodlawn Ave | 0.59mi | 3/1.0 | 864 (-11%) | 12mo | $165,000 | $191 | 45 |
| 33 N Mason Ave | 0.68mi | 3/1.0 | 864 (-11%) | 8mo | $160,000 | $185 | 44 |
| 135 Tulip Tree Ln | 0.69mi | 2/1.0 (-1) | 900 (-7%) | 10mo | $137,500 | $153 | 43 |
| 53 N Mason Ave | 0.60mi | 2/1.0 (-1) | 1,056 (+9%) | 11mo | $148,720 | $141 | 42 |
| 182 Broadway Blvd | 0.72mi | 3/1.0 | 864 (-11%) | 10mo | $160,000 | $185 | 40 |
Match score weights: distance 35% · size 25% · config 20% · recency 20%. Top-matched comps best support the ARV.
Projected returns pro-forma
-3.0% appreciation · 8.0% rent growth · sell at horizon
- IRR
- 1.6%
- Equity multiple
- 1.06×
- Total profit
- $2,153
- Equity at exit
- $18,370
- IRR
- 15.4%
- Equity multiple
- 2.52×
- Total profit
- $52,430
- Equity at exit
- $10,652
Cash invested: $34,496 (down + closing). Projections, not guarantees.
Landlord ↔ Tenant lean methodology
- Overall (STATE)
- 62 Landlord-Friendly
- State Michigan
- 62 Landlord-Friendly · EVEN
- County
- — inherits STATE
- City
- — inherits STATE
ZIP-level market 49037
- Home prices YoY
- -29.0%
- Rents YoY
- 11.8%
- Active inventory
- 236
- Price-to-rent
- 8.0×
Monthly cashflow live
- Estimated rent
- $1,284 medium interval (Pro) →
- Mortgage (P&I)
- −$646
- Tax from tax record
- −$76 /mo · $914/yr
- Insurance
- −$51
- HOA
- −$0
- Vacancy / Maint / Mgmt
- −$270
- Net cashflow
- $241
Break-even live
UW: 25.0% down · 7.5% · 30yr · 1.5% tax · 5.0% vac · 8.0% maint · 8.0% mgmt
Financing live
Cash to close
- Down payment
- $30,800
- Closing costs
- $3,696
- Reserves months
- —
- Total cash needed
- —
Loan-product check · same deal, 3 products live
Conventional
25% down · 7.5% · 30yr
- Down + closing
- —
- Monthly P&I
- —
- Monthly cashflow
- —
- DSCR
- —
- Eligible?
- —
Personal DTI + credit; lowest rate.
DSCR
20% down · 8.5% · 30yr
- Down + closing
- —
- Monthly P&I
- —
- Monthly cashflow
- —
- DSCR
- —
- Eligible?
- —
No personal income docs; deal must DSCR.
Hard money
10% down · 12.0% · 12mo
- Down + closing
- —
- Monthly P&I
- —
- Monthly cashflow
- —
- DSCR
- —
- Eligible?
- —
Short-term bridge; refi at stabilization.
Rent comps 1 comps
| Address | Beds | Baths | Sqft | Rent | $/sqft | DOM | Units | Dist |
|---|---|---|---|---|---|---|---|---|
| 55 Stringham Rd Battle Creek, MI | 1.0–2.0 | 1.0–1.5 | 850 | $1,075 | $1.26 | 13d | 7 | 1.04mi |
Listing history 41 events
-
2026-06-19days on market $123,200 Active 156 DOM
-
2026-06-18days on market $123,200 Active 155 DOM
-
2026-06-17days on market $123,200 Active 154 DOM
-
2026-06-16days on market $123,200 Active 153 DOM
-
2026-06-15days on market $123,200 Active 152 DOM
-
2026-06-14days on market $123,200 Active 150 DOM
-
2026-06-13days on market $123,200 Active 149 DOM
-
2026-06-10days on market $123,200 Active 147 DOM
-
2026-06-09days on market $123,200 Active 146 DOM
-
2026-06-08days on market $123,200 Active 145 DOM
-
2026-06-07days on market $123,200 Active 144 DOM
-
2026-06-05days on market $123,200 Active 141 DOM
-
2026-06-02days on market $123,200 Active 139 DOM
-
2026-06-01days on market $123,200 Active 138 DOM
-
2026-05-31days on market $123,200 Active 137 DOM
-
2026-05-30days on market $123,200 Active 136 DOM
-
2026-01-14$123,200 Active 720-char remark
Show marketing remark (707 chars)
Sweet Cape Cod on large lot 17,424 sf lot! Spacious 1 car attached garage with separate entry. 3 bedrooms, 1 bathroom and lots of windows. Past updating. May need some repairs. Reserve Auction – NO ACCESS OR VIEWINGS of this property. "As is" sale with no contingencies or inspections. Seller cannot guarantee occupancy. Buyer will be responsible for obtaining possession of the property upon closing. * * * SPECIAL NOTES: (1) This is a CASH ONLY transaction. (2) Seller to pay Taxes, HOA, and Municipal/Utility Liens. (3) Please read the Auction disclaimers carefully before placing a bid or submitting an offer. * * * List price is $123,200. Right of Redemption active until 7/7/2026.
-
2026-01-14$123,200 Active 707-char remark
Show marketing remark (707 chars)
Sweet Cape Cod on large lot 17,424 sf lot! Spacious 1 car attached garage with separate entry. 3 bedrooms, 1 bathroom and lots of windows. Past updating. May need some repairs. Reserve Auction – NO ACCESS OR VIEWINGS of this property. "As is" sale with no contingencies or inspections. Seller cannot guarantee occupancy. Buyer will be responsible for obtaining possession of the property upon closing. * * * SPECIAL NOTES: (1) This is a CASH ONLY transaction. (2) Seller to pay Taxes, HOA, and Municipal/Utility Liens. (3) Please read the Auction disclaimers carefully before placing a bid or submitting an offer. * * * List price is $123,200. Right of Redemption active until 7/7/2026.
-
2021-11-23soldstatus $150,000
-
2021-11-10historical
-
2021-11-09soldstatus $150,000 Sold
-
2021-11-09soldstatus $150,000 Sold
-
2021-09-23price $150,000
-
2021-09-23status Pending
-
2021-09-23status Pending
-
2021-09-23price $150,000
-
2021-09-20$125,000 Active
-
2021-09-20$125,000 Active
-
2021-09-20$150,000
-
2010-12-01soldstatus $55,400
-
2010-07-29soldstatus $54,000
-
2010-07-12soldstatus $54,000
-
2010-07-12soldstatus $54,000
-
2010-06-19$59,900
-
2010-06-19$59,900
-
2010-03-29soldstatus $18,500
-
2010-03-29soldstatus $18,500
-
2010-02-27$22,900
-
2010-02-27$22,900
-
2006-09-26soldstatus $89,000
-
2001-10-01soldstatus $62,000
ⓘ Source: listings_history table (triggers on properties + properties_extension) + one-shot
backfill from property_details.listing_events for pre-trigger history.
Tax reassessment forecast MI · Partial reset (capped growth)
- Current annual tax
- $914 · $76/mo
- Projected year-2 tax
- $1,406 · $117/mo
- Expected delta
- +$492/yr (+$41/mo · 53.8%)
ⓘ Screening estimate from a state-policy table — verify with the county assessor before closing.
Climate risk First Street
- Flood 1/10 Low FEMA zone X (unshaded) · 0% chance over 30 yrs
- Wildfire 2/10 Low
- Heat 2/10 Low 7 d/yr ≥97°F today · 16 d/yr by 30 yrs out
- Wind 2/10 Low
- Air quality 3/10 Moderate 2 unhealthy d/yr today · 3 by 30 yrs out
Nearby sold comps map
Loading sold comps map…
Walkable amenities ~0.75 mi
Loading nearby amenities…
Taxation est. · year 1
- Rental income
- $15,414
- − Mortgage interest
- −$6,901
- − Property taxes
- −$914
- − Insurance
- −$616
- − Repairs & maintenance
- −$1,233
- − Management
- −$1,233
- − Depreciation
- −$3,584
- Taxable income
- $932
- Est. tax owed @ 24.0%
- −$224
- After-tax cash flow
- $2,670/yr
For passive investors: Depreciation is non-cash, so a rental often shows a tax loss while cash-flowing — sheltering income. Rental losses are passive: they offset passive income freely, and up to $25,000/yr can offset ordinary (W-2) income if you actively participate and your MAGI is under $100k (phasing out to $0 by $150k); unused losses carry forward. On sale, claimed depreciation is recaptured at up to 25%, and gains may owe capital-gains tax (a 1031 exchange can defer both). Figures are a year-1 estimate at your 24.0% rate — not tax advice; consult a CPA.
Schools (NCES district)
- District
- Battle Creek Public Schools
- NCES district ID
- 2600005
- Math proficiency
- 8% ▼ -2.00%
- Reading proficiency
- 19% ▬ 0.00%
- Median HH income
- $31,697
- Composite
- 10.73/100
- National rank
- #9769
- State rank
- #510 of 540 in MI
Livability — Level Park-Oak Park
No livability data for this city. (Only ~50 U.S. cities are tracked.)
Census & demographics
- Census place
- Level Park-Oak Park, MI
- County
- Calhoun County · 91,590 people
- Metro
- Battle Creek, MI
- Population (ZIP)
- 20,550
- Household income
- $42,690
- Rent vs Own
- Severe rent burden
- 717.0
Population outlook (Calhoun County) Hauer SSP2
- Today (2025)
- 130,157 people
- By 2030
- 126,691 · -2.7%
- By 2040
- 118,517 · -8.9%
- By 2050
- 109,855 · -15.6%
- By 2075
- 90,486 · -30.5%
- By 2100
- 70,766 · -45.6%
Race, ethnicity, and origin ACS 2023
- Neighborhood character
- Diverse neighborhood (Simpson 0.60)
- Race & ethnicity
- White 58% Black 23% Two or more races 11% Hispanic / Latino 7% Asian 3%
- Hispanic origin (detail)
- Mexican 5% Puerto Rican 1%
- Common ancestry
- Slovak 3% Romanian 2% Lithuanian 2%
- Foreign-born
- 4% · Canada, Philippines
- Languages at home
- 92% English-only · Spanish 4% Other Asian/Pacific 2% Other Indo-European 1%
Political lean MEDSL · Calhoun
- 2024 margin
- R (+14.1) · D 42.3% · R 56.4% · Other 1.3%
- 2008→2024 swing
- -23.4pp toward R · 2008: 9.4pp · 2024: -14.1pp
- All cycles
- 2024: R+14.1 2020: R+11.1 2016: R+12.5 2012: D+1.6 2008: D+9.4
Not yet ingested
- Civics
- —
Market trends
- HPI YoY
- ▼ -111.62%
- Current HPI
- 273.2446
- Rent YoY
- ▲ 11.76%
- Metro
- Battle Creek, MI
- State GDP YoY
- ▲ 1.37%
- F500 in state
- 28
Industry mix (Fortune 500 HQ in MI)
| Industry | F500 HQs | Revenue |
|---|---|---|
| Automotive Parts | 3 | $48B |
|
||
| Automotive | 2 | $372B |
|
||
| Chemicals | 1 | $45B |
|
||
| Automotive Retail | 1 | $29B |
|
||
| Healthcare / Medical Devices | 1 | $23B |
|
||
| Automotive Technology | 1 | $20B |
|
||
Price history
+98.7% since first listed25 events — show timeline
- 2026-01-14 Listed $123,200 REALCOMP
- 2026-01-14 Listed $123,200 MiRealSource-MiMLS
- 2021-11-23 Sold (Public Records) $150,000 Public Records
- 2021-11-10 Listing Removed — SW Michigan MLS
- 2021-11-09 Sold (MLS) $150,000 SW Michigan MLS
- 2021-11-09 Sold (MLS) $150,000 REALCOMP
- 2021-09-23 Price Changed $150,000 SW Michigan MLS
- 2021-09-23 Pending — REALCOMP
- 2021-09-23 Pending — SW Michigan MLS
- 2021-09-23 Price Changed $150,000 REALCOMP
- 2021-09-20 Listed $150,000 MiRealSource-MiMLS
- 2021-09-20 Listed $125,000 SW Michigan MLS
- 2021-09-20 Listed $125,000 REALCOMP
- 2010-12-01 Sold (Public Records) $55,400 Public Records
- 2010-07-29 Sold (Public Records) $54,000 Public Records
- 2010-07-12 Sold (MLS) $54,000 REALCOMP
- 2010-07-12 Sold (MLS) $54,000 SW Michigan MLS
- 2010-06-19 Listed $59,900 REALCOMP
- 2010-06-19 Listed $59,900 SW Michigan MLS
- 2010-03-29 Sold (MLS) $18,500 REALCOMP
- 2010-03-29 Sold (MLS) $18,500 SW Michigan MLS
- 2010-02-27 Listed $22,900 REALCOMP
- 2010-02-27 Listed $22,900 SW Michigan MLS
- 2006-09-26 Sold (Public Records) $89,000 Public Records
- 2001-10-01 Sold (Public Records) $62,000 Public Records
Property tax history
-12.3%/yrLatest (2025): $914 · -45.7% YoY. Source: county tax records.
Cash-flow waterfall
monthlySold comps — $/sqft
last 12 mo · ≤1 miLoading sold comps…