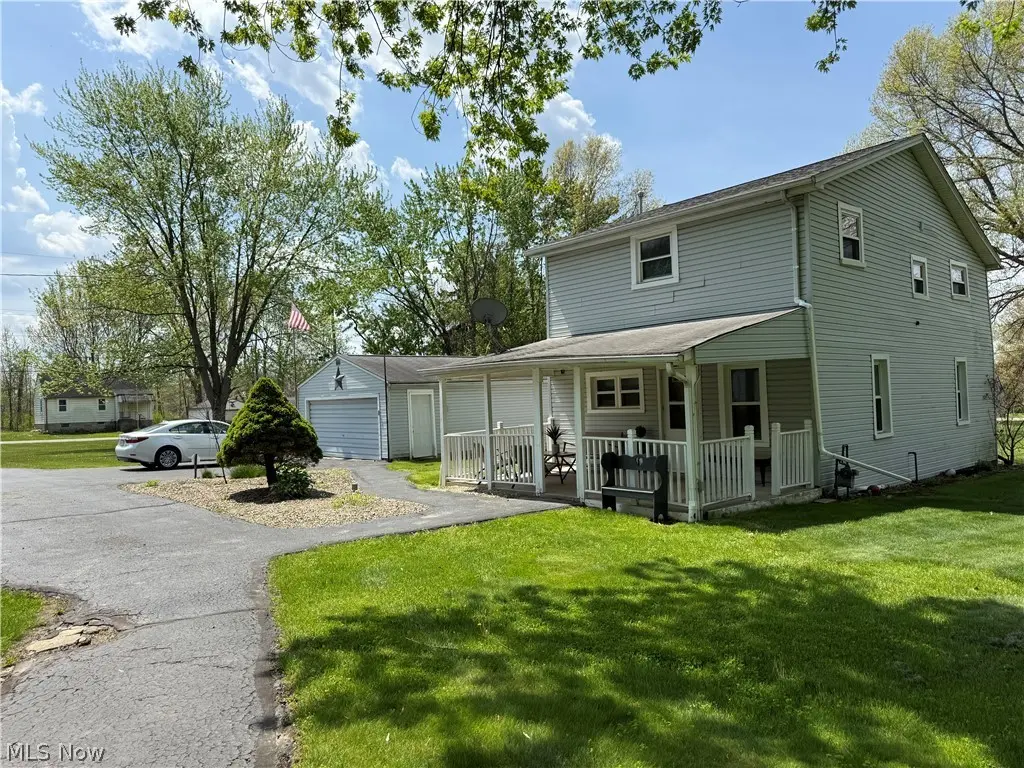
2261 6th St · Hilltop, OH
Flood risk 1/10 · Minimal
- FEMA flood zone
- X (unshaded)
- Chance of flooding over 30 yrs
- 0.0%
- Est. flood insurance / yr
- $507 – $1,088
Fire risk 1/10 · Minimal
- Est. fire insurance / yr
- $713 – $1,323
Heat risk 3/10 · Minor
- Hot days now (above 97°F)
- 7 days/yr
- Hot days in 30 yrs
- 17 days/yr
Wind risk 1/10 · Minimal
- Chance of severe wind over 30 yrs
- —
Air-quality risk 3/10 · Minor
- Unhealthy air days now
- 1 days/yr
- Unhealthy air days in 30 yrs
- 4 days/yr
Risk factors via First Street. Map © Google.
Why this score? — see what drove the B- grade
The composite is a weighted blend of 9 inputs, each scored 0–100. Each bar is that input's sub-score; the figure is the points it added to the 100-point composite (weight × sub-score).
- Cash flow +24.5/30.0
- ARV discount +15.0/15.0
- DSCR +7.9/10.0
- 1% rule +5.8/10.0
- Schools +5.3/10.0
- Livability +3.2/5.0
- Rent growth +2.5/5.0
- Condition / age +2.5/5.0
- Appreciation +0.0/10.0
$134,000
🖨 Deal sheet (PDF) 📄 Offer letter ✓ Due diligence
Listing remarks
Welcome to 2261 Sixth Street McDonald Ohio. This home has everything you want and more. Close to shopping, restaurants and main highway routes. This two story home has 1528 sq ft with 3 bedrooms 1 full bath a first floor laundry and first floor master. A large beautiful park like yard with a huge garage, shed and black top drive. Enjoy the covered porch while drinking your coffee in the morning. This home has a partial basement, newer central air, newer vinyl siding, vinyl windows, totally updated bathroom, freshly painted, Carrier furnace and newer hot water heater. New gas stove and refrigerator. Quiet street to raise a family or enjoy retirement. Close to community park with tennis court
Key facts
- Covered porch
- First floor master
- First floor laundry
Tags
Neighborhood map
What this means for you Summary
Snapshot
- This is a 3-bed/1.0-bath single-family listed at $134k.
Deal economics
- At list price, monthly cash flow is $274 ($3k/yr) — positive.
- The deal already cash-flows at list — no discount required.
- Meets the 1% rule at list price ($1k rent vs $134k).
Location & tenants
- Location reads 63/100 on livability (#820 in OH) — a middle-class / working-renter tenant base. Strengths: cost of living A+, housing A+; Watch: crime C-, amenities F, commute F.
- Mcdonald Local (suburban): math 57% / reading 67% proficiency, ranked #259 of 656 in OH (top 40%) — acceptable for families but not a draw, mixed tenant base, ~2y average lease.
- Zoned schools: Roosevelt Elementary School (math 58% / reading 65%, grade B, #646 of 1,584 statewide, top 41%, 396 students, 42% FRL); Mcdonald High School (math 57% / reading 67%, grade B-, #202 of 781 statewide, top 29%, 349 students, 64% FRL) — zoned schools average 53% FRL vs 27% district-wide (26 pts higher); higher-poverty schools than district average — tighter screening recommended.
- Market conditions: 23 active listings in the ZIP; 1 comparable units currently listed for rent nearby; 129 units permitted in Trumbull County in 2024 (0 in 5+ unit buildings).
Forward outlook
- Local home prices are declining (-3.0%/yr); year-one equity from $926 of loan paydown is wiped out by about $4k of value loss. Plan a longer hold.
- Trumbull County population projected at -22% by 2050 — secular population decline; favor cash flow + early exit over multi-decade hold.
Negotiation context
- Only 1 days on market — expect competitive offers; lowballing is unlikely to land.
- Current owner paid $57k; list at $134k implies a 135% gain — meaningful room to come down on a strong offer.
Risks & watch-outs
- Watch-outs: built in 1940 — expect roof / HVAC / electrical / plumbing capex.
Questions for the listing agent
- Built in 1940 — when were the roof, HVAC, electrical panel, plumbing, and water heater last replaced?
- Is there a deadline driving the sale (1031 exchange, divorce, estate, relocation)? That informs how much negotiation room exists.
- Schools are F-rated, which usually means shorter tenancies and higher turnover. Who's the typical renter profile here, and what's been the actual vacancy rate?
- What's the average days-on-market for RENTAL listings here right now (not sales)? A rising rental-DOM trend means longer vacancies and softer asking-rent achievability than the comps imply.
- What's the recent tenant-quality profile in this submarket — average credit score on applications, eviction rate, late-payment / NSF rate, and stable-employment percentage? A property-management company in the area should have these aggregated.
- How much new for-sale + rental construction is in the pipeline within 1–3 miles? Heavy new supply typically softens prices + rents 12–24 months out; constrained supply supports both.
Investment metrics
- 1% rule
- 1.08% ✓
- Cap rate
- 8.75%
- Cash-on-cash
- 8.77%
- DSCR
- 1.39
- GRM
- 7.7
CMA / ARV
- ARV (on-the-fly)
- $216,976
- Comps found
- 12
Show comp detail 12 sales within ~0.75 mi
| Address | Dist | Beds/Ba | Sqft | Sold | Price | $/sf | Match |
|---|---|---|---|---|---|---|---|
| 2261 6th St | 0.00mi | 3/1.0 | 1,528 (0%) | 1mo | $134,000 | $88 | 99 |
| 2847 Youngstown Ave | 0.32mi | 3/2.0 | 1,500 (-2%) | 2mo | $107,000 | $71 | 77 |
| 814 Florida Ave | 0.54mi | 3/1.0 | 1,508 (-1%) | 3mo | $210,000 | $139 | 70 |
| 3095 Youngstown Ave | 0.30mi | 4/2.0 (+1) | 1,578 (+3%) | 6mo | $247,900 | $157 | 66 |
| 465 Utah Ave | 0.41mi | 3/1.5 | 1,520 (-0%) | 15mo | $239,900 | $158 | 66 |
| 456 Mcdonald Ave | 0.26mi | 2/1.0 (-1) | 1,360 (-11%) | 3mo | $107,500 | $79 | 62 |
| 925 Florida Ave | 0.59mi | 3/2.0 | 1,520 (-0%) | 13mo | $230,000 | $151 | 57 |
| 719 Indiana Ave | 0.69mi | 3/1.5 | 1,506 (-1%) | 9mo | $214,500 | $142 | 56 |
| 325 Nebraska Ave | 0.53mi | 3/2.0 | 1,668 (+9%) | 2mo | $266,000 | $159 | 55 |
| 738 Oregon Ave | 0.40mi | 4/2.0 (+1) | 1,632 (+7%) | 13mo | $289,900 | $178 | 50 |
| 307 W 7th St | 0.59mi | 2/1.0 (-1) | 1,448 (-5%) | 12mo | $130,000 | $90 | 49 |
| 522 Illinois Ave | 0.57mi | 3/2.0 | 1,350 (-12%) | 8mo | $120,000 | $89 | 43 |
Match score weights: distance 35% · size 25% · config 20% · recency 20%. Top-matched comps best support the ARV.
Projected returns pro-forma
-3.0% appreciation · 3.0% rent growth · sell at horizon
- IRR
- -3.0%
- Equity multiple
- 0.89×
- Total profit
- $-4,269
- Equity at exit
- $19,980
- IRR
- 6.7%
- Equity multiple
- 1.50×
- Total profit
- $18,714
- Equity at exit
- $11,586
Cash invested: $37,520 (down + closing). Projections, not guarantees.
Landlord ↔ Tenant lean methodology
- Overall (STATE)
- 73 Landlord-Friendly
- State Ohio
- 73 Landlord-Friendly · R+6
- County
- — inherits STATE
- City
- — inherits STATE
ZIP-level market 44437
- Home prices YoY
- -7.8%
- Active inventory
- 23
- Price-to-rent
- 7.7×
Monthly cashflow live
- Estimated rent
- $1,450 medium interval (Pro) →
- Mortgage (P&I)
- −$703
- Tax from tax record
- −$113 /mo · $1,354/yr
- Insurance
- −$56
- HOA
- −$0
- Vacancy / Maint / Mgmt
- −$304
- Net cashflow
- $274
Break-even live
Sensitivity live
| Price | -10% $350 | -5% $312 | +0% $274 | +5% $236 | +10% $198 |
|---|---|---|---|---|---|
| Rent | -10% $160 | -5% $217 | +0% $274 | +5% $331 | +10% $389 |
| Rate | -1.0pp $342 | -0.5pp $308 | base $274 | +0.5pp $239 | +1.0pp $204 |
UW: 25.0% down · 7.5% · 30yr · 1.5% tax · 5.0% vac · 8.0% maint · 8.0% mgmt
Financing live
Cash to close
- Down payment
- $33,500
- Closing costs
- $4,020
- Reserves months
- —
- Total cash needed
- —
Loan-product check · same deal, 3 products live
Conventional
25% down · 7.5% · 30yr
- Down + closing
- —
- Monthly P&I
- —
- Monthly cashflow
- —
- DSCR
- —
- Eligible?
- —
Personal DTI + credit; lowest rate.
DSCR
20% down · 8.5% · 30yr
- Down + closing
- —
- Monthly P&I
- —
- Monthly cashflow
- —
- DSCR
- —
- Eligible?
- —
No personal income docs; deal must DSCR.
Hard money
10% down · 12.0% · 12mo
- Down + closing
- —
- Monthly P&I
- —
- Monthly cashflow
- —
- DSCR
- —
- Eligible?
- —
Short-term bridge; refi at stabilization.
Rent comps 1 comps
| Address | Beds | Baths | Sqft | Rent | $/sqft | DOM | Units | Dist |
|---|---|---|---|---|---|---|---|---|
| 3504 Oakview Dr Girard, OH | 3.0 | 1.0 | 1276 | $1,450 | $1.14 | 15d | 1 | 1.05mi |
Listing history 3 events
-
2026-04-26status Pending
-
2026-04-25$134,000 Active
-
2026-02-27soldstatus $57,000
ⓘ Source: listings_history table (triggers on properties + properties_extension) + one-shot
backfill from property_details.listing_events for pre-trigger history.
Tax reassessment forecast OH · Partial reset (capped growth)
- Current annual tax
- $1,354 · $113/mo
- Projected year-2 tax
- $1,722 · $144/mo
- Expected delta
- +$368/yr (+$31/mo · 27.2%)
ⓘ Screening estimate from a state-policy table — verify with the county assessor before closing.
Climate risk First Street
- Flood 1/10 Low FEMA zone X (unshaded) · 0% chance over 30 yrs
- Wildfire 1/10 Low
- Heat 3/10 Moderate 7 d/yr ≥97°F today · 17 d/yr by 30 yrs out
- Wind 1/10 Low
- Air quality 3/10 Moderate 1 unhealthy d/yr today · 4 by 30 yrs out
Nearby sold comps map
Loading sold comps map…
Walkable amenities ~0.75 mi
Loading nearby amenities…
Taxation est. · year 1
- Rental income
- $17,400
- − Mortgage interest
- −$7,506
- − Property taxes
- −$1,354
- − Insurance
- −$670
- − Repairs & maintenance
- −$1,392
- − Management
- −$1,392
- − Depreciation
- −$3,898
- Taxable income
- $1,187
- Est. tax owed @ 24.0%
- −$285
- After-tax cash flow
- $3,004/yr
For passive investors: Depreciation is non-cash, so a rental often shows a tax loss while cash-flowing — sheltering income. Rental losses are passive: they offset passive income freely, and up to $25,000/yr can offset ordinary (W-2) income if you actively participate and your MAGI is under $100k (phasing out to $0 by $150k); unused losses carry forward. On sale, claimed depreciation is recaptured at up to 25%, and gains may owe capital-gains tax (a 1031 exchange can defer both). Figures are a year-1 estimate at your 24.0% rate — not tax advice; consult a CPA.
Schools (NCES district)
- District
- Mcdonald Local
- NCES district ID
- 3905022
- Math proficiency
- 57% ▼ -20.00%
- Reading proficiency
- 67% ▼ -11.00%
- Median HH income
- $49,637
- Composite
- 52.66/100
- National rank
- #1554
- State rank
- #259 of 656 in OH
Livability — Hilltop
- Score
- 63/100
- State rank
- #820
- US rank
- #15271
Category grades
Schools grade is shown separately in the Schools card above.
Census & demographics
- Census place
- Hilltop, OH
- County
- Trumbull · 193,293 people
- Metro
- Youngstown-Warren, OH
- Population (ZIP)
- 3,900
- Household income
- $72,545
- Rent vs Own
Population outlook (Trumbull County) Hauer SSP2
- Today (2025)
- 191,696 people
- By 2030
- 184,015 · -4.0%
- By 2040
- 166,810 · -13.0%
- By 2050
- 149,857 · -21.8%
- By 2075
- 115,769 · -39.6%
- By 2100
- 83,617 · -56.4%
Race, ethnicity, and origin ACS 2023
- Neighborhood character
- Predominantly White (98%)
- Race & ethnicity
- White 98% Two or more races 2%
- Common ancestry
- Romanian 7% Scotch-Irish 2% Subsaharan African 2%
- Foreign-born
- 1%
- Languages at home
- 96% English-only · Other Indo-European 3% Spanish 1%
Political lean MEDSL · Trumbull
- 2024 margin
- R (+16.8) · D 41.2% · R 58.0%
- 2008→2024 swing
- -39.2pp toward R · 2008: 22.4pp · 2024: -16.8pp
- All cycles
- 2024: R+16.8 2020: R+10.6 2016: R+6.4 2012: D+22.2 2008: D+22.4
Not yet ingested
- Civics
- —
Market trends
- HPI YoY
- ▼ -20.52%
- Current HPI
- 241.8126
- Rent YoY
- —
- Metro
- —
- State GDP YoY
- ▲ 1.98%
- F500 in state
- 48
Industry mix (Fortune 500 HQ in OH)
| Industry | F500 HQs | Revenue |
|---|---|---|
| Insurance | 3 | $145B |
|
||
| Industrial Machinery | 3 | $49B |
|
||
| Financial Services | 3 | $24B |
|
||
| Consumer Goods | 2 | $93B |
|
||
| Aerospace / Defense | 2 | $47B |
|
||
| Utilities | 2 | $33B |
|
||
Price history
+135.1% since first listed3 events — show timeline
- 2026-04-26 Pending — MLSNOW
- 2026-04-25 Listed $134,000 MLSNOW
- 2026-02-27 Sold (Public Records) $57,000 Public Records
Property tax history
-0.1%/yrLatest (2025): $1,354 · +0.3% YoY. Source: county tax records.
Cash-flow waterfall
monthlySold comps — $/sqft
last 12 mo · ≤1 miLoading sold comps…