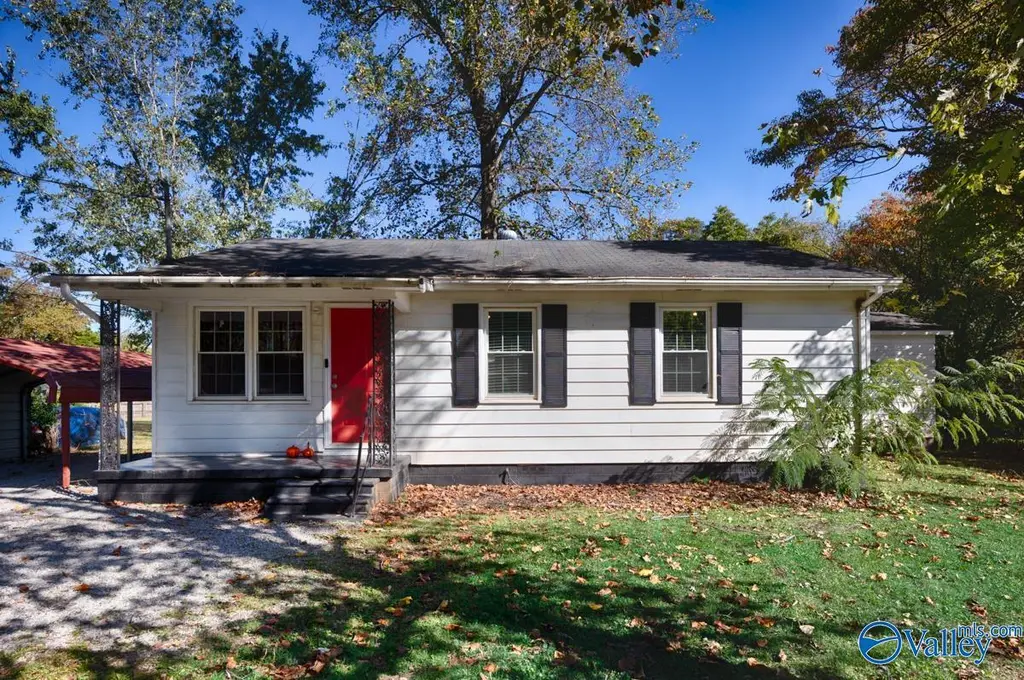
3610 Princess St · Huntsville, AL
Flood risk 1/10 · Minimal
- FEMA flood zone
- X (unshaded)
- Chance of flooding over 30 yrs
- 0.0%
- Est. flood insurance / yr
- $507 – $1,088
Fire risk 1/10 · Minimal
- Est. fire insurance / yr
- $916 – $1,700
Heat risk 5/10 · Moderate
- Hot days now (above 105°F)
- 7 days/yr
- Hot days in 30 yrs
- 19 days/yr
Wind risk 4/10 · Minor
- Chance of severe wind over 30 yrs
- 19.0%
Air-quality risk 2/10 · Minimal
- Unhealthy air days now
- 1 days/yr
- Unhealthy air days in 30 yrs
- 1 days/yr
Risk factors via First Street. Map © Google.
Why this score? — see what drove the C- grade
The composite is a weighted blend of 9 inputs, each scored 0–100. Each bar is that input's sub-score; the figure is the points it added to the 100-point composite (weight × sub-score).
- Cash flow +22.8/30.0
- DSCR +7.3/10.0
- ARV discount +7.3/15.0
- 1% rule +5.2/10.0
- Livability +4.1/5.0
- Schools +2.9/10.0
- Rent growth +2.5/5.0
- Condition / age +2.5/5.0
- Appreciation +0.0/10.0
$143,000
🖨 Deal sheet 📄 Offer letter ✓ Due diligence
Listing remarks
Super cute and cozy 3-bedroom, 2-bath home—perfect for a first-time buyer or investor! Nestled on a large lot with plenty of outdoor space, this charming property offers endless possibilities. Conveniently located just 10 minutes from AAMU, Oakwood University, UAH, and MidCity, you’ll love the easy access to schools, shops, and entertainment. The possibilities are endless—make this your next home or investment today!
Key facts
- Large lot
- Outdoor space
- Easy access to shops
Tags
Property features AI
Finance
- Other: Directions available: N. Pkwy, L Mastin Lake, cross Blue Springs, R on Princess St
- Financial info: Not specified
- HOA & community: No homeowners association; Subdivision: Pecan Grove
Exterior
- Parking: Detached carport
- Security: Not specified
- Utilities: Public sewer
- Home design: Single-family residence; Built in 1958; One story
- Construction: Masonite exterior; No fireplaces listed
- Exterior features: Public water; Lot dimensions approximately 88 x 198; Lot area about 0.4 acres (17,424 sq ft)
Interior
- Kitchen: Range; Dishwasher
- Bedrooms: Not specified
- Flooring: Not specified
- Bathrooms: 2 full bathrooms
- Heating & cooling: Central heating; Central cooling
- Interior features: Crawl space basement; 6 total rooms; One-level layout
- Laundry & utility: Not specified
Neighborhood map
What this means for you Summary
Snapshot
- This is a 3-bed/1.0-bath single-family listed at $143k.
Deal economics
- At list price, monthly cash flow is $249 ($3k/yr) — positive.
- The deal already cash-flows at list — no discount required.
- Meets the 1% rule at list price ($1k rent vs $143k).
- Cap rate 8.4% vs local median 3.8% in Huntsville — top-decile yield for the area; either an underpriced asset or a hidden risk that comps aren't pricing in. Stress-test before assuming the spread holds.
Location & tenants
- Location reads 82/100 on livability (#3 in AL, #1,082 nationally) — a professional / high-income tenant draw. Strengths: commute A+, cost of living A+, housing A+; Watch: crime F.
- Huntsville City (urban): math 21% / reading 46% proficiency, ranked #48 of 129 in AL (top 37%) — families likely to look elsewhere, expect single-tenant / working-renter base with shorter leases.
- Zoned schools: James Dawson Elementary (math 0% / reading 24%, grade F, #536 of 627 statewide, top 88%, 432 students, 88% FRL); Jemison High School (math 12% / reading 12%, grade F, #242 of 305 statewide, top 80%, 843 students, 64% FRL) — zoned schools average 76% FRL vs 46% district-wide (30 pts higher); higher-poverty schools than district average — tighter screening recommended.
- Zoned-school proficiency averages 12% at this address vs 34% district-wide (-21 pts) — the specific schools serving this property underperform the Huntsville City average; the district grade overstates school quality for this exact location.
- Market conditions: Rents soft (-0.1%/yr); 337 active listings in the ZIP; 40 comparable units currently listed for rent nearby; rentals lingering (median 44d on market — plan ~5-8 weeks vacancy on turnover, expect pricing pressure); 65% of comp listings sitting > 30 days — soft ceiling on asking rent; 4,709 units permitted in Madison County in 2024 (1,186 in 5+ unit buildings).
- This rent runs 34% of the median local income ($51k/yr) — at the standard rent-burdened threshold; future hikes will face affordability resistance.
Forward outlook
- Local home prices are declining (-3.0%/yr); year-one equity from $989 of loan paydown is wiped out by about $4k of value loss. Plan a longer hold.
- Madison County population projected at +18% by 2050 — long-run rental-demand tailwind backs the buy-and-hold thesis.
Negotiation context
- Only 9 days on market — expect competitive offers; lowballing is unlikely to land.
- 5 sale attempts since 4y ago with the ask held roughly flat each time — persistent listings suggest the price (not the market) is what's stuck; bring a comps-based counter.
Risks & watch-outs
- Watch-outs: built in 1958 — expect roof / HVAC / electrical / plumbing capex.
- Climate carrying-cost: extreme-heat days projected 7→19/yr by 2055 (HVAC capex compounding) — expect insurance premiums to compound above CPI over the hold.
Questions for the listing agent
- Built in 1958 — when were the roof, HVAC, electrical panel, plumbing, and water heater last replaced?
- Is there a deadline driving the sale (1031 exchange, divorce, estate, relocation)? That informs how much negotiation room exists.
- Crime grade is F in this area — have there been break-ins, vandalism, or insurance claims at this property in the last 3 years? What carrier currently insures it and at what premium?
- What's the average days-on-market for RENTAL listings here right now (not sales)? A rising rental-DOM trend means longer vacancies and softer asking-rent achievability than the comps imply.
- What's the recent tenant-quality profile in this submarket — average credit score on applications, eviction rate, late-payment / NSF rate, and stable-employment percentage? A property-management company in the area should have these aggregated.
- How much new for-sale + rental construction is in the pipeline within 1–3 miles? Heavy new supply typically softens prices + rents 12–24 months out; constrained supply supports both.
Investment metrics
- 1% rule
- 1.02% ✓
- Cap rate
- 8.38%
- Cash-on-cash
- 7.46%
- DSCR
- 1.33
- GRM
- 8.2
CMA / ARV
- ARV (on-the-fly)
- $142,367
- Comps found
- 12
Show comp detail 12 sales within ~0.75 mi
| Address | Dist | Beds/Ba | Sqft | Sold | Price | $/sf | Match |
|---|---|---|---|---|---|---|---|
| 3610 Princess St | 0.00mi | 3/2.0 | 1,117 (-0%) | 1mo | $141,000 | $126 | 95 |
| 3121 Greenhill Dr NW | 0.39mi | 3/1.5 | 1,100 (-2%) | 2mo | $184,000 | $167 | 75 |
| 2906 Hester Ln | 0.58mi | 3/1.0 | 1,113 (-1%) | 2mo | $122,000 | $110 | 70 |
| 3604 NW Knollwood Dr NW | 0.17mi | 3/1.5 | 1,273 (+14%) | 5mo | $183,000 | $144 | 64 |
| 4226 Tee Jay Dr NW | 0.53mi | 3/1.5 | 1,025 (-9%) | 4mo | $145,000 | $141 | 56 |
| 3614 Wilbur Ave NW | 0.66mi | 3/2.0 | 1,196 (+7%) | 2mo | $150,000 | $125 | 52 |
| 4206 Irondale Dr NW | 0.41mi | 2/1.0 (-1) | 1,000 (-11%) | 8mo | $127,000 | $127 | 51 |
| 4227 Keith Dr NW | 0.59mi | 3/2.0 | 1,036 (-8%) | 10mo | $109,000 | $105 | 48 |
| 4209 Eastland Dr NW | 0.66mi | 3/1.5 | 1,014 (-10%) | 10mo | $173,500 | $171 | 43 |
| 2514 Jeri St NW | 0.65mi | 3/1.5 | 1,003 (-10%) | 10mo | $140,000 | $140 | 42 |
| 2709 Oaktree Ln | 0.62mi | 3/1.0 | 1,285 (+15%) | 9mo | $117,800 | $92 | 39 |
| 4710 Lumary Dr NW | 0.71mi | 2/1.5 (-1) | 1,283 (+14%) | 6mo | $160,000 | $125 | 31 |
Match score weights: distance 35% · size 25% · config 20% · recency 20%. Top-matched comps best support the ARV.
Projected returns pro-forma
-3.0% appreciation · 0.0% rent growth · sell at horizon
- IRR
- -8.1%
- Equity multiple
- 0.71×
- Total profit
- $-11,611
- Equity at exit
- $21,322
- IRR
- -2.7%
- Equity multiple
- 0.84×
- Total profit
- $-6,286
- Equity at exit
- $12,364
Cash invested: $40,040 (down + closing). Projections, not guarantees.
Landlord ↔ Tenant lean methodology
- Overall (STATE)
- 90 Strongly Landlord-Friendly
- State Alabama
- 90 Strongly Landlord-Friendly · R+15
- County
- — inherits STATE
- City
- — inherits STATE
ZIP-level market 35810
- Home prices YoY
- -23.5%
- Rents YoY
- -0.1%
- Active inventory
- 337
- Price-to-rent
- 8.2×
Monthly cashflow live
- Estimated rent
- $1,453 high interval (Pro) →
- Mortgage (P&I)
- −$750
- Tax from tax record
- −$89 /mo · $1,072/yr
- Insurance
- −$60
- HOA
- −$0
- Vacancy / Maint / Mgmt
- −$305
- Net cashflow
- $249
Break-even live
UW: 25.0% down · 7.5% · 30yr · 1.5% tax · 5.0% vac · 8.0% maint · 8.0% mgmt
Financing live
Cash to close
- Down payment
- $35,750
- Closing costs
- $4,290
- Reserves months
- —
- Total cash needed
- —
Loan-product check · same deal, 3 products live
Conventional
25% down · 7.5% · 30yr
- Down + closing
- —
- Monthly P&I
- —
- Monthly cashflow
- —
- DSCR
- —
- Eligible?
- —
Personal DTI + credit; lowest rate.
DSCR
20% down · 8.5% · 30yr
- Down + closing
- —
- Monthly P&I
- —
- Monthly cashflow
- —
- DSCR
- —
- Eligible?
- —
No personal income docs; deal must DSCR.
Hard money
10% down · 12.0% · 12mo
- Down + closing
- —
- Monthly P&I
- —
- Monthly cashflow
- —
- DSCR
- —
- Eligible?
- —
Short-term bridge; refi at stabilization.
Rent comps 40 comps
| Address | Beds | Baths | Sqft | Rent | $/sqft | DOM | Units | Dist |
|---|---|---|---|---|---|---|---|---|
| 3601 Fay St NW Huntsville, AL | 2.0 | 1.0 | 972 | $1,195 | $1.23 | 44d | 1 | 0.15mi |
| 3505 Mastin Lake Rd NW Huntsville, AL | 3.0 | 2.0 | 1376 | $2,000 | $1.45 | 44d | 1 | 0.43mi |
| 3205 Lewisburg Dr NW Huntsville, AL | 3.0 | 2.0 | 1408 | $1,600 | $1.14 | 23d | 1 | 0.54mi |
| 2803 Hester Ln NW Huntsville, AL | 3.0 | 1.5 | 1224 | $1,400 | $1.14 | 23d | 1 | 0.61mi |
| 3803 Mastin Lake Rd NW Huntsville, AL | 3.0 | 1.0 | 1103 | $1,295 | $1.17 | 44d | 1 | 0.65mi |
| 2506 Jeri St NW Huntsville, AL | 3.0 | 1.5 | 1274 | $1,400 | $1.10 | 23d | 1 | 0.66mi |
| 3614 Wilbur Ave NW Huntsville, AL | 3.0 | 1.5 | 1196 | $1,420 | $1.19 | 23d | 1 | 0.68mi |
| 3708 Valleydale Rd NW Huntsville, AL | 3.0 | 1.5 | 1136 | $1,350 | $1.19 | 44d | 1 | 0.76mi |
| 4114 Blue Spring Rd NW Huntsville, AL | 3.0 | 2.0 | 1100 | $1,500 | $1.36 | 23d | 1 | 0.76mi |
| 3203 Dyas Dr NW Huntsville, AL | 3.0 | 2.0 | 1346 | $2,100 | $1.56 | 23d | 1 | 0.78mi |
| 3013 Kirkland Dr NW Huntsville, AL | 3.0 | 1.5 | 1324 | $1,295 | $0.98 | 44d | 1 | 0.79mi |
| 3210 Tucker Dr NW Huntsville, AL | 3.0 | 1.0 | 1005 | $1,475 | $1.47 | 14d | 1 | 0.81mi |
| 3706 Wilbanks Dr NW Huntsville, AL | 3.0 | 1.0 | 1000 | $1,300 | $1.30 | 44d | 1 | 0.84mi |
| 2519 Birchfield St NW Huntsville, AL | 3.0 | 1.5 | 1125 | $1,195 | $1.06 | 44d | 1 | 0.85mi |
| 3415 Mimosa Ln NW Huntsville, AL | 3.0 | 2.0 | 1320 | $1,590 | $1.20 | 44d | 1 | 0.85mi |
| 3304 Caywood Dr NW Huntsville, AL | 3.0 | 1.5 | 1300 | $1,475 | $1.13 | 23d | 1 | 0.90mi |
| 3210 Caywood Dr NW Huntsville, AL | 3.0 | 1.0 | 1005 | $1,475 | $1.47 | 14d | 1 | 0.94mi |
| 2708 Monticello Dr NW Huntsville, AL | 3.0 | 1.0 | 1025 | $1,350 | $1.32 | 44d | 1 | 1.08mi |
| 2708 Monticello Dr NW Huntsville, AL | 3.0 | 1.0 | 1025 | $1,300 | $1.27 | 23d | 1 | 1.08mi |
| 5003 Stag Run Cir NW Huntsville, AL | 3.0 | 2.0 | 1410 | $1,450 | $1.03 | 14d | 1 | 1.09mi |
| 2640 Blue Spring Rd NW Huntsville, AL | 1.0–3.0 | 1.0–2.0 | 944 | $1,149 | $1.22 | 44d | 3 | 1.10mi |
| 3309 Charleston Ave NW Huntsville, AL | 3.0 | 2.0 | 1425 | $1,375 | $0.96 | 21d | 1 | 1.10mi |
| 3410 Elizabeth St NW Apt 7 Huntsville, AL | 2.0 | 1.0 | 800 | $799 | $1.00 | 44d | 1 | 1.11mi |
| 3410 Elizabeth St NW Unit 2 Huntsville, AL | 2.0 | 1.0 | 800 | $850 | $1.06 | 44d | 1 | 1.11mi |
| 2401 Mount Vernon Rd NW Huntsville, AL | 3.0 | 1.0 | 950 | $1,045 | $1.10 | 44d | 1 | 1.12mi |
| 2219 Jonathan Dr NW Apt C Huntsville, AL | 2.0 | 1.5 | 850 | $850 | $1.00 | 44d | 1 | 1.19mi |
| 2416 Hanover Dr NW Huntsville, AL | 3.0 | 2.0 | 1300 | $1,395 | $1.07 | 44d | 1 | 1.24mi |
| 2206 Harris Rd NW Huntsville, AL | 3.0 | 1.0 | 1354 | $1,400 | $1.03 | 44d | 1 | 1.29mi |
| 2728 Clayton Dr NW Unit B Huntsville, AL | 2.0 | 1.0 | 900 | $795 | $0.88 | 44d | 1 | 1.29mi |
| 5025 Blue Spring Rd NW Huntsville, AL | 3.0 | 2.5 | 1273 | $1,195 | $0.94 | 14d | 2 | 1.32mi |
| 4802 Proctor Cir NW Huntsville, AL | 3.0 | 1.0 | 1000 | $1,250 | $1.25 | 44d | 1 | 1.32mi |
| 2721 Clayton Dr NW Huntsville, AL | 3.0 | 1.0 | 1000 | $998 | $1.00 | 44d | 1 | 1.33mi |
| 3423 Rosedale Dr NW Huntsville, AL | 3.0 | 1.0 | 1145 | $1,000 | $0.87 | 44d | 1 | 1.33mi |
| 2711 Clayton Dr NW Huntsville, AL | 3.0 | 1.5 | 1030 | $1,400 | $1.36 | 44d | 1 | 1.33mi |
| 3014 Winchester Rd NW Huntsville, AL | 2.0 | 2.0 | 1480 | $2,500 | $1.69 | 44d | 1 | 1.33mi |
| 2433 Shepherd Dr NW Huntsville, AL | 3.0 | 1.0 | 864 | $1,300 | $1.50 | 44d | 1 | 1.36mi |
| 2415 Vining Ave NW Huntsville, AL | 3.0 | 1.0 | 1079 | $1,250 | $1.16 | 14d | 1 | 1.38mi |
| 3721 Broadmor Rd NW Huntsville, AL | 3.0 | 1.5 | 1423 | $1,450 | $1.02 | 44d | 1 | 1.40mi |
| 2215 Shady Lane Dr NW Huntsville, AL | 4.0 | 1.0 | 1450 | $1,500 | $1.03 | 44d | 1 | 1.41mi |
| 2502 Hill St NW Huntsville, AL | 3.0 | 1.0 | 1288 | $1,200 | $0.93 | 44d | 1 | 1.42mi |
Listing history 19 events
-
2026-05-01status Pending
-
2026-04-22$143,000 Active
-
2026-04-01historical
-
2026-03-20price $147,500
-
2026-02-06price $148,500
-
2026-01-31price $148,800
-
2026-01-05price $149,000
-
2025-12-08price $150,900
-
2025-11-28price $151,000
-
2025-11-19status Active
-
2025-10-28status Pending
-
2025-10-23$152,000 Active
-
2025-05-01price $159,000
-
2025-03-31$165,000 Active
-
2022-07-14soldstatus $150,000 Sold
-
2022-07-01soldstatus $150,000
-
2022-06-09status Pending
-
2022-06-03$150,000 Active
-
2020-01-07soldstatus $50,500
ⓘ Source: listings_history table (triggers on properties + properties_extension) + one-shot
backfill from property_details.listing_events for pre-trigger history.
Tax reassessment forecast AL · Resets to sale price
- Current annual tax
- $1,072 · $89/mo
- Projected year-2 tax
- $1,072 · $89/mo
- Expected delta
- $0/yr ($0/mo · 0.0%)
ⓘ Screening estimate from a state-policy table — verify with the county assessor before closing.
Climate risk First Street
- Flood 1/10 Low FEMA zone X (unshaded) · 0% chance over 30 yrs
- Wildfire 1/10 Low
- Heat 5/10 Major 7 d/yr ≥105°F today · 19 d/yr by 30 yrs out
- Wind 4/10 Moderate 19% chance of damaging wind over 30 yrs
- Air quality 2/10 Low 1 unhealthy d/yr today · 1 by 30 yrs out
Nearby sold comps map
Loading sold comps map…
Walkable amenities ~0.75 mi
Loading nearby amenities…
Taxation est. · year 1
- Rental income
- $17,433
- − Mortgage interest
- −$8,010
- − Property taxes
- −$1,072
- − Insurance
- −$715
- − Repairs & maintenance
- −$1,395
- − Management
- −$1,395
- − Depreciation
- −$4,160
- Taxable income
- $687
- Est. tax owed @ 24.0%
- −$165
- After-tax cash flow
- $2,822/yr
For passive investors: Depreciation is non-cash, so a rental often shows a tax loss while cash-flowing — sheltering income. Rental losses are passive: they offset passive income freely, and up to $25,000/yr can offset ordinary (W-2) income if you actively participate and your MAGI is under $100k (phasing out to $0 by $150k); unused losses carry forward. On sale, claimed depreciation is recaptured at up to 25%, and gains may owe capital-gains tax (a 1031 exchange can defer both). Figures are a year-1 estimate at your 24.0% rate — not tax advice; consult a CPA.
Schools (NCES district)
- District
- Huntsville City
- NCES district ID
- 0101800
- Math proficiency
- 21% ▼ -23.00%
- Reading proficiency
- 46% ▬ 0.00%
- Median HH income
- $48,264
- Composite
- 28.84/100
- National rank
- #6647
- State rank
- #48 of 129 in AL
Livability — Huntsville
- Score
- 82/100
- State rank
- #3
- US rank
- #1082
Category grades
Schools grade is shown separately in the Schools card above.
Census & demographics
- Census place
- Huntsville, AL
- County
- Madison County · 380,832 people
- City population
- 220,435
- Metro
- Huntsville, AL
- Population (ZIP)
- 32,843
- Household income
- $51,233
- Rent vs Own
- Severe rent burden
- 1223.0
Population outlook (Madison County) Hauer SSP2
- Today (2025)
- 392,086 people
- By 2030
- 409,788 · +4.5%
- By 2040
- 440,557 · +12.4%
- By 2050
- 460,990 · +17.6%
- By 2075
- 502,872 · +28.3%
- By 2100
- 513,623 · +31.0%
Race, ethnicity, and origin ACS 2023
- Neighborhood character
- Predominantly Black (69%)
- Race & ethnicity
- Black 69% White 18% Hispanic / Latino 9% Two or more races 5%
- Hispanic origin (detail)
- Mexican 3% Puerto Rican 2% Dominican 2%
- Common ancestry
- Italian 2% Lithuanian 0%
- Foreign-born
- 6% · Canada
- Languages at home
- 92% English-only · Spanish 7%
Political lean MEDSL · Madison
- 2024 margin
- Lean R (+9.0) · D 44.7% · R 53.7% · Other 1.6%
- 2008→2024 swing
- +6.0pp toward D · 2008: -14.9pp · 2024: -9.0pp
- All cycles
- 2024: R+9.0 2020: R+8.0 2016: R+16.8 2012: R+18.7 2008: R+14.9
Not yet ingested
- Civics
- —
Market trends
- HPI YoY
- ▼ -61.00%
- Current HPI
- 198.9629
- Rent YoY
- ▬ -0.05%
- Metro
- Huntsville, AL
- State GDP YoY
- ▲ 2.94%
- F500 in state
- 4
Industry mix (Fortune 500 HQ in AL)
| Industry | F500 HQs | Revenue |
|---|---|---|
| Financial Services | 1 | $8B |
|
||
| Healthcare | 1 | $5B |
|
||
Price history
+183.2% since first listed19 events — show timeline
- 2026-05-01 Pending — VMLS
- 2026-04-22 Listed $143,000 VMLS
- 2026-04-01 Delisted — VMLS
- 2026-03-20 Price Changed $147,500 VMLS
- 2026-02-06 Price Changed $148,500 VMLS
- 2026-01-31 Price Changed $148,800 VMLS
- 2026-01-05 Price Changed $149,000 VMLS
- 2025-12-08 Price Changed $150,900 VMLS
- 2025-11-28 Price Changed $151,000 VMLS
- 2025-11-19 Relisted — VMLS
- 2025-10-28 Pending — VMLS
- 2025-10-23 Listed $152,000 VMLS
- 2025-05-01 Price Changed $159,000 VMLS
- 2025-03-31 Listed $165,000 VMLS
- 2022-07-14 Sold (MLS) $150,000 VMLS
- 2022-07-01 Sold (Public Records) $150,000 Public Records
- 2022-06-09 Pending — VMLS
- 2022-06-03 Listed $150,000 VMLS
- 2020-01-07 Sold (Public Records) $50,500 Public Records
Property tax history
+6.5%/yrLatest (2024): $1,072 · +2.4% YoY. Source: county tax records.
Cash-flow waterfall
monthlySold comps — $/sqft
last 12 mo · ≤1 miLoading sold comps…