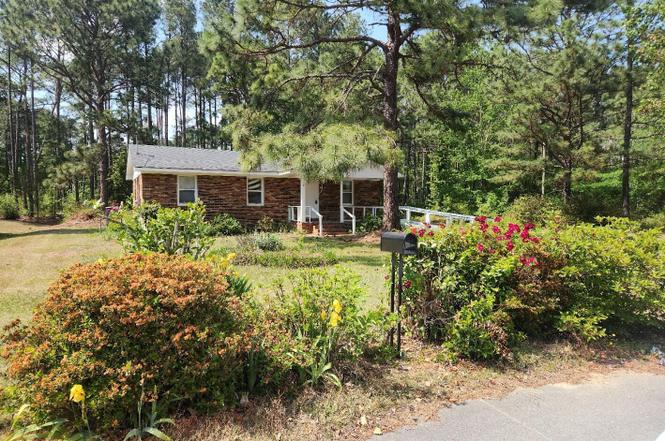
616 N Pine St · Roseboro, NC
Flood risk 1/10 · Minimal
- FEMA flood zone
- X (unshaded)
- Chance of flooding over 30 yrs
- 0.0%
- Est. flood insurance / yr
- $507 – $1,088
Fire risk 4/10 · Minor
- Est. fire insurance / yr
- $906 – $1,684
Heat risk 7/10 · Major
- Hot days now (above 106°F)
- 7 days/yr
- Hot days in 30 yrs
- 16 days/yr
Wind risk 8/10 · Major
- Chance of severe wind over 30 yrs
- 80.0%
Air-quality risk 1/10 · Minimal
- Unhealthy air days now
- 0 days/yr
- Unhealthy air days in 30 yrs
- 0 days/yr
Risk factors via First Street. Map © Google.
Why this score? — see what drove the B- grade
The composite is a weighted blend of 9 inputs, each scored 0–100. Each bar is that input's sub-score; the figure is the points it added to the 100-point composite (weight × sub-score).
- Cash flow +24.3/30.0
- Appreciation +9.1/10.0
- DSCR +7.8/10.0
- ARV discount +7.5/15.0
- 1% rule +6.3/10.0
- Schools +3.4/10.0
- Livability +3.1/5.0
- Rent growth +2.5/5.0
- Condition / age +2.5/5.0
$165,000
🖨 Deal sheet 📄 Offer letter ✓ Due diligence
Listing remarks
This refreshed 3-bedroom Roseboro home will make a great first starter home. Sitting on over half an acre, this property has been completely revitalized inside and out. Updated Cabinets & New Flooring Throughout Walls touched up & Modern Lighting installed Deep Cleaned & Move-In Ready Sold AS-IS, no HOA, Conveniently located just minutes from downtown Roseboro and nearby schools, shopping, and dining.
Key facts
- Laminate flooring
- Spacious lot
- Conveniently located
Tags
Property features AI
Exterior
- Parking: Paved parking
- Utilities: Public water; Public sewer; Water connected
- Home design: Single-family residence; One story; Entry level: 1
- Construction: Brick construction; Construction details: see remarks
- Exterior features: Porch; Composition roof; Has a view; Paved road frontage; Roads: City street and state road; Lot dimensions approximately 249 x 138 x 132 x 47 x 24; Zoned R-15
Interior
- Bedrooms: Total rooms: 6
- Bathrooms: 1 full bathroom
- Heating & cooling: Heat pump heating; Electric heating; Heat pump cooling
- Interior features: Ceiling fan(s); Window coverings; Crawl space basement
Neighborhood map
What this means for you Summary
Snapshot
- This is a 3-bed/1.0-bath single-family listed at $165k.
Deal economics
- At list price, monthly cash flow is $332 ($4k/yr) — positive.
- The deal already cash-flows at list — no discount required.
- Meets the 1% rule at list price ($2k rent vs $165k).
- Recommended offer: $145k (12.0% below list) — sets the bar for market timing.
Location & tenants
- Location reads 62/100 on livability (#445 in NC) — a middle-class / working-renter tenant base. Strengths: cost of living A+, crime A, housing A-; Watch: amenities F, commute F, employment F.
- Sampson County Schools (rural): math 40% / reading 41% proficiency, ranked #114 of 178 in NC (top 64%) — families likely to look elsewhere, expect single-tenant / working-renter base with shorter leases; 74% free/reduced lunch — lower-income household profile, screen leases tightly.
- Zoned schools: Roseboro Elementary (math 27% / reading 32%, grade F, #975 of 1,410 statewide, top 71%, 387 students, 99% FRL); Roseboro-Salemburg Middle (math 24% / reading 32%, grade F, #360 of 475 statewide, top 77%, 406 students, 99% FRL); Lakewood High (math 72% / reading 42%, grade C, #248 of 535 statewide, top 48%, 479 students, 99% FRL) — zoned schools average 99% FRL vs 74% district-wide (26 pts higher); higher-poverty schools than district average — tighter screening recommended.
- Market conditions: 42 active listings in the ZIP; 189 units permitted in Sampson County in 2024 (0 in 5+ unit buildings).
Forward outlook
- In year one you build about $15k of equity ($1k loan paydown + $14k appreciation (8.3% local appreciation)).
- Sampson County population projected to shrink 5% by 2050 — rents likely to lag national; underwrite the cash flow, not the appreciation.
- At projected returns (8.3% appreciation + 3.0% rent growth), your $46k cash investment doubles in ~3 years — after that, you're playing with house money.
- By year 3, paydown + projected appreciation supports a ~$37k cash-out refi (75% LTV) — recoverable capital for the next deal without selling this one.
Negotiation context
- It's been on market 197 days — a 12% lower offer ($145k) is reasonable based on typical stale-listing flexibility.
Risks & watch-outs
- Climate carrying-cost: severe wind risk, 80% chance of damaging wind over 30y; extreme-heat days projected 7→16/yr by 2055 (HVAC capex compounding) — expect insurance premiums to compound above CPI over the hold.
Questions for the listing agent
- It's been on market 197 days. Have you received any prior offers? Is the seller open to a 12% concession, seller financing, or rate buy-down credit?
- Built in 1979 — when were the roof, HVAC, electrical panel, plumbing, and water heater last replaced?
- Why hasn't it sold? Are there any deal-killer items the seller is aware of (foundation, flood, title, zoning, code violations)?
- Is there a deadline driving the sale (1031 exchange, divorce, estate, relocation)? That informs how much negotiation room exists.
- Schools are D-rated, which usually means shorter tenancies and higher turnover. Who's the typical renter profile here, and what's been the actual vacancy rate?
- What's the average days-on-market for RENTAL listings here right now (not sales)? A rising rental-DOM trend means longer vacancies and softer asking-rent achievability than the comps imply.
- What's the recent tenant-quality profile in this submarket — average credit score on applications, eviction rate, late-payment / NSF rate, and stable-employment percentage? A property-management company in the area should have these aggregated.
- How much new for-sale + rental construction is in the pipeline within 1–3 miles? Heavy new supply typically softens prices + rents 12–24 months out; constrained supply supports both.
Investment metrics
- 1% rule
- 1.13% ✓
- Cap rate
- 8.71%
- Cash-on-cash
- 8.63%
- DSCR
- 1.38
- GRM
- 7.4
CMA / ARV
No comps found within radius.
Projected returns pro-forma
8.27% appreciation · 3.0% rent growth · sell at horizon
- IRR
- 27.2%
- Equity multiple
- 2.99×
- Total profit
- $92,027
- Equity at exit
- $128,393
- IRR
- 24.3%
- Equity multiple
- 6.44×
- Total profit
- $251,489
- Equity at exit
- $257,814
Cash invested: $46,200 (down + closing). Projections, not guarantees.
Landlord ↔ Tenant lean methodology
- Overall (STATE)
- 85 Strongly Landlord-Friendly
- State North Carolina
- 85 Strongly Landlord-Friendly · R+3
- County
- — inherits STATE
- City
- — inherits STATE
ZIP-level market 28382
- Home prices YoY
- 3.0%
- Active inventory
- 42
- Price-to-rent
- 7.4×
Monthly cashflow live
- Estimated rent
- $1,864 medium interval (Pro) →
- Mortgage (P&I)
- −$865
- Tax est. 1.5%
- −$206 /mo · $2,475/yr
- Insurance
- −$69
- HOA
- −$0
- Vacancy / Maint / Mgmt
- −$391
- Net cashflow
- $332
Break-even live
UW: 25.0% down · 7.5% · 30yr · 1.5% tax · 5.0% vac · 8.0% maint · 8.0% mgmt
Financing live
Cash to close
- Down payment
- $41,250
- Closing costs
- $4,950
- Reserves months
- —
- Total cash needed
- —
Loan-product check · same deal, 3 products live
Conventional
25% down · 7.5% · 30yr
- Down + closing
- —
- Monthly P&I
- —
- Monthly cashflow
- —
- DSCR
- —
- Eligible?
- —
Personal DTI + credit; lowest rate.
DSCR
20% down · 8.5% · 30yr
- Down + closing
- —
- Monthly P&I
- —
- Monthly cashflow
- —
- DSCR
- —
- Eligible?
- —
No personal income docs; deal must DSCR.
Hard money
10% down · 12.0% · 12mo
- Down + closing
- —
- Monthly P&I
- —
- Monthly cashflow
- —
- DSCR
- —
- Eligible?
- —
Short-term bridge; refi at stabilization.
Listing history 20 events
-
2026-06-18days on market $165,000 Active 197 DOM
-
2026-06-17days on market $165,000 Active 196 DOM
-
2026-06-16days on market $165,000 Active 195 DOM
-
2026-06-15days on market $165,000 Active 194 DOM
-
2026-06-14days on market $165,000 Active 192 DOM
-
2026-06-13days on market $165,000 Active 191 DOM
-
2026-06-10days on market $165,000 Active 189 DOM
-
2026-06-09days on market $165,000 Active 188 DOM
-
2026-06-08days on market $165,000 Active 187 DOM
-
2026-06-07days on market $165,000 Active 186 DOM
-
2026-06-05days on market $165,000 Active 183 DOM
-
2026-06-03days on market $165,000 Active 182 DOM
-
2026-06-02days on market $165,000 Active 181 DOM
-
2026-06-01days on market $165,000 Active 180 DOM
-
2026-05-31days on market $165,000 Active 179 DOM
-
2026-05-30days on market $165,000 Active 178 DOM
-
2026-04-24price $169,000
-
2026-01-23price $170,000
-
2025-12-18price $175,000
-
2025-12-03$180,000 Active
ⓘ Source: listings_history table (triggers on properties + properties_extension) + one-shot
backfill from property_details.listing_events for pre-trigger history.
Climate risk First Street
- Flood 1/10 Low FEMA zone X (unshaded) · 0% chance over 30 yrs
- Wildfire 4/10 Moderate
- Heat 7/10 Severe 7 d/yr ≥106°F today · 16 d/yr by 30 yrs out
- Wind 8/10 Severe 80% chance of damaging wind over 30 yrs
- Air quality 1/10 Low 0 unhealthy d/yr today · 0 by 30 yrs out
Nearby sold comps map
Loading sold comps map…
Walkable amenities ~0.75 mi
Loading nearby amenities…
Taxation est. · year 1
- Rental income
- $22,370
- − Mortgage interest
- −$9,243
- − Property taxes
- −$2,475
- − Insurance
- −$825
- − Repairs & maintenance
- −$1,790
- − Management
- −$1,790
- − Depreciation
- −$4,800
- Taxable income
- $1,448
- Est. tax owed @ 24.0%
- −$348
- After-tax cash flow
- $3,641/yr
For passive investors: Depreciation is non-cash, so a rental often shows a tax loss while cash-flowing — sheltering income. Rental losses are passive: they offset passive income freely, and up to $25,000/yr can offset ordinary (W-2) income if you actively participate and your MAGI is under $100k (phasing out to $0 by $150k); unused losses carry forward. On sale, claimed depreciation is recaptured at up to 25%, and gains may owe capital-gains tax (a 1031 exchange can defer both). Figures are a year-1 estimate at your 24.0% rate — not tax advice; consult a CPA.
Schools (NCES district)
- District
- Sampson County Schools
- NCES district ID
- 3704140
- Math proficiency
- 40% ▼ -6.00%
- Reading proficiency
- 41% ▼ -6.00%
- Median HH income
- $37,391
- Composite
- 33.71/100
- National rank
- #5379
- State rank
- #114 of 178 in NC
Livability — Roseboro
- Score
- 62/100
- State rank
- #445
- US rank
- #16397
Category grades
Schools grade is shown separately in the Schools card above.
Census & demographics
- Census place
- Roseboro, NC
- Population (ZIP)
- 6,659
Population outlook (Sampson County) Hauer SSP2
- Today (2025)
- 63,499 people
- By 2030
- 62,970 · -0.8%
- By 2040
- 61,609 · -3.0%
- By 2050
- 60,462 · -4.8%
- By 2075
- 60,108 · -5.3%
- By 2100
- 62,120 · -2.2%
Race, ethnicity, and origin ACS 2023
- Neighborhood character
- Diverse neighborhood (Simpson 0.58)
- Race & ethnicity
- White 60% Black 22% Hispanic / Latino 14% Two or more races 11%
- Hispanic origin (detail)
- Mexican 2%
- Common ancestry
- Slovak 2% Romanian 1% Serbian 1%
- Foreign-born
- 9% · Canada
- Languages at home
- 87% English-only · Spanish 12% Other Asian/Pacific 1%
Political lean MEDSL · Sampson
- 2024 margin
- Strong R (+29.8) · D 34.8% · R 64.6%
- 2008→2024 swing
- -21.3pp toward R · 2008: -8.4pp · 2024: -29.8pp
- All cycles
- 2024: R+29.8 2020: R+22.5 2016: R+16.7 2012: R+11.0 2008: R+8.4
Not yet ingested
- Civics
- —
Market trends
- HPI YoY
- ▲ 8.27%
- Current HPI
- 288.151
- Rent YoY
- —
- Metro
- —
- State GDP YoY
- ▲ 3.28%
- F500 in state
- 26
Industry mix (Fortune 500 HQ in NC)
| Industry | F500 HQs | Revenue |
|---|---|---|
| Financial Services | 2 | $213B |
|
||
| Retail | 2 | $95B |
|
||
| Industrial Conglomerate | 1 | $38B |
|
||
| Metals / Steel | 1 | $35B |
|
||
| Utilities | 1 | $30B |
|
||
| Industrial Machinery | 1 | $19B |
|
||
Price history
-6.1% since first listed4 events — show timeline
- 2026-04-24 Price Changed $169,000 Hive MLS
- 2026-01-23 Price Changed $170,000 Hive MLS
- 2025-12-18 Price Changed $175,000 Hive MLS
- 2025-12-03 Listed $180,000 Hive MLS
Cash-flow waterfall
monthlySold comps — $/sqft
last 12 mo · ≤1 miLoading sold comps…