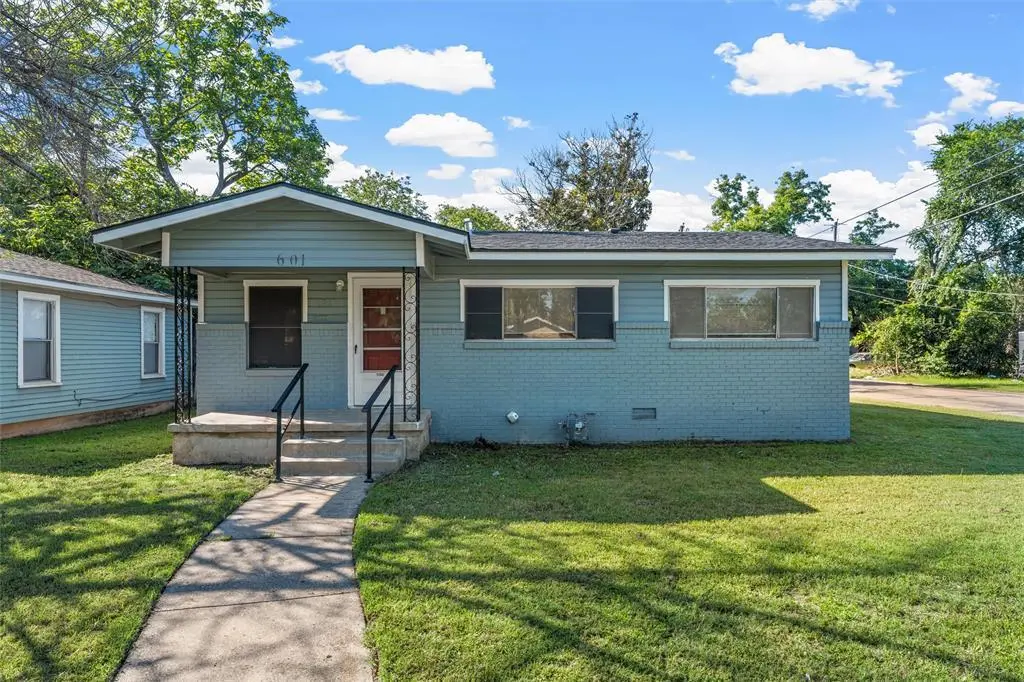
601 Lenox St · Waco, TX
Flood risk 5/10 · Moderate
- FEMA flood zone
- X (unshaded)
- Chance of flooding over 30 yrs
- 0.27%
- Est. flood insurance / yr
- $507 – $1,088
Fire risk 4/10 · Minor
- Est. fire insurance / yr
- $1,222 – $2,270
Heat risk 7/10 · Major
- Hot days now (above 109°F)
- 7 days/yr
- Hot days in 30 yrs
- 24 days/yr
Wind risk 6/10 · Moderate
- Chance of severe wind over 30 yrs
- 60.0%
Air-quality risk 2/10 · Minimal
- Unhealthy air days now
- 0 days/yr
- Unhealthy air days in 30 yrs
- 1 days/yr
Risk factors via First Street. Map © Google.
Why this score? — see what drove the C- grade
The composite is a weighted blend of 9 inputs, each scored 0–100. Each bar is that input's sub-score; the figure is the points it added to the 100-point composite (weight × sub-score).
- Cash flow +20.0/30.0
- DSCR +6.4/10.0
- 1% rule +5.7/10.0
- ARV discount +5.0/15.0
- Livability +3.7/5.0
- Appreciation +2.5/10.0
- Rent growth +2.5/5.0
- Condition / age +2.5/5.0
- Schools +1.8/10.0
$129,000
🖨 Deal sheet 📄 Offer letter ✓ Due diligence
Listing remarks
Your Affordable Corner Lot Dream: Move-In Ready Starter Home in Prime Waco Location! Stop renting and start building equity with this perfectly positioned corner lot home. Boasting move-in ready status, this charming starter home offers immediate comfort and exceptional value. Essential appliances are included, featuring the refrigerator and stove, making your transition seamless. Enjoy year-round comfort with a new window unit and a ceiling fan installed in each room. 1 Location is everything! You'll be just minutes from all the best of Waco, including downtown visitor hot spots, Baylor University, area schools, shopping, the famous Magnolia Market, and countless local restaurants. This
Key facts
- New window unit
- Move in ready
- Prime location
Tags
Property features AI
Finance
- Other: Municipal utility district not present
- Financial info: Treat as clear loan type; No second mortgage indicated
- HOA & community: No homeowners association
Exterior
- Parking: No covered or carport spaces; No designated parking features
- Utilities: City water; City sewer; Individual gas meter
- Home design: Single-family residence; One level; Property attached
- Construction: Brick and wood construction; Built in 1962; Preowned
- Exterior features: Lot in Carver Park subdivision; Lot less than 0.5 acre
Interior
- Kitchen: Electric range; Refrigerator; Vented exhaust fan
- Bedrooms: 3 bedrooms (all on the main level)
- Flooring: Vinyl flooring
- Bathrooms: 1 full bathroom
- Heating & cooling: Window unit(s) cooling; Other heating
- Interior features: Cable TV available; Window coverings
- Laundry & utility: Washer hookup in kitchen; Electric dryer hookup
Neighborhood map
What this means for you Summary
Snapshot
- This is a 3-bed/1.0-bath single-family listed at $129k.
Deal economics
- At list price, monthly cash flow is $159 ($2k/yr) — positive.
- The deal already cash-flows at list — no discount required.
- Meets the 1% rule at list price ($1k rent vs $129k).
- Recommended offer: $127k (1.5% below list) — sets the bar for market timing.
- Cap rate 7.8% vs local median 3.9% in Waco — top-decile yield for the area; either an underpriced asset or a hidden risk that comps aren't pricing in. Stress-test before assuming the spread holds.
Location & tenants
- Location reads 74/100 on livability (#166 in TX, #4,378 nationally) — a middle-class / working-renter tenant base. Strengths: cost of living A+, housing A+, health & safety A+; Watch: schools D, crime D, commute F.
- Waco ISD (urban): math 20% / reading 24% proficiency, ranked #773 of 826 in TX (top 94%) — low school quality limits family demand, transient renter base, plan for 1-2y turnover; 81% free/reduced lunch — lower-income household profile, screen leases tightly.
- Market conditions: 86 active listings in the ZIP; 21 comparable units currently listed for rent nearby; rentals at typical pace (median 21d on market — plan ~3-4 weeks tenant-placement turnaround); lower-income renter base — watch delinquency; 1,014 units permitted in McLennan County in 2024 (200 in 5+ unit buildings).
- At $1,386/mo this rent would consume 55% of the median local household income ($30k/yr) (locally 603% of renters already pay >50% of income on rent) — very limited rent-growth headroom before tenants either downsize or default.
Forward outlook
- Local home prices are declining (-3.0%/yr); year-one equity from $892 of loan paydown is wiped out by about $4k of value loss. Plan a longer hold.
- McLennan County population projected at +17% by 2050 — long-run rental-demand tailwind backs the buy-and-hold thesis.
Negotiation context
- It's been on market 15 days — a 2% lower offer ($127k) is reasonable based on typical stale-listing flexibility.
Risks & watch-outs
- Climate carrying-cost: moderate flood risk; major wind risk, 60% chance of damaging wind over 30y; extreme-heat days projected 7→24/yr by 2055 (HVAC capex compounding) — expect insurance premiums to compound above CPI over the hold.
Questions for the listing agent
- Built in 1962 — when were the roof, HVAC, electrical panel, plumbing, and water heater last replaced?
- Is there a deadline driving the sale (1031 exchange, divorce, estate, relocation)? That informs how much negotiation room exists.
- Schools are D-rated, which usually means shorter tenancies and higher turnover. Who's the typical renter profile here, and what's been the actual vacancy rate?
- Crime grade is D in this area — have there been break-ins, vandalism, or insurance claims at this property in the last 3 years? What carrier currently insures it and at what premium?
- What's the average days-on-market for RENTAL listings here right now (not sales)? A rising rental-DOM trend means longer vacancies and softer asking-rent achievability than the comps imply.
- What's the recent tenant-quality profile in this submarket — average credit score on applications, eviction rate, late-payment / NSF rate, and stable-employment percentage? A property-management company in the area should have these aggregated.
- How much new for-sale + rental construction is in the pipeline within 1–3 miles? Heavy new supply typically softens prices + rents 12–24 months out; constrained supply supports both.
Investment metrics
- 1% rule
- 1.07% ✓
- Cap rate
- 7.77%
- Cash-on-cash
- 5.29%
- DSCR
- 1.24
- GRM
- 7.8
CMA / ARV
- ARV (median comp)
- $122,204
- List price
- $129,000
- Delta
- 5.56%
- Verdict
- FAIR
- Comps
- 20 within 1.0 mi
Show comp detail 12 sales within ~0.75 mi
| Address | Dist | Beds/Ba | Sqft | Sold | Price | $/sf | Match |
|---|---|---|---|---|---|---|---|
| 621 Dunbar St | 0.08mi | 2/1.0 (-1) | 952 (0%) | 15mo | $40,000 | $42 | 79 |
| 1144 Faulkner Ln | 0.52mi | 3/1.0 | 972 (+2%) | 8mo | $162,000 | $167 | 66 |
| 504 Dearborn St | 0.15mi | 3/1.5 | 1,068 (+12%) | 8mo | $185,000 | $173 | 64 |
| 1016 Preston St | 0.44mi | 2/1.0 (-1) | 989 (+4%) | 6mo | $35,000 | $35 | 63 |
| 512 Lenox St | 0.10mi | 2/1.0 (-1) | 865 (-9%) | 14mo | $72,000 | $83 | 63 |
| 1220 Sherman St | 0.33mi | 3/2.0 | 864 (-9%) | 4mo | $55,000 | $64 | 62 |
| 604 Garrison St | 0.74mi | 2/1.0 (-1) | 960 (+1%) | 0mo | $114,900 | $120 | 59 |
| 1111 Turner St | 0.39mi | 2/1.0 (-1) | 1,036 (+9%) | 7mo | $174,900 | $169 | 56 |
| 1320 Hood St | 0.28mi | 3/2.0 | 1,077 (+13%) | 10mo | $209,999 | $195 | 52 |
| 1212 J J Flewellen Rd | 0.44mi | 3/1.0 | 844 (-11%) | 13mo | $82,995 | $98 | 50 |
| 1100 Sherman St | 0.45mi | 3/2.0 | 1,043 (+10%) | 15mo | $199,900 | $192 | 47 |
| 924 Hubert St | 0.60mi | 2/1.0 (-1) | 896 (-6%) | 14mo | $69,000 | $77 | 46 |
Match score weights: distance 35% · size 25% · config 20% · recency 20%. Top-matched comps best support the ARV.
Projected returns pro-forma
-3.0% appreciation · 3.0% rent growth · sell at horizon
- IRR
- -8.1%
- Equity multiple
- 0.70×
- Total profit
- $-10,716
- Equity at exit
- $19,234
- IRR
- 1.5%
- Equity multiple
- 1.11×
- Total profit
- $3,922
- Equity at exit
- $11,154
Cash invested: $36,120 (down + closing). Projections, not guarantees.
Landlord ↔ Tenant lean methodology
- Overall (STATE)
- 87 Strongly Landlord-Friendly
- State Texas
- 87 Strongly Landlord-Friendly · R+5
- County
- — inherits STATE
- City
- — inherits STATE
ZIP-level market 76704
- Home prices YoY
- -2.7%
- Active inventory
- 86
- Price-to-rent
- 7.8×
Monthly cashflow live
- Estimated rent
- $1,386 high interval (Pro) →
- Mortgage (P&I)
- −$676
- Tax from tax record
- −$206 /mo · $2,471/yr
- Insurance
- −$54
- HOA
- −$0
- Vacancy / Maint / Mgmt
- −$291
- Net cashflow
- $159
Break-even live
UW: 25.0% down · 7.5% · 30yr · 1.5% tax · 5.0% vac · 8.0% maint · 8.0% mgmt
Financing live
Cash to close
- Down payment
- $32,250
- Closing costs
- $3,870
- Reserves months
- —
- Total cash needed
- —
Loan-product check · same deal, 3 products live
Conventional
25% down · 7.5% · 30yr
- Down + closing
- —
- Monthly P&I
- —
- Monthly cashflow
- —
- DSCR
- —
- Eligible?
- —
Personal DTI + credit; lowest rate.
DSCR
20% down · 8.5% · 30yr
- Down + closing
- —
- Monthly P&I
- —
- Monthly cashflow
- —
- DSCR
- —
- Eligible?
- —
No personal income docs; deal must DSCR.
Hard money
10% down · 12.0% · 12mo
- Down + closing
- —
- Monthly P&I
- —
- Monthly cashflow
- —
- DSCR
- —
- Eligible?
- —
Short-term bridge; refi at stabilization.
Rent comps 21 comps
| Address | Beds | Baths | Sqft | Rent | $/sqft | DOM | Units | Dist |
|---|---|---|---|---|---|---|---|---|
| 507 Dunbar St Waco, TX | 3.0 | 1.0 | 852 | $1,450 | $1.70 | 13d | 1 | 0.16mi |
| 507 Dunbar St Waco, TX | 3.0 | 1.0 | 841 | $1,550 | $1.84 | 21d | 1 | 0.16mi |
| 1225 Selman St Waco, TX | 2.0 | 1.0 | 624 | $895 | $1.43 | 21d | 1 | 0.34mi |
| 1212 J J Flewellen Rd Waco, TX | 2.0 | 1.0 | 844 | $1,250 | $1.48 | 44d | 1 | 0.42mi |
| 1104 Sherman St Waco, TX | 2.0 | 1.0 | 1120 | $1,500 | $1.34 | 44d | 1 | 0.45mi |
| 825 Garrison St Waco, TX | 3.0 | 2.0 | 1028 | $1,370 | $1.33 | 13d | 1 | 0.59mi |
| 932 Dawson St Waco, TX | 3.0 | 2.0 | 1028 | $1,449 | $1.41 | 13d | 1 | 0.61mi |
| 609 Sherman St Waco, TX | 3.0 | 2.0 | 1028 | $1,449 | $1.41 | 21d | 1 | 0.72mi |
| 916 Olive St Waco, TX | 3.0 | 2.0 | 1028 | $1,475 | $1.43 | 13d | 1 | 0.79mi |
| 1107 Chestnut St Waco, TX | 2.0 | 1.0 | 928 | $1,300 | $1.40 | 21d | 1 | 0.85mi |
| 925 Burgan St Unit A Waco, TX | 3.0 | 2.0 | 872 | $999 | $1.15 | 13d | 1 | 0.87mi |
| 923 Burgan St Unit A Waco, TX | 3.0 | 2.0 | 872 | $1,015 | $1.16 | 13d | 1 | 0.87mi |
| 1226 Chestnut St Unit A Waco, TX | 3.0 | 2.0 | 980 | $925 | $0.94 | 21d | 1 | 0.91mi |
| 413 Lottie St Unit B Waco, TX | 3.0 | 2.0 | 872 | $1,025 | $1.18 | 13d | 1 | 1.08mi |
| 718 Garland Ave Unit b Waco, TX | 3.0 | 1.0 | 838 | $985 | $1.18 | 13d | 1 | 1.17mi |
| 804 Earle Ave Unit A Waco, TX | 3.0 | 2.0 | 872 | $1,035 | $1.19 | 13d | 1 | 1.20mi |
| 1013 Earle Ave Waco, TX | 3.0 | 2.0 | 1028 | $1,525 | $1.48 | 21d | 1 | 1.24mi |
| 215 Washington Ave Waco, TX | 1.0–4.0 | 1.0–4.0 | 919 | $1,737 | $1.89 | 21d | 1 | 1.27mi |
| 820 E Pecan Ave Waco, TX | 2.0 | 1.0 | 672 | $1,300 | $1.93 | 13d | 1 | 1.28mi |
| 1216 Tennessee Ave Unit B Waco, TX | 3.0 | 2.0 | 872 | $1,350 | $1.55 | 21d | 1 | 1.42mi |
| 1216 Tennessee Ave Waco, TX | 3.0 | 2.0 | 872 | $1,250 | $1.43 | 21d | 1 | 1.42mi |
Listing history 3 events
-
2026-05-30status $129,000 Pending 15 DOM
-
2026-05-14$129,000 Active 800-char remark
-
2017-06-16soldstatus
ⓘ Source: listings_history table (triggers on properties + properties_extension) + one-shot
backfill from property_details.listing_events for pre-trigger history.
Tax reassessment forecast TX · Resets to sale price
- Current annual tax
- $2,471 · $206/mo
- Projected year-2 tax
- $2,471 · $206/mo
- Expected delta
- $0/yr ($0/mo · 0.0%)
ⓘ Screening estimate from a state-policy table — verify with the county assessor before closing.
Climate risk First Street
- Flood 5/10 Major FEMA zone X (unshaded) · 27% chance over 30 yrs
- Wildfire 4/10 Moderate
- Heat 7/10 Severe 7 d/yr ≥109°F today · 24 d/yr by 30 yrs out
- Wind 6/10 Major 60% chance of damaging wind over 30 yrs
- Air quality 2/10 Low 0 unhealthy d/yr today · 1 by 30 yrs out
Nearby sold comps map
Loading sold comps map…
Walkable amenities ~0.75 mi
Loading nearby amenities…
Taxation est. · year 1
- Rental income
- $16,638
- − Mortgage interest
- −$7,226
- − Property taxes
- −$2,471
- − Insurance
- −$645
- − Repairs & maintenance
- −$1,331
- − Management
- −$1,331
- − Depreciation
- −$3,753
- Taxable loss
- −$119
- Est. tax savings @ 24.0%
- +$28
- After-tax cash flow
- $1,939/yr
For passive investors: Depreciation is non-cash, so a rental often shows a tax loss while cash-flowing — sheltering income. Rental losses are passive: they offset passive income freely, and up to $25,000/yr can offset ordinary (W-2) income if you actively participate and your MAGI is under $100k (phasing out to $0 by $150k); unused losses carry forward. On sale, claimed depreciation is recaptured at up to 25%, and gains may owe capital-gains tax (a 1031 exchange can defer both). Figures are a year-1 estimate at your 24.0% rate — not tax advice; consult a CPA.
Schools (NCES district)
- District
- Waco ISD
- NCES district ID
- 4844280
- Math proficiency
- 20% ▼ -14.00%
- Reading proficiency
- 24% ▼ -6.00%
- Median HH income
- $29,208
- Composite
- 17.57/100
- National rank
- #9043
- State rank
- #773 of 826 in TX
Livability — Waco
- Score
- 74/100
- State rank
- #166
- US rank
- #4378
Category grades
Schools grade is shown separately in the Schools card above.
Census & demographics
- Census place
- Waco, TX
- County
- McLennan County · 213,088 people
- City population
- 125,319
- Metro
- Waco, TX
- Population (ZIP)
- 7,018
- Household income
- $30,349
- Rent vs Own
- Severe rent burden
- 603.0
Population outlook (McLennan County) Hauer SSP2
- Today (2025)
- 264,191 people
- By 2030
- 273,578 · +3.6%
- By 2040
- 291,506 · +10.3%
- By 2050
- 308,044 · +16.6%
- By 2075
- 349,648 · +32.3%
- By 2100
- 364,779 · +38.1%
Race, ethnicity, and origin ACS 2023
- Neighborhood character
- Predominantly Black (67%)
- Race & ethnicity
- Black 67% Hispanic / Latino 19% Two or more races 11% White 10%
- Hispanic origin (detail)
- Mexican 17%
- Common ancestry
- Lithuanian 2%
- Foreign-born
- 6% · Canada
- Languages at home
- 86% English-only · Spanish 14%
Political lean MEDSL · McLennan
- 2024 margin
- Solid R (+30.9) · D 34.0% · R 64.9% · Other 1.0%
- 2008→2024 swing
- -7.0pp toward R · 2008: -23.9pp · 2024: -30.9pp
- All cycles
- 2024: R+30.9 2020: R+23.4 2016: R+27.1 2012: R+29.8 2008: R+23.9
Not yet ingested
- Civics
- —
Market trends
- HPI YoY
- ▼ -5.09%
- Current HPI
- 181.8051
- Rent YoY
- —
- Metro
- Waco, TX
- State GDP YoY
- ▲ 3.95%
- F500 in state
- 110
Industry mix (Fortune 500 HQ in TX)
| Industry | F500 HQs | Revenue |
|---|---|---|
| Energy | 16 | $1,198B |
|
||
| Technology | 5 | $198B |
|
||
| Engineering / Construction | 4 | $72B |
|
||
| Energy Services | 3 | $60B |
|
||
| Utilities | 3 | $41B |
|
||
| Healthcare | 2 | $330B |
|
||
Price history
5 events — show timeline
- 2026-05-30 Pending — NTREIS
- 2026-05-20 Contingent — NTREIS
- 2026-05-19 Listing Removed — NTREIS
- 2026-05-14 Listed $129,000 NTREIS
- 2017-06-16 Sold (Public Records) — Public Records
Property tax history
+7.7%/yrLatest (2025): $2,471 · +2.7% YoY. Source: county tax records.
Cash-flow waterfall
monthlySold comps — $/sqft
last 12 mo · ≤1 miLoading sold comps…