408 Allen St · Kyle, TX
Flood risk 1/10 · Minimal
- FEMA flood zone
- X (unshaded)
- Chance of flooding over 30 yrs
- 0.0%
- Est. flood insurance / yr
- $507 – $1,088
Fire risk 4/10 · Minor
- Est. fire insurance / yr
- $1,222 – $2,270
Heat risk 8/10 · Major
- Hot days now (above 108°F)
- 7 days/yr
- Hot days in 30 yrs
- 22 days/yr
Wind risk 8/10 · Major
- Chance of severe wind over 30 yrs
- 80.0%
Air-quality risk 2/10 · Minimal
- Unhealthy air days now
- 0 days/yr
- Unhealthy air days in 30 yrs
- 1 days/yr
Risk factors via First Street. Map © Google.
Why this score? — see what drove the B- grade
The composite is a weighted blend of 9 inputs, each scored 0–100. Each bar is that input's sub-score; the figure is the points it added to the 100-point composite (weight × sub-score).
- Cash flow +30.0/30.0
- DSCR +10.0/10.0
- 1% rule +8.6/10.0
- ARV discount +7.5/15.0
- Livability +3.8/5.0
- Schools +3.5/10.0
- Rent growth +2.4/5.0
- Condition / age +1.0/5.0
- Appreciation +0.0/10.0
$96,500
🖨 Deal sheet 📄 Offer letter ✓ Due diligence
Listing remarks MLS
PRIME LOCATION in downtown Kyle, TX * * * Investor Special * * * , home is a tear down on pier and beam. NO HOA, LOW TAX RATE
Key facts
- Low tax rate
- Prime location
- No hoa
Tags
Neighborhood map
What this means for you Summary
Snapshot
- This is a 1-bed/2.0-bath single-family listed at $96k. Condition is rated poor.
Deal economics
- At list price, monthly cash flow is $370 ($4k/yr) — positive.
- The deal already cash-flows at list — no discount required.
- Meets the 1% rule at list price ($1k rent vs $96k).
- Recommended offer: $88k (9.0% below list) — sets the bar for market timing.
- Cap rate 10.9% vs local median 3.3% in Kyle — top-decile yield for the area; either an underpriced asset or a hidden risk that comps aren't pricing in. Stress-test before assuming the spread holds.
Location & tenants
- Location reads 75/100 on livability (#138 in TX, #3,993 nationally) — a middle-class / working-renter tenant base. Strengths: housing A+, health & safety A+, employment A; Watch: schools D, amenities F, commute F.
- Hays CISD (rural): math 35% / reading 41% proficiency, ranked #390 of 826 in TX (top 47%) — families likely to look elsewhere, expect single-tenant / working-renter base with shorter leases.
- Market conditions: Rents soft (-0.3%/yr); 1801 active listings in the ZIP; 8 comparable units currently listed for rent nearby; rentals leasing fast (median 13d on market — plan ~1-2 weeks tenant-placement turnaround); solid renter incomes; 5,270 units permitted in Hays County in 2024 (1,464 in 5+ unit buildings).
- This rent is only 17% of the median local income ($90k/yr) — well below the 30% rent-burden line; pricing power to push rent on renewal without tenant pushback.
Forward outlook
- Local home prices are declining (-3.0%/yr); year-one equity from $667 of loan paydown is wiped out by about $3k of value loss. Plan a longer hold.
- Hays County population projected at +93% by 2050 — long-run rental-demand tailwind backs the buy-and-hold thesis.
Negotiation context
- It's been on market 120 days — a 9% lower offer ($88k) is reasonable based on typical stale-listing flexibility.
- 2 sale attempts; this cycle's ask has dropped $78k (45%) from the opening price — seller is motivated, your offer sets the floor, not the list.
Risks & watch-outs
- Climate carrying-cost: severe wind risk, 80% chance of damaging wind over 30y; extreme-heat days projected 7→22/yr by 2055 (HVAC capex compounding) — expect insurance premiums to compound above CPI over the hold.
Questions for the listing agent
- It's been on market 120 days. Have you received any prior offers? Is the seller open to a 9% concession, seller financing, or rate buy-down credit?
- Have any recent inspections been done? Can we get a copy of the seller's disclosures and any deferred-maintenance estimates?
- Built in 1979 — when were the roof, HVAC, electrical panel, plumbing, and water heater last replaced?
- Why hasn't it sold? Are there any deal-killer items the seller is aware of (foundation, flood, title, zoning, code violations)?
- Is there a deadline driving the sale (1031 exchange, divorce, estate, relocation)? That informs how much negotiation room exists.
- Schools are D-rated, which usually means shorter tenancies and higher turnover. Who's the typical renter profile here, and what's been the actual vacancy rate?
- What's the average days-on-market for RENTAL listings here right now (not sales)? A rising rental-DOM trend means longer vacancies and softer asking-rent achievability than the comps imply.
- What's the recent tenant-quality profile in this submarket — average credit score on applications, eviction rate, late-payment / NSF rate, and stable-employment percentage? A property-management company in the area should have these aggregated.
- How much new for-sale + rental construction is in the pipeline within 1–3 miles? Heavy new supply typically softens prices + rents 12–24 months out; constrained supply supports both.
Investment metrics
- 1% rule
- 1.36% ✓
- Cap rate
- 10.89%
- Cash-on-cash
- 16.42%
- DSCR
- 1.73
- GRM
- 6.1
CMA / ARV
- ARV (median comp)
- $272,992
- List price
- $96,500
- Delta
- -64.65%
- Verdict
- UNDERPRICED
- Comps
- 6 within 1.0 mi
Projected returns pro-forma
-3.0% appreciation · 0.0% rent growth · sell at horizon
- IRR
- 4.0%
- Equity multiple
- 1.15×
- Total profit
- $4,081
- Equity at exit
- $14,388
- IRR
- 10.5%
- Equity multiple
- 1.71×
- Total profit
- $19,091
- Equity at exit
- $8,344
Cash invested: $27,020 (down + closing). Projections, not guarantees.
Landlord ↔ Tenant lean methodology
- Overall (STATE)
- 87 Strongly Landlord-Friendly
- State Texas
- 87 Strongly Landlord-Friendly · R+5
- County
- — inherits STATE
- City
- — inherits STATE
ZIP-level market 78640
- Home prices YoY
- -33.8%
- Rents YoY
- -0.3%
- Active inventory
- 1801
- Price-to-rent
- 6.1×
Monthly cashflow live
- Estimated rent
- $1,312 high interval (Pro) →
- Mortgage (P&I)
- −$506
- Tax est. 1.5%
- −$121 /mo · $1,448/yr
- Insurance
- −$40
- HOA
- −$0
- Vacancy / Maint / Mgmt
- −$276
- Net cashflow
- $370
Break-even live
UW: 25.0% down · 7.5% · 30yr · 1.5% tax · 5.0% vac · 8.0% maint · 8.0% mgmt
Financing live
Cash to close
- Down payment
- $24,125
- Closing costs
- $2,895
- Reserves months
- —
- Total cash needed
- —
Loan-product check · same deal, 3 products live
Conventional
25% down · 7.5% · 30yr
- Down + closing
- —
- Monthly P&I
- —
- Monthly cashflow
- —
- DSCR
- —
- Eligible?
- —
Personal DTI + credit; lowest rate.
DSCR
20% down · 8.5% · 30yr
- Down + closing
- —
- Monthly P&I
- —
- Monthly cashflow
- —
- DSCR
- —
- Eligible?
- —
No personal income docs; deal must DSCR.
Hard money
10% down · 12.0% · 12mo
- Down + closing
- —
- Monthly P&I
- —
- Monthly cashflow
- —
- DSCR
- —
- Eligible?
- —
Short-term bridge; refi at stabilization.
Rent comps 8 comps
| Address | Beds | Baths | Sqft | Rent | $/sqft | DOM | Units | Dist |
|---|---|---|---|---|---|---|---|---|
| 504 W Moore St Kyle, TX | 2.0 | 1.0 | 952 | $1,450 | $1.52 | 17d | 1 | 0.29mi |
| 203 W North St Kyle, TX | 2.0 | 1.0 | 1049 | $1,100 | $1.05 | 43d | 1 | 0.58mi |
| 300 Veterans Dr Unit C Kyle, TX | 2.0 | 1.5 | 1000 | $1,400 | $1.40 | 17d | 1 | 0.60mi |
| 106 Cockerham St Unit A Kyle, TX | 2.0 | 1.0 | 825 | $1,200 | $1.45 | 12d | 1 | 0.65mi |
| 200 Philomena Dr Kyle, TX | 1.0–3.0 | 1.0–2.0 | 994 | $990 | $1.00 | 2d | 24 | 0.85mi |
| 141 Opal Ln Kyle, TX | 3.0 | 1.0–2.0 | 886 | $1,300 | $1.47 | 2d | 93 | 1.16mi |
| 1561 Arbor Knot Dr Kyle, TX | 2.0 | 2.0 | 1195 | $1,750 | $1.46 | 3d | 1 | 1.25mi |
| 21393 Interstate 35 Kyle, TX | 1.0–3.0 | 1.0–2.0 | 969 | $950 | $0.98 | 4d | 7 | 1.44mi |
Listing history 18 events
-
2026-06-18days on market $96,500 Active 120 DOM
-
2026-06-17days on market $96,500 Active 119 DOM
-
2026-06-16days on market $96,500 Active 118 DOM
-
2026-06-15days on market $96,500 Active 117 DOM
-
2026-06-13days on market $96,500 Active 115 DOM
-
2026-06-09days on market $96,500 Active 111 DOM
-
2026-06-08days on market $96,500 Active 110 DOM
-
2026-06-07days on market $96,500 Active 109 DOM
-
2026-06-05days on market $96,500 Active 106 DOM
-
2026-06-03days on market $96,500 Active 105 DOM
-
2026-06-02days on market $96,500 Active 104 DOM
-
2026-06-01days on market $96,500 Active 103 DOM
-
2026-05-31days on market $96,500 Active 102 DOM
-
2026-05-19price $96,500 130-char remark
Show marketing remark (783 chars)
Prime Downtown Kyle Infill Opportunity! Rare . 22-acre corner lot with city water, sewer, and electricity already connected — a major cost and time saver for your next build. The existing estimated 1,000 sq ft pier & beam structure is in extremely poor condition and considered a light tear-down, keeping demolition costs manageable compared to larger slab homes. Structure is on Pier and Beam. Zoned residential with no HOA and a low property tax rate. Ideal for a custom home, spec build, or long-term hold. Established utilities, downtown location, and corner positioning make this a strong redevelopment play in one of Kyle’s growing central areas. Property being sold as-is. Buyer to verify zoning, setbacks, and development requirements with the City of Kyle.
-
2026-05-19price $96,500 783-char remark
Show marketing remark (783 chars)
Prime Downtown Kyle Infill Opportunity! Rare . 22-acre corner lot with city water, sewer, and electricity already connected — a major cost and time saver for your next build. The existing estimated 1,000 sq ft pier & beam structure is in extremely poor condition and considered a light tear-down, keeping demolition costs manageable compared to larger slab homes. Structure is on Pier and Beam. Zoned residential with no HOA and a low property tax rate. Ideal for a custom home, spec build, or long-term hold. Established utilities, downtown location, and corner positioning make this a strong redevelopment play in one of Kyle’s growing central areas. Property being sold as-is. Buyer to verify zoning, setbacks, and development requirements with the City of Kyle.
-
2026-03-06$175,000 Active 783-char remark
Show marketing remark (783 chars)
Prime Downtown Kyle Infill Opportunity! Rare . 22-acre corner lot with city water, sewer, and electricity already connected — a major cost and time saver for your next build. The existing estimated 1,000 sq ft pier & beam structure is in extremely poor condition and considered a light tear-down, keeping demolition costs manageable compared to larger slab homes. Structure is on Pier and Beam. Zoned residential with no HOA and a low property tax rate. Ideal for a custom home, spec build, or long-term hold. Established utilities, downtown location, and corner positioning make this a strong redevelopment play in one of Kyle’s growing central areas. Property being sold as-is. Buyer to verify zoning, setbacks, and development requirements with the City of Kyle.
-
2026-02-26price $175,000 130-char remark
Show marketing remark (130 chars)
PRIME LOCATION in downtown Kyle, TX * * * Investor Special * * * , home is a tear down on pier and beam. NO HOA, LOW TAX RATE
-
2026-02-18$200,000 Active 130-char remark
Show marketing remark (130 chars)
PRIME LOCATION in downtown Kyle, TX * * * Investor Special * * * , home is a tear down on pier and beam. NO HOA, LOW TAX RATE
ⓘ Source: listings_history table (triggers on properties + properties_extension) + one-shot
backfill from property_details.listing_events for pre-trigger history.
Climate risk First Street
- Flood 1/10 Low FEMA zone X (unshaded) · 0% chance over 30 yrs
- Wildfire 4/10 Moderate
- Heat 8/10 Severe 7 d/yr ≥108°F today · 22 d/yr by 30 yrs out
- Wind 8/10 Severe 80% chance of damaging wind over 30 yrs
- Air quality 2/10 Low 0 unhealthy d/yr today · 1 by 30 yrs out
Nearby sold comps map
Loading sold comps map…
Walkable amenities ~0.75 mi
Loading nearby amenities…
Taxation est. · year 1
- Rental income
- $15,745
- − Mortgage interest
- −$5,406
- − Property taxes
- −$1,448
- − Insurance
- −$482
- − Repairs & maintenance
- −$1,260
- − Management
- −$1,260
- − Depreciation
- −$2,807
- Taxable income
- $3,083
- Est. tax owed @ 24.0%
- −$740
- After-tax cash flow
- $3,696/yr
For passive investors: Depreciation is non-cash, so a rental often shows a tax loss while cash-flowing — sheltering income. Rental losses are passive: they offset passive income freely, and up to $25,000/yr can offset ordinary (W-2) income if you actively participate and your MAGI is under $100k (phasing out to $0 by $150k); unused losses carry forward. On sale, claimed depreciation is recaptured at up to 25%, and gains may owe capital-gains tax (a 1031 exchange can defer both). Figures are a year-1 estimate at your 24.0% rate — not tax advice; consult a CPA.
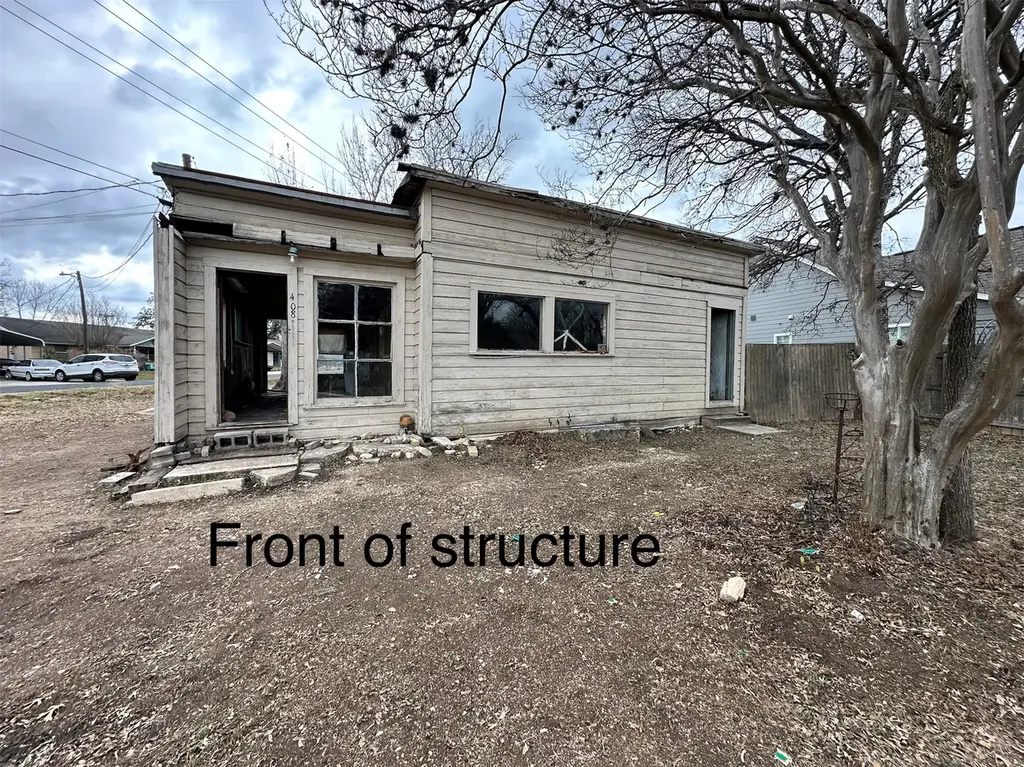
Condition & rehab AI · 1 photo
This property requires extensive repairs and improvements to its exterior, foundation, and landscaping, as well as HVAC and mechanical upgrades. Significant value can be added through these updates, making it a prime opportunity for an investor.
Repairs flagged
- Major siding — The siding is visibly damaged and needs replacement.
- Major roof — The roof appears to be in poor condition and may need replacement.
- Major foundation — The foundation is visibly damaged and may need repair or replacement.
- Major HVAC/mechanicals — No systems are visible, but the overall condition suggests they may need replacement.
- Major landscaping — The landscaping is minimal and in poor condition, requiring significant improvement.
Value-add opportunities
- Both extensive exterior repairs and landscaping — These updates would significantly improve the home's appearance and curb appeal, enhancing both resale and rental value.
- Both HVAC and mechanical upgrades — Upgrading these systems would improve comfort and energy efficiency, making the home more attractive to buyers and renters.
- Both interior repairs and updates — These updates would improve the home's livability and aesthetic appeal, enhancing both resale and rental value.
Renovation cost estimate screening
| Repair item | Severity | Est. cost |
|---|---|---|
| siding · The siding is visibly damaged and needs replacement. | Major | $15,000–50,000 |
| roof · The roof appears to be in poor condition and may need replacement. | Major | $15,000–50,000 |
| foundation · The foundation is visibly damaged and may need repair or replacement. | Major | $15,000–50,000 |
| HVAC/mechanicals · No systems are visible, but the overall condition suggests they may need replacement. | Major | $15,000–50,000 |
| landscaping · The landscaping is minimal and in poor condition, requiring significant improvement. | Major | $15,000–50,000 |
| Total estimated repair cost · 5 items | $75,000–250,000 |
Value-add ROI direction
- Both extensive exterior repairs and landscaping — These updates would significantly improve the home's appearance and curb appeal, enhancing both resale and rental value. ↑
- Both HVAC and mechanical upgrades — Upgrading these systems would improve comfort and energy efficiency, making the home more attractive to buyers and renters. ↑
- Both interior repairs and updates — These updates would improve the home's livability and aesthetic appeal, enhancing both resale and rental value. ↑
ⓘ Cost ranges are severity-bucket heuristics (US national rule-of-thumb). Get contractor quotes + a written scope before underwriting a rehab budget.
Schools (NCES district)
- District
- Hays CISD
- NCES district ID
- 4800010
- Math proficiency
- 35% ▼ -15.00%
- Reading proficiency
- 41% ▼ -5.00%
- Median HH income
- $70,570
- Composite
- 34.78/100
- National rank
- #5118
- State rank
- #390 of 826 in TX
Livability — Kyle
- Score
- 75/100
- State rank
- #138
- US rank
- #3993
Category grades
Schools grade is shown separately in the Schools card above.
Census & demographics
- Census place
- Kyle, TX
- County
- Hays County · 280,138 people
- City population
- 77,531
- Metro
- Austin-Round Rock-Georgetown, TX
- Population (ZIP)
- 77,531
- Household income
- $90,075
- Rent vs Own
- Severe rent burden
- 2552.0
Population outlook (Hays County) Hauer SSP2
- Today (2025)
- 286,948 people
- By 2030
- 336,923 · +17.4%
- By 2040
- 441,894 · +54.0%
- By 2050
- 553,462 · +92.9%
- By 2075
- 838,261 · +192.1%
- By 2100
- 1,063,658 · +270.7%
Race, ethnicity, and origin ACS 2023
- Neighborhood character
- Diverse neighborhood (Simpson 0.56)
- Race & ethnicity
- Hispanic / Latino 55% White 36% Two or more races 29% Black 5% Native American 1%
- Hispanic origin (detail)
- Mexican 47% Puerto Rican 1%
- Common ancestry
- Italian 2% Slovak 2% Lithuanian 1%
- Foreign-born
- 13% · Canada
- Languages at home
- 63% English-only · Spanish 35%
Political lean MEDSL · Hays
- 2024 margin
- Lean D (+5.7) · D 52.1% · R 46.5% · Other 1.4%
- 2008→2024 swing
- +7.7pp toward D · 2008: -2.0pp · 2024: 5.7pp
- All cycles
- 2024: D+5.7 2020: D+10.8 2016: R+0.9 2012: R+10.4 2008: R+2.0
Not yet ingested
- Civics
- —
Market trends
- HPI YoY
- ▼ -92.64%
- Current HPI
- 181.7969
- Rent YoY
- ▼ -0.34%
- Metro
- Austin-Round Rock-Georgetown, TX
- State GDP YoY
- ▲ 3.95%
- F500 in state
- 110
Industry mix (Fortune 500 HQ in TX)
| Industry | F500 HQs | Revenue |
|---|---|---|
| Energy | 16 | $1,198B |
|
||
| Technology | 5 | $198B |
|
||
| Engineering / Construction | 4 | $72B |
|
||
| Energy Services | 3 | $60B |
|
||
| Utilities | 3 | $41B |
|
||
| Healthcare | 2 | $330B |
|
||
Price history
-51.7% since first listed5 events — show timeline
- 2026-05-19 Price Changed $96,500 Unlock MLS
- 2026-05-19 Price Changed $96,500 Unlock MLS
- 2026-03-06 Listed $175,000 Unlock MLS
- 2026-02-26 Price Changed $175,000 Unlock MLS
- 2026-02-18 Listed $200,000 Unlock MLS
Cash-flow waterfall
monthlySold comps — $/sqft
last 12 mo · ≤1 miLoading sold comps…