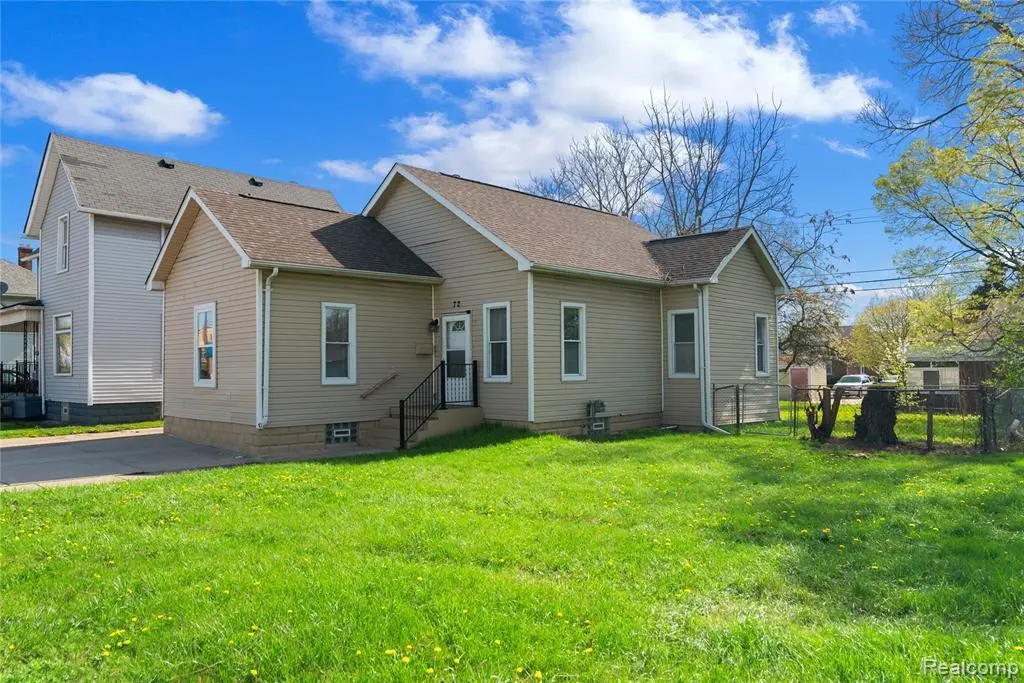
72 Gratiot Ave · Mount Clemens, MI
Flood risk No data
- FEMA flood zone
- —
- Chance of flooding over 30 yrs
- —
- Est. flood insurance / yr
- —
Fire risk No data
- Est. fire insurance / yr
- —
Heat risk No data
- Hot days now (above threshold)
- —
- Hot days in 30 yrs
- —
Wind risk No data
- Chance of severe wind over 30 yrs
- —
Air-quality risk No data
- Unhealthy air days now
- —
- Unhealthy air days in 30 yrs
- —
Risk factors via First Street. Map © Google.
Why this score? — see what drove the D+ grade
The composite is a weighted blend of 9 inputs, each scored 0–100. Each bar is that input's sub-score; the figure is the points it added to the 100-point composite (weight × sub-score).
- Cash flow +13.6/30.0
- ARV discount +7.7/15.0
- Appreciation +5.0/10.0
- DSCR +4.1/10.0
- Condition / age +4.0/5.0
- Livability +3.9/5.0
- 1% rule +3.8/10.0
- Rent growth +2.5/5.0
- Schools +0.6/10.0
$159,900
🖨 Deal sheet (PDF) 📄 Offer letter ✓ Due diligence
Listing remarks MLS
First time home buyers and Investors don't pass on this completely renovated 3 bedroom full basement ranch. This home is located in heart of MT clemens bus. district. Home has been completely re-done with neutral colors and bourber carpeting, 6 panel doors and beautiful new kitchen with ceramic tiles, new furnace and all new duck work. This home is a must see. Bank owned As is buyers and agents to verify all info.
Key facts
- 6,098 sq ft lot
- Garage
- Built 1925
Property features AI
Exterior
- Parking: Attached garage with electric and workshop area (1 garage space)
- Security: Pets allowed
- Utilities: Public water; Natural gas; Forced air heating; Gas water heater
- Home design: Residential, single-story; Built in 1925; Basement present
- Construction: Vinyl siding construction; Basement foundation
- Exterior features: Vinyl siding; Fenced yard; Patio; Porch
Interior
- Kitchen: Kitchen on entry level, approx. 14 x 12 with ceramic flooring; Dishwasher; Disposal; Microwave; Range/oven; Refrigerator
- Bedrooms: Three bedrooms (all on entry level); Primary bedroom approx. 15 x 11 with laminate flooring; Second bedroom approx. 11 x 11 with laminate flooring; Third bedroom approx. 10 (width) with laminate flooring
- Flooring: Laminate flooring in living room and bedrooms; Ceramic tile in kitchen and bathroom
- Bathrooms: One full bathroom (entry level) with ceramic flooring, approx. 10 x 8
- Heating & cooling: Forced air heating; Natural gas heat/fuel; Gas water heater
- Interior features: Cable/internet available; Unfinished basement
- Laundry & utility: Washer and dryer included
Neighborhood map
What this means for you Summary
Snapshot
- This is a 3-bed/1.0-bath single-family listed at $160k. Condition is rated good.
Deal economics
- At list price, monthly cash flow is $9 ($114/yr) — positive.
- The deal already cash-flows at list — no discount required.
- To meet the 1% rule (rent ≥ 1% of price), the offer needs to be $141k (11.8% below list).
- Recommended offer: $141k (11.8% below list) — sets the bar for 1% rule.
- Cap rate 6.4% vs local median 3.0% in Mount Clemens — top-decile yield for the area; either an underpriced asset or a hidden risk that comps aren't pricing in. Stress-test before assuming the spread holds.
Location & tenants
- Location reads 77/100 on livability (#120 in MI, #2,918 nationally) — a middle-class / working-renter tenant base. Strengths: commute A+, cost of living A+, housing A+; Watch: crime D+, amenities D+, employment D-.
- Mount Clemens Community School District (suburban): math 4% / reading 11% proficiency, ranked #532 of 540 in MI (top 98%) — low school quality limits family demand, transient renter base, plan for 1-2y turnover; 80% free/reduced lunch — lower-income household profile, screen leases tightly.
- Zoned schools: Seminole Academy (math 2% / reading 8%, grade F, #1,325 of 1,397 statewide, top 99%, 370 students, 94% FRL); Mount Clemens Middle School (math 2% / reading 12%, grade F, #481 of 493 statewide, top 98%, 151 students, 94% FRL); Mount Clemens High School (math 10% / reading 30%, grade F, #596 of 713 statewide, top 86%, 203 students, 90% FRL).
- Market conditions: 1 active listings in the ZIP; 14 comparable units currently listed for rent nearby; rentals leasing fast (median 7d on market — plan ~1-2 weeks tenant-placement turnaround); 1,321 units permitted in Macomb County in 2024 (86 in 5+ unit buildings).
Forward outlook
- In year one you build about $6k of equity ($1k loan paydown + $5k appreciation (3.0% local appreciation)).
- Macomb County population projected at +9% by 2050 — modest demand growth; plan on rents tracking national, not racing it.
- At projected returns (3.0% appreciation + 3.0% rent growth), your $45k cash investment doubles in ~6 years — after that, you're playing with house money.
- By year 6, paydown + projected appreciation supports a ~$31k cash-out refi (75% LTV) — recoverable capital for the next deal without selling this one.
Negotiation context
- Only 9 days on market — expect competitive offers; lowballing is unlikely to land.
- 10 sale attempts since 24y ago with the ask held roughly flat each time — persistent listings suggest the price (not the market) is what's stuck; bring a comps-based counter.
Risks & watch-outs
- Watch-outs: built in 1925 — expect roof / HVAC / electrical / plumbing capex.
Questions for the listing agent
- Built in 1925 — when were the roof, HVAC, electrical panel, plumbing, and water heater last replaced?
- Is there a deadline driving the sale (1031 exchange, divorce, estate, relocation)? That informs how much negotiation room exists.
- Schools are D-rated, which usually means shorter tenancies and higher turnover. Who's the typical renter profile here, and what's been the actual vacancy rate?
- Crime grade is D in this area — have there been break-ins, vandalism, or insurance claims at this property in the last 3 years? What carrier currently insures it and at what premium?
- The area grade is low — what's the realistic commute time and amenity access for the typical tenant pool here? Any planned neighborhood developments (good or bad) we should know about?
- What's the average days-on-market for RENTAL listings here right now (not sales)? A rising rental-DOM trend means longer vacancies and softer asking-rent achievability than the comps imply.
- What's the recent tenant-quality profile in this submarket — average credit score on applications, eviction rate, late-payment / NSF rate, and stable-employment percentage? A property-management company in the area should have these aggregated.
- How much new for-sale + rental construction is in the pipeline within 1–3 miles? Heavy new supply typically softens prices + rents 12–24 months out; constrained supply supports both.
Investment metrics
- 1% rule
- 0.88% ✗
- Cap rate
- 6.36%
- Cash-on-cash
- 0.25%
- DSCR
- 1.01
- GRM
- 9.4
CMA / ARV
- ARV (median comp)
- $160,759
- List price
- $159,900
- Delta
- -0.53%
- Verdict
- FAIR
- Comps
- 20 within 1.0 mi
Show comp detail 12 sales within ~0.75 mi
| Address | Dist | Beds/Ba | Sqft | Sold | Price | $/sf | Match |
|---|---|---|---|---|---|---|---|
| 72 Gratiot Ave | 0.00mi | 3/1.0 | 1,045 (0%) | 1mo | $169,900 | $163 | 100 |
| 166 Clinton St | 0.24mi | 2/1.0 (-1) | 1,035 (-1%) | 1mo | $102,500 | $99 | 81 |
| 72 Gratiot Ave | 0.64mi | 3/1.0 | 1,045 (0%) | 1mo | $169,900 | $163 | 70 |
| 21 Woolworth Ct | 0.38mi | 3/1.0 | 1,082 (+4%) | 8mo | $110,000 | $102 | 69 |
| 31 N Highland Ave | 0.65mi | 3/1.0 | 1,060 (+1%) | 7mo | $192,500 | $182 | 61 |
| 50 Michigan St | 0.60mi | 4/1.0 (+1) | 1,056 (+1%) | 7mo | $90,500 | $86 | 60 |
| 71 Boehme St St | 0.58mi | 2/1.0 (-1) | 1,156 (+11%) | 2mo | $169,900 | $147 | 48 |
| 190 Euclid Ave Unit and Lot 186 | 0.67mi | 3/2.0 | 1,122 (+7%) | 5mo | $169,999 | $152 | 48 |
| 190 Euclid Ave | 0.67mi | 3/2.0 | 1,122 (+7%) | 5mo | $169,999 | $152 | 48 |
| 167 N Broadway St | 0.48mi | 3/1.0 | 1,200 (+15%) | 6mo | $185,000 | $154 | 48 |
| 111 S Highland St | 0.74mi | 2/1.0 (-1) | 990 (-5%) | 8mo | $155,000 | $157 | 45 |
| 110 Smith St | 0.74mi | 3/2.0 | 1,135 (+9%) | 8mo | $105,000 | $93 | 41 |
Match score weights: distance 35% · size 25% · config 20% · recency 20%. Top-matched comps best support the ARV.
Projected returns pro-forma
3.0% appreciation · 3.0% rent growth · sell at horizon
- IRR
- 7.7%
- Equity multiple
- 1.44×
- Total profit
- $19,887
- Equity at exit
- $71,898
- IRR
- 10.4%
- Equity multiple
- 2.56×
- Total profit
- $70,003
- Equity at exit
- $110,803
Cash invested: $44,772 (down + closing). Projections, not guarantees.
Landlord ↔ Tenant lean methodology
- Overall (STATE)
- 62 Landlord-Friendly
- State Michigan
- 62 Landlord-Friendly · EVEN
- County
- — inherits STATE
- City
- — inherits STATE
ZIP-level market 48043 2310
- Active inventory
- 1
- Price-to-rent
- 9.4×
Monthly cashflow live
- Estimated rent
- $1,411 high interval (Pro) →
- Mortgage (P&I)
- −$839
- Tax est. 1.5%
- −$200 /mo · $2,398/yr
- Insurance
- −$67
- HOA
- −$0
- Vacancy / Maint / Mgmt
- −$296
- Net cashflow
- $9
Break-even live
Sensitivity live
| Price | -10% $120 | -5% $65 | +0% $9 | +5% $-46 | +10% $-101 |
|---|---|---|---|---|---|
| Rent | -10% $-102 | -5% $-46 | +0% $9 | +5% $65 | +10% $121 |
| Rate | -1.0pp $90 | -0.5pp $50 | base $9 | +0.5pp $-32 | +1.0pp $-74 |
UW: 25.0% down · 7.5% · 30yr · 1.5% tax · 5.0% vac · 8.0% maint · 8.0% mgmt
Financing live
Cash to close
- Down payment
- $39,975
- Closing costs
- $4,797
- Reserves months
- —
- Total cash needed
- —
Loan-product check · same deal, 3 products live
Conventional
25% down · 7.5% · 30yr
- Down + closing
- —
- Monthly P&I
- —
- Monthly cashflow
- —
- DSCR
- —
- Eligible?
- —
Personal DTI + credit; lowest rate.
DSCR
20% down · 8.5% · 30yr
- Down + closing
- —
- Monthly P&I
- —
- Monthly cashflow
- —
- DSCR
- —
- Eligible?
- —
No personal income docs; deal must DSCR.
Hard money
10% down · 12.0% · 12mo
- Down + closing
- —
- Monthly P&I
- —
- Monthly cashflow
- —
- DSCR
- —
- Eligible?
- —
Short-term bridge; refi at stabilization.
Rent comps 14 comps
| Address | Beds | Baths | Sqft | Rent | $/sqft | DOM | Units | Dist |
|---|---|---|---|---|---|---|---|---|
| 20 Lincoln St Unit 225 Mt Clemens, MI | 2.0 | 1.0 | 816 | $1,200 | $1.47 | 45d | 1 | 0.11mi |
| 40 Ferrin Pl Mount Clemens, MI | 3.0 | 1.0 | 1400 | $1,700 | $1.21 | 0d | 1 | 0.21mi |
| 15 Washington St Unit 2 Mt Clemens, MI | 3.0 | 1.0 | 1396 | $1,400 | $1.00 | 45d | 1 | 0.33mi |
| 121 Jones St Unit 2 Mt Clemens, MI | 2.0 | 1.0 | 1050 | $1,600 | $1.52 | 4d | 1 | 0.38mi |
| 121 Jones St Unit 1 Mt Clemens, MI | 2.0 | 1.0 | 1080 | $1,400 | $1.30 | 0d | 1 | 0.38mi |
| 64 Crocker Blvd Mt Clemens, MI | 2.0 | 1.0 | 950 | $1,250 | $1.32 | 45d | 1 | 0.51mi |
| 70 Crocker Blvd Mt Clemens, MI | 2.0 | 1.0 | 950 | $1,400 | $1.47 | 12d | 1 | 0.51mi |
| 104 Crocker Blvd Mt Clemens, MI | 2.0 | 1.0 | 854 | $1,250 | $1.46 | 7d | 1 | 0.61mi |
| 35 S Groesbeck Hwy Mt Clemens, MI | 1.0–2.0 | 1.0–1.5 | 1125 | $2,050 | $1.82 | 0d | 1 | 1.00mi |
| 133 S Christine Cir Unit 1 Mt Clemens, MI | 3.0 | 1.5 | 1040 | $1,500 | $1.44 | 0d | 1 | 1.14mi |
| 176 N Christine Cir Unit 1 Mt Clemens, MI | 2.0 | 1.5 | 1020 | $1,300 | $1.27 | 45d | 1 | 1.16mi |
| 277 N Rose St Mt Clemens, MI | 1.0–2.0 | 1.0 | 755 | $1,434 | $1.90 | 0d | 2 | 1.16mi |
| 23128 Wellington Cres Clinton Twp, MI | 1.0–2.0 | 1.0 | 850 | $1,375 | $1.62 | 0d | 6 | 1.22mi |
| 38539 Wellington Dr #19 Clinton Twp, MI | 2.0 | 1.0 | 1092 | $1,400 | $1.28 | 45d | 1 | 1.36mi |
Listing history 19 events
-
2026-05-06status Pending 606-char remark
-
2026-04-27$159,900 Active 606-char remark
-
2009-07-24soldstatus $13,000 417-char remark
Show marketing remark (417 chars)
First time home buyers and Investors don't pass on this completely renovated 3 bedroom full basement ranch. This home is located in heart of MT clemens bus. district. Home has been completely re-done with neutral colors and bourber carpeting, 6 panel doors and beautiful new kitchen with ceramic tiles, new furnace and all new duck work. This home is a must see. Bank owned As is buyers and agents to verify all info.
-
2009-06-26historical 417-char remark
Show marketing remark (417 chars)
First time home buyers and Investors don't pass on this completely renovated 3 bedroom full basement ranch. This home is located in heart of MT clemens bus. district. Home has been completely re-done with neutral colors and bourber carpeting, 6 panel doors and beautiful new kitchen with ceramic tiles, new furnace and all new duck work. This home is a must see. Bank owned As is buyers and agents to verify all info.
-
2008-10-27$14,900 417-char remark
Show marketing remark (417 chars)
First time home buyers and Investors don't pass on this completely renovated 3 bedroom full basement ranch. This home is located in heart of MT clemens bus. district. Home has been completely re-done with neutral colors and bourber carpeting, 6 panel doors and beautiful new kitchen with ceramic tiles, new furnace and all new duck work. This home is a must see. Bank owned As is buyers and agents to verify all info.
-
2008-10-10historical
-
2008-05-08$31,900
-
2008-03-11historical
-
2008-03-11historical
-
2007-08-15$54,900
-
2007-08-10$54,900
-
2006-08-01historical
-
2006-02-06$124,000
-
2003-03-10soldstatus $78,000
-
2003-02-26historical
-
2003-01-23$79,900
-
2002-12-31$79,900
-
2002-11-15$79,900
-
2002-10-03$84,900
ⓘ Source: listings_history table (triggers on properties + properties_extension) + one-shot
backfill from property_details.listing_events for pre-trigger history.
Nearby sold comps map
Loading sold comps map…
Walkable amenities ~0.75 mi
Loading nearby amenities…
Taxation est. · year 1
- Rental income
- $16,929
- − Mortgage interest
- −$8,957
- − Property taxes
- −$2,398
- − Insurance
- −$800
- − Repairs & maintenance
- −$1,354
- − Management
- −$1,354
- − Depreciation
- −$4,652
- Taxable loss
- −$2,586
- Est. tax savings @ 24.0%
- +$621
- After-tax cash flow
- $734/yr
For passive investors: Depreciation is non-cash, so a rental often shows a tax loss while cash-flowing — sheltering income. Rental losses are passive: they offset passive income freely, and up to $25,000/yr can offset ordinary (W-2) income if you actively participate and your MAGI is under $100k (phasing out to $0 by $150k); unused losses carry forward. On sale, claimed depreciation is recaptured at up to 25%, and gains may owe capital-gains tax (a 1031 exchange can defer both). Figures are a year-1 estimate at your 24.0% rate — not tax advice; consult a CPA.
Condition & rehab AI · 13 photos
This move-in ready 3-bedroom ranch home is in good condition with recent updates. The exterior and interior appear to be in good condition, and the home has a large, semi-private backyard with a storage shed. The home is located in a great location with easy access to downtown and city parks.
Value-add opportunities
- Resale Paint the exterior siding — Painting the exterior siding can improve the curb appeal and make the home look more attractive to potential buyers.
- Both Replace the flooring — Replacing the flooring can improve the overall look and feel of the home, making it more appealing to both buyers and renters.
- Resale Update the kitchen appliances — Updating the kitchen appliances can make the home more appealing to potential buyers and increase its value.
Renovation cost estimate screening
Value-add ROI direction
- Resale Paint the exterior siding — Painting the exterior siding can improve the curb appeal and make the home look more attractive to potential buyers. ↑
- Both Replace the flooring — Replacing the flooring can improve the overall look and feel of the home, making it more appealing to both buyers and renters. ↑
- Resale Update the kitchen appliances — Updating the kitchen appliances can make the home more appealing to potential buyers and increase its value. ↑
ⓘ Cost ranges are severity-bucket heuristics (US national rule-of-thumb). Get contractor quotes + a written scope before underwriting a rehab budget.
Schools (NCES district)
- District
- Mount Clemens Community School District
- NCES district ID
- 2624690
- Math proficiency
- 4% ▼ -9.00%
- Reading proficiency
- 11% ▼ -7.00%
- Median HH income
- $36,632
- Composite
- 6.25/100
- National rank
- #10005
- State rank
- #532 of 540 in MI
Livability — Mount Clemens
- Score
- 77/100
- State rank
- #120
- US rank
- #2918
Category grades
Schools grade is shown separately in the Schools card above.
Census & demographics
- Census place
- Mount Clemens, MI
Population outlook (Macomb County) Hauer SSP2
- Today (2025)
- 925,296 people
- By 2030
- 948,226 · +2.5%
- By 2040
- 983,961 · +6.3%
- By 2050
- 1,010,200 · +9.2%
- By 2075
- 1,076,222 · +16.3%
- By 2100
- 1,077,065 · +16.4%
Not yet ingested
- Political lean
- —
- Race & ethnicity
- —
- Common origin
- —
- Civics
- —
Market trends
- HPI YoY
- —
- Current HPI
- —
- Rent YoY
- —
- Metro
- —
- State GDP YoY
- ▲ 1.37%
- F500 in state
- 28
Industry mix (Fortune 500 HQ in MI)
| Industry | F500 HQs | Revenue |
|---|---|---|
| Automotive Parts | 3 | $48B |
|
||
| Automotive | 2 | $372B |
|
||
| Chemicals | 1 | $45B |
|
||
| Automotive Retail | 1 | $29B |
|
||
| Healthcare / Medical Devices | 1 | $23B |
|
||
| Automotive Technology | 1 | $20B |
|
||
Price history
+100.1% since first listed20 events — show timeline
- 2026-06-03 Sold (MLS) $169,900 MiRealSource-MiMLS
- 2026-05-06 Pending — MiRealSource-MiMLS
- 2026-04-27 Listed $159,900 MiRealSource-MiMLS
- 2009-07-24 Sold (MLS) $13,000 MiRealSource-MiMLS
- 2009-06-26 Listing Removed — MiRealSource-MiMLS
- 2008-10-27 Listed $14,900 MiRealSource-MiMLS
- 2008-10-10 Listing Removed — MiRealSource-MiMLS
- 2008-05-08 Listed $31,900 MiRealSource-MiMLS
- 2008-03-11 Listing Removed — MiRealSource-MiMLS
- 2008-03-11 Listing Removed — REALCOMP
- 2007-08-15 Listed $54,900 REALCOMP
- 2007-08-10 Listed $54,900 MiRealSource-MiMLS
- 2006-08-01 Listing Removed — REALCOMP
- 2006-02-06 Listed $124,000 REALCOMP
- 2003-03-10 Sold (MLS) $78,000 MiRealSource-MiMLS
- 2003-02-26 Listing Removed — MiRealSource-MiMLS
- 2003-01-23 Listed $79,900 MiRealSource-MiMLS
- 2002-12-31 Listed $79,900 REALCOMP
- 2002-11-15 Listed $79,900 REALCOMP
- 2002-10-03 Listed $84,900 REALCOMP
Cash-flow waterfall
monthlySold comps — $/sqft
last 12 mo · ≤1 miLoading sold comps…