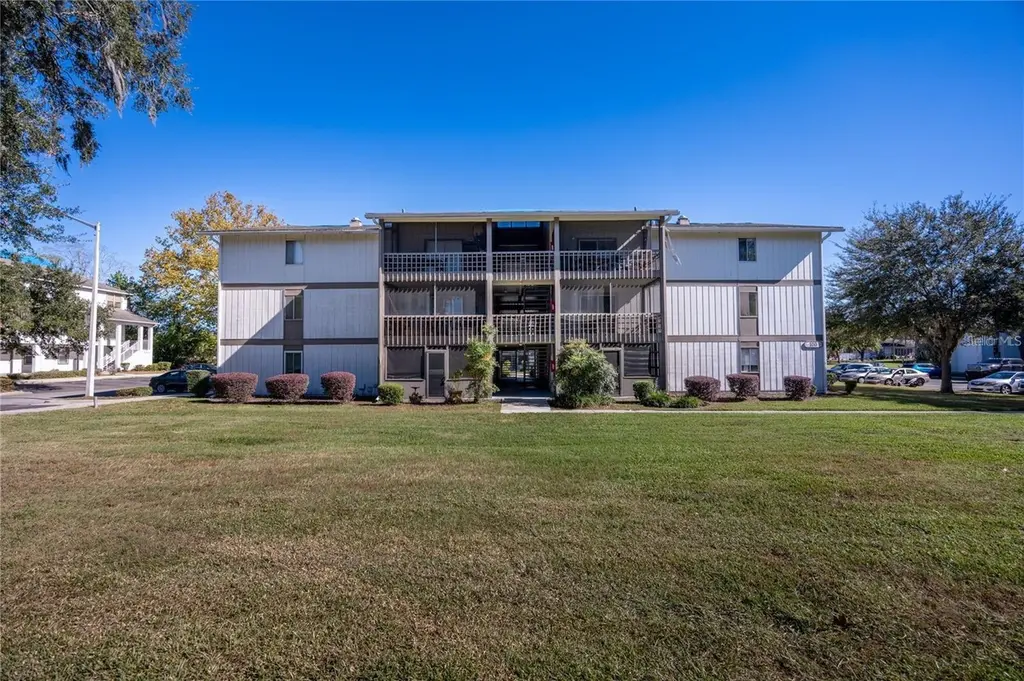
6519 W Newberry Rd #108 · Gainesville, FL
Flood risk No data
- FEMA flood zone
- —
- Chance of flooding over 30 yrs
- —
- Est. flood insurance / yr
- —
Fire risk No data
- Est. fire insurance / yr
- —
Heat risk No data
- Hot days now (above threshold)
- —
- Hot days in 30 yrs
- —
Wind risk No data
- Chance of severe wind over 30 yrs
- —
Air-quality risk No data
- Unhealthy air days now
- —
- Unhealthy air days in 30 yrs
- —
Risk factors via First Street. Map © Google.
Why this score? — see what drove the C- grade
The composite is a weighted blend of 9 inputs, each scored 0–100. Each bar is that input's sub-score; the figure is the points it added to the 100-point composite (weight × sub-score).
- Cash flow +17.5/30.0
- 1% rule +8.5/10.0
- ARV discount +7.5/15.0
- DSCR +5.5/10.0
- Schools +4.3/10.0
- Livability +4.0/5.0
- Rent growth +2.7/5.0
- Condition / age +2.5/5.0
- Appreciation +0.0/10.0
$114,900
🖨 Deal sheet 📄 Offer letter ✓ Due diligence
Listing remarks MLS
Take advantage of the great deal on the best priced unit in The Oaks Condominiums. This bank owned 2 bedroom 2 bath unit is on the bus route, approved for FHA financing and so close to the mall, dining and entertainment that you may never use your car. Make this your full time residence or bring your friends and stay for all the Florida football games. You can even grill outdoors and relax on your screen enclosed porch. Although the unit is in average condition, it could use interior painting and the common area carpets cleaned. There is even an inside laundry closet with washer and dryer hookups for you. Why wait any longer for the best deal when here it is in the middle of where you want to be?. 5+ Units.
Key facts
- Screened patio
- Fitness center
- Clubhouse
Tags
Property features AI
Finance
- Other: No lease restrictions indicated; Unfurnished unit; Development: The Oaks
- HOA & community: HOA managed by Affinity Management Group; Monthly association fee approximately $435.30; Association covers pool, structure maintenance, and grounds maintenance; Community amenities: clubhouse, pool, sidewalks; Pets allowed: cats and dogs
Exterior
- Utilities: Public water; Public sewer; Electricity available and connected; Water available and connected; Sewer available and connected
- Home design: Residential condominium; Second-floor unit; Faces north; One level inside unit; Total building stories: 3
- Construction: Wood siding construction; Shingle roof; Slab foundation; Built area approximately 1,003 (appraiser)
- Exterior features: Exterior lighting; Asphalt road frontage
Interior
- Kitchen: Range; Refrigerator
- Bedrooms: 2 bedrooms
- Flooring: Tile
- Bathrooms: 2 full bathrooms
- Heating & cooling: Central heating; Central air conditioning
- Interior features: Ceiling fans; Thermostat
- Laundry & utility: Laundry closet; Electric water heater
Neighborhood map
What this means for you Summary
Snapshot
- This is a 2-bed/2.0-bath condo listed at $115k.
Deal economics
- At list price, monthly cash flow is $89 ($1k/yr) — positive.
- The deal already cash-flows at list — no discount required.
- Meets the 1% rule at list price ($2k rent vs $115k).
Location & tenants
- Location reads 81/100 on livability (#97 in FL, #1,480 nationally) — a professional / high-income tenant draw. Strengths: amenities A+, commute A+, cost of living A+; Watch: employment D+, crime F.
- Alachua (urban): math 49% / reading 54% proficiency, ranked #30 of 73 in FL (top 41%) — acceptable for families but not a draw, mixed tenant base, ~2y average lease.
- Market conditions: Rents flat; 245 active listings in the ZIP; 1,774 units permitted in Alachua County in 2024 (984 in 5+ unit buildings).
- This rent runs 40% of the median local income ($46k/yr) — at the standard rent-burdened threshold; future hikes will face affordability resistance.
Forward outlook
- Local home prices are declining (-3.0%/yr); year-one equity from $794 of loan paydown is wiped out by about $3k of value loss. Plan a longer hold.
- Alachua County population projected at +26% by 2050 — long-run rental-demand tailwind backs the buy-and-hold thesis.
Negotiation context
- Only 3 days on market — expect competitive offers; lowballing is unlikely to land.
- 8 sale attempts since 21y ago with the ask held roughly flat each time — persistent listings suggest the price (not the market) is what's stuck; bring a comps-based counter.
- Current owner paid $50k; list at $115k implies a 130% gain — meaningful room to come down on a strong offer.
Risks & watch-outs
- Watch-outs: HOA is 28% of rent.
Questions for the listing agent
- Built in 1972 — when were the roof, HVAC, electrical panel, plumbing, and water heater last replaced?
- What does the HOA fee cover, when was the last increase, and are there any pending special assessments or reserve-fund shortfalls?
- Any open or pending special assessments — roof, HVAC, plumbing, elevator, façade? What's the per-unit balance and payoff schedule, and is the seller paying it off at close or rolling it to the buyer?
- Is there a deadline driving the sale (1031 exchange, divorce, estate, relocation)? That informs how much negotiation room exists.
- Schools are B-rated — typically a magnet for longer-tenancy family renters. What's the average tenant stay here, and is there a school-zone premium baked into asking?
- Crime grade is F in this area — have there been break-ins, vandalism, or insurance claims at this property in the last 3 years? What carrier currently insures it and at what premium?
- What's the average days-on-market for RENTAL listings here right now (not sales)? A rising rental-DOM trend means longer vacancies and softer asking-rent achievability than the comps imply.
- What's the recent tenant-quality profile in this submarket — average credit score on applications, eviction rate, late-payment / NSF rate, and stable-employment percentage? A property-management company in the area should have these aggregated.
- How much new apartment / multifamily construction is in the pipeline within 1–3 miles? Heavy new supply (>2% of stock underway) typically softens rents 12–24 months out; light construction supports rent growth.
Investment metrics
- 1% rule
- 1.35% ✓
- Cap rate
- 7.22%
- Cash-on-cash
- 3.31%
- DSCR
- 1.15
- GRM
- 6.2
CMA / ARV
No comps found within radius.
Projected returns pro-forma
-3.0% appreciation · 0.6% rent growth · sell at horizon
- IRR
- -14.7%
- Equity multiple
- 0.49×
- Total profit
- $-16,389
- Equity at exit
- $17,132
- IRR
- -12.6%
- Equity multiple
- 0.37×
- Total profit
- $-20,347
- Equity at exit
- $9,934
Cash invested: $32,172 (down + closing). Projections, not guarantees.
Landlord ↔ Tenant lean methodology
- Overall (STATE)
- 87 Strongly Landlord-Friendly
- State Florida
- 87 Strongly Landlord-Friendly · R+3
- County
- — inherits STATE
- City
- — inherits STATE
ZIP-level market 32607
- Rents YoY
- 0.6%
- Active inventory
- 245
- Price-to-rent
- 6.2×
Monthly cashflow live
- Estimated rent
- $1,551 medium interval (Pro) →
- Mortgage (P&I)
- −$603
- Tax from tax record
- −$51 /mo · $614/yr
- Insurance
- −$48
- HOA
- −$435
- Vacancy / Maint / Mgmt
- −$326
- Net cashflow
- $89
Break-even live
UW: 25.0% down · 7.5% · 30yr · 1.5% tax · 5.0% vac · 8.0% maint · 8.0% mgmt
Financing live
Cash to close
- Down payment
- $28,725
- Closing costs
- $3,447
- Reserves months
- —
- Total cash needed
- —
Loan-product check · same deal, 3 products live
Conventional
25% down · 7.5% · 30yr
- Down + closing
- —
- Monthly P&I
- —
- Monthly cashflow
- —
- DSCR
- —
- Eligible?
- —
Personal DTI + credit; lowest rate.
DSCR
20% down · 8.5% · 30yr
- Down + closing
- —
- Monthly P&I
- —
- Monthly cashflow
- —
- DSCR
- —
- Eligible?
- —
No personal income docs; deal must DSCR.
Hard money
10% down · 12.0% · 12mo
- Down + closing
- —
- Monthly P&I
- —
- Monthly cashflow
- —
- DSCR
- —
- Eligible?
- —
Short-term bridge; refi at stabilization.
HOA detail condo
- Monthly dues
- $435 · $5,220/yr
- Assessments
- None detected in remarks — confirm with the listing agent.
Listing history 4 events
-
2026-06-18days on market $114,900 Active 3 DOM
-
2026-06-17days on market $114,900 Active 2 DOM
-
2026-06-15remarks 699-char remark
-
2026-06-15$114,900 Active 1 DOM
ⓘ Source: listings_history table (triggers on properties + properties_extension) + one-shot
backfill from property_details.listing_events for pre-trigger history.
Tax reassessment forecast FL · Resets to sale price
- Current annual tax
- $614 · $51/mo
- Projected year-2 tax
- $954 · $79/mo
- Expected delta
- +$340/yr (+$28/mo · 55.3%)
ⓘ Screening estimate from a state-policy table — verify with the county assessor before closing.
Nearby sold comps map
Loading sold comps map…
Walkable amenities ~0.75 mi
Loading nearby amenities…
Taxation est. · year 1
- Rental income
- $18,613
- − Mortgage interest
- −$6,436
- − Property taxes
- −$614
- − Insurance
- −$574
- − Repairs & maintenance
- −$1,489
- − Management
- −$1,489
- − HOA
- −$5,220
- − Depreciation
- −$3,343
- Taxable loss
- −$552
- Est. tax savings @ 24.0%
- +$133
- After-tax cash flow
- $1,198/yr
For passive investors: Depreciation is non-cash, so a rental often shows a tax loss while cash-flowing — sheltering income. Rental losses are passive: they offset passive income freely, and up to $25,000/yr can offset ordinary (W-2) income if you actively participate and your MAGI is under $100k (phasing out to $0 by $150k); unused losses carry forward. On sale, claimed depreciation is recaptured at up to 25%, and gains may owe capital-gains tax (a 1031 exchange can defer both). Figures are a year-1 estimate at your 24.0% rate — not tax advice; consult a CPA.
Schools (NCES district)
- District
- Alachua
- NCES district ID
- 1200030
- Math proficiency
- 49% ▼ -9.00%
- Reading proficiency
- 54% ▼ -3.00%
- Median HH income
- $42,683
- Composite
- 43.31/100
- National rank
- #3038
- State rank
- #30 of 73 in FL
Livability — Gainesville
- Score
- 81/100
- State rank
- #97
- US rank
- #1480
Category grades
Schools grade is shown separately in the Schools card above.
Census & demographics
- Census place
- Gainesville, FL
- County
- Alachua County · 218,005 people
- City population
- 188,348
- Metro
- Gainesville, FL
- Population (ZIP)
- 35,720
- Household income
- $45,987
- Rent vs Own
- Severe rent burden
- 3418.0
Population outlook (Alachua County) Hauer SSP2
- Today (2025)
- 289,834 people
- By 2030
- 305,873 · +5.5%
- By 2040
- 335,246 · +15.7%
- By 2050
- 364,719 · +25.8%
- By 2075
- 436,665 · +50.7%
- By 2100
- 482,920 · +66.6%
Race, ethnicity, and origin ACS 2023
- Neighborhood character
- Diverse neighborhood (Simpson 0.65)
- Race & ethnicity
- White 52% Black 22% Hispanic / Latino 17% Two or more races 11% Asian 4%
- Hispanic origin (detail)
- Mexican 2% Puerto Rican 5% Cuban 2%
- Common ancestry
- Italian 2% Romanian 2% Slovak 2%
- Foreign-born
- 14% · Canada, Jamaica, China
- Languages at home
- 80% English-only · Spanish 12% Other Indo-European 3% French/Haitian/Cajun 1%
Political lean MEDSL · Alachua
- 2024 margin
- Strong D (+21.0) · D 59.7% · R 38.8% · Other 1.5%
- 2008→2024 swing
- -0.6pp no change · 2008: 21.6pp · 2024: 21.0pp
- All cycles
- 2024: D+21.0 2020: D+27.2 2016: D+22.5 2012: D+17.3 2008: D+21.6
Not yet ingested
- Civics
- —
Market trends
- HPI YoY
- ▼ -177.86%
- Current HPI
- 270.183
- Rent YoY
- ▲ 0.60%
- Metro
- Gainesville, FL
- State GDP YoY
- ▲ 3.28%
- F500 in state
- 36
Industry mix (Fortune 500 HQ in FL)
| Industry | F500 HQs | Revenue |
|---|---|---|
| Industrial Technology | 2 | $29B |
|
||
| Insurance | 2 | $17B |
|
||
| Retail | 1 | $60B |
|
||
| Technology Distribution | 1 | $58B |
|
||
| Homebuilding | 1 | $35B |
|
||
| Technology Manufacturing | 1 | $35B |
|
||
Price history
+0.0% since first listed17 events — show timeline
- 2026-06-15 Listed $114,900 Stellar MLS as Distributed by MLS Grid
- 2025-10-03 Listing Removed — Stellar MLS as Distributed by MLS Grid
- 2025-06-06 Relisted — Stellar MLS as Distributed by MLS Grid
- 2025-05-31 Listing Removed — Stellar MLS as Distributed by MLS Grid
- 2025-05-01 Relisted — Stellar MLS as Distributed by MLS Grid
- 2025-04-30 Listing Removed — Stellar MLS as Distributed by MLS Grid
- 2025-02-01 Price Changed $132,000 Stellar MLS as Distributed by MLS Grid
- 2024-11-25 Listed $139,000 Stellar MLS as Distributed by MLS Grid
- 2017-04-26 Sold (Public Records) $50,000 Public Records
- 2010-02-19 Sold (MLS) $45,000 Stellar MLS as Distributed by MLS Grid
- 2010-01-10 Listed $45,000 Stellar MLS as Distributed by MLS Grid
- 2010-01-06 Listing Removed — Stellar MLS as Distributed by MLS Grid
- 2009-07-30 Listed $57,950 Stellar MLS as Distributed by MLS Grid
- 2008-08-04 Listing Removed — Stellar MLS as Distributed by MLS Grid
- 2008-02-04 Listed $90,000 Stellar MLS as Distributed by MLS Grid
- 2005-09-21 Sold (MLS) $114,900 Stellar MLS as Distributed by MLS Grid
- 2005-07-12 Listed $114,900 Stellar MLS as Distributed by MLS Grid
Property tax history
-2.2%/yrLatest (2025): $614 · +6.3% YoY. Source: county tax records.
Cash-flow waterfall
monthlySold comps — $/sqft
last 12 mo · ≤1 miLoading sold comps…