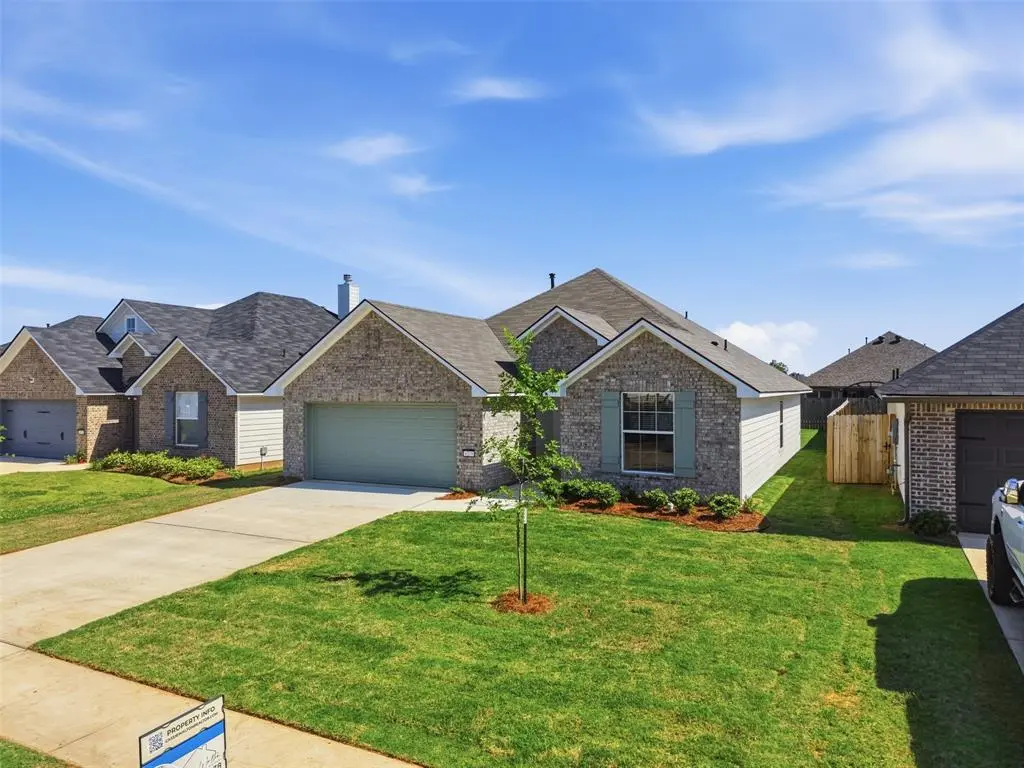
4219 Toledo Bend Dr · Bossier City, LA
Flood risk No data
- FEMA flood zone
- —
- Chance of flooding over 30 yrs
- —
- Est. flood insurance / yr
- —
Fire risk No data
- Est. fire insurance / yr
- —
Heat risk No data
- Hot days now (above threshold)
- —
- Hot days in 30 yrs
- —
Wind risk No data
- Chance of severe wind over 30 yrs
- —
Air-quality risk No data
- Unhealthy air days now
- —
- Unhealthy air days in 30 yrs
- —
Risk factors via First Street. Map © Google.
Why this score? — see what drove the D- grade
The composite is a weighted blend of 9 inputs, each scored 0–100. Each bar is that input's sub-score; the figure is the points it added to the 100-point composite (weight × sub-score).
- Cash flow +9.0/30.0
- ARV discount +7.5/15.0
- Rent growth +4.1/5.0
- Schools +3.8/10.0
- Livability +3.6/5.0
- 1% rule +3.0/10.0
- DSCR +2.5/10.0
- Condition / age +2.5/5.0
- Appreciation +0.0/10.0
$257,040
🖨 Deal sheet (PDF) 📄 Offer letter ✓ Due diligence
Listing remarks
BRAND NEW CONSTRUCTION. Welcome to 4219 Toledo Bend — a beautifully designed new construction home offering 3 bedrooms, 2 bathrooms, and 1,297 square feet of thoughtfully designed living space. From the moment you walk in, you’ll love the open concept featuring the EVANGELINE floorplan, gorgeous neutral color palette, and modern finishes throughout. This home was built with both style and functionality in mind, making it perfect for everyday living and entertaining alike. Neighborhood amenities include a community pool, playground and pond. .. the perfect place to relax without any personal maintenance. The builder is offering $10,000 in buyer concessions, making this an incredi
Key facts
- Pond
- Open concept
- Community pool
Tags
Property features AI
Finance
- Other: Directions: Per GPS; located in the Redwood section of the Legacy neighborhood off of Swan Lake Road
- Financial info: Treat as clear loan type; No second mortgage
- HOA & community: Mandatory association with annual fee; Annual association fee $525; Association covers full use of facilities, grounds maintenance, and management fees; HOA managed by Regency Association Management
Exterior
- Parking: Covered parking for 2 vehicles; Attached 2-car garage (garage faces front)
- Security: Smoke detector(s); Carbon monoxide detector(s)
- Utilities: City water; City sewer; Property not in a municipal utility district
- Home design: Single family residence; One-story; Residential property; Located in the Legacy subdivision
- Construction: New construction completed in 2026; Brick and siding exterior; Shingle roof; Slab foundation
- Exterior features: Covered patio/porch
Interior
- Kitchen: Dishwasher; Disposal; Gas Range; Microwave
- Bedrooms: Primary bedroom on level 1 with ensuite bath, separate shower, and walk-in closet
- Flooring: Carpet; Ceramic tile
- Bathrooms: 2 full bathrooms
- Interior features: Open floorplan; Pantry; Walk-in closet(s); Chandelier and decorative lighting; Window coverings
- Laundry & utility: Utility room
Neighborhood map
What this means for you Summary
Snapshot
- This is a 3-bed/2.0-bath other listed at $257k.
Deal economics
- At list price, monthly cash flow is $-203 ($-2k/yr) — negative.
- To cash-flow at today's rent, offer at most $228k (11.4% below list).
- To meet the 1% rule (rent ≥ 1% of price), the offer needs to be $205k (20.3% below list).
- Recommended offer: $205k (20.3% below list) — sets the bar for 1% rule.
Location & tenants
- Location reads 71/100 on livability (#47 in LA) — a middle-class / working-renter tenant base. Strengths: commute A+, cost of living A+, housing A+; Watch: employment D+, crime F, amenities F.
- Bossier Parish (urban): math 40% / reading 47% proficiency, ranked #17 of 98 in LA (top 17%) — families likely to look elsewhere, expect single-tenant / working-renter base with shorter leases.
- Zoned schools: Bossier Elementary School (math 8% / reading 17%, grade F, #550 of 646 statewide, top 88%, 222 students, 93% FRL); Benton Middle School (math 49% / reading 58%, grade C+, #21 of 218 statewide, top 9%, 850 students, 34% FRL); Benton High School (math 55% / reading 63%, grade C+, #22 of 265 statewide, top 8%, 1,538 students, 28% FRL).
- Market conditions: Rents rising fast (+6.6%/yr); 426 active listings in the ZIP; 7 comparable units currently listed for rent nearby; rentals at typical pace (median 23d on market — plan ~3-4 weeks tenant-placement turnaround); 716 units permitted in Bossier Parish in 2024 (0 in 5+ unit buildings).
- This rent runs 38% of the median local income ($65k/yr) — at the standard rent-burdened threshold; future hikes will face affordability resistance.
Forward outlook
- Local home prices are declining (-3.0%/yr); year-one equity from $2k of loan paydown is wiped out by about $8k of value loss. Plan a longer hold.
- Bossier County population projected at +28% by 2050 — long-run rental-demand tailwind backs the buy-and-hold thesis.
Negotiation context
- Only 4 days on market — expect competitive offers; lowballing is unlikely to land.
Questions for the listing agent
- What do current leases actually rent for vs. the listed asking? Can we see a recent rent roll and the last 12 months of T-12 income?
- What does the HOA fee cover, when was the last increase, and are there any pending special assessments or reserve-fund shortfalls?
- Is there a deadline driving the sale (1031 exchange, divorce, estate, relocation)? That informs how much negotiation room exists.
- Schools are B-rated — typically a magnet for longer-tenancy family renters. What's the average tenant stay here, and is there a school-zone premium baked into asking?
- Crime grade is F in this area — have there been break-ins, vandalism, or insurance claims at this property in the last 3 years? What carrier currently insures it and at what premium?
- The area grade is low — what's the realistic commute time and amenity access for the typical tenant pool here? Any planned neighborhood developments (good or bad) we should know about?
- What's the average days-on-market for RENTAL listings here right now (not sales)? A rising rental-DOM trend means longer vacancies and softer asking-rent achievability than the comps imply.
- What's the recent tenant-quality profile in this submarket — average credit score on applications, eviction rate, late-payment / NSF rate, and stable-employment percentage? A property-management company in the area should have these aggregated.
- How much new for-sale + rental construction is in the pipeline within 1–3 miles? Heavy new supply typically softens prices + rents 12–24 months out; constrained supply supports both.
Investment metrics
- 1% rule
- 0.80% ✗
- Cap rate
- 5.35%
- Cash-on-cash
- -3.38%
- DSCR
- 0.85
- GRM
- 10.5
CMA / ARV
No comps found within radius.
Projected returns pro-forma
-3.0% appreciation · 6.56% rent growth · sell at horizon
- IRR
- -17.9%
- Equity multiple
- 0.35×
- Total profit
- $-46,925
- Equity at exit
- $38,325
- IRR
- -4.3%
- Equity multiple
- 0.67×
- Total profit
- $-23,733
- Equity at exit
- $22,224
Cash invested: $71,971 (down + closing). Projections, not guarantees.
Landlord ↔ Tenant lean methodology
- Overall (STATE)
- 90 Strongly Landlord-Friendly
- State Louisiana
- 90 Strongly Landlord-Friendly · R+12
- County
- — inherits STATE
- City
- — inherits STATE
ZIP-level market 71111
- Home prices YoY
- -34.8%
- Rents YoY
- 6.6%
- Active inventory
- 426
- Price-to-rent
- 10.5×
Monthly cashflow live
- Estimated rent
- $2,047 high interval (Pro) →
- Mortgage (P&I)
- −$1,348
- Tax est. 1.5%
- −$321 /mo · $3,856/yr
- Insurance
- −$107
- HOA
- −$44
- Vacancy / Maint / Mgmt
- −$430
- Net cashflow
- $-203
Break-even live
Sensitivity live
| Price | -10% $-25 | -5% $-114 | +0% $-203 | +5% $-292 | +10% $-381 |
|---|---|---|---|---|---|
| Rent | -10% $-365 | -5% $-284 | +0% $-203 | +5% $-122 | +10% $-41 |
| Rate | -1.0pp $-74 | -0.5pp $-138 | base $-203 | +0.5pp $-270 | +1.0pp $-337 |
UW: 25.0% down · 7.5% · 30yr · 1.5% tax · 5.0% vac · 8.0% maint · 8.0% mgmt
Financing live
Cash to close
- Down payment
- $64,260
- Closing costs
- $7,711
- Reserves months
- —
- Total cash needed
- —
Loan-product check · same deal, 3 products live
Conventional
25% down · 7.5% · 30yr
- Down + closing
- —
- Monthly P&I
- —
- Monthly cashflow
- —
- DSCR
- —
- Eligible?
- —
Personal DTI + credit; lowest rate.
DSCR
20% down · 8.5% · 30yr
- Down + closing
- —
- Monthly P&I
- —
- Monthly cashflow
- —
- DSCR
- —
- Eligible?
- —
No personal income docs; deal must DSCR.
Hard money
10% down · 12.0% · 12mo
- Down + closing
- —
- Monthly P&I
- —
- Monthly cashflow
- —
- DSCR
- —
- Eligible?
- —
Short-term bridge; refi at stabilization.
Rent comps 7 comps
| Address | Beds | Baths | Sqft | Rent | $/sqft | DOM | Units | Dist |
|---|---|---|---|---|---|---|---|---|
| 3348 Grand Lake Dr Bossier City, LA | 3.0 | 2.0 | 1800 | $2,100 | $1.17 | 23d | 1 | 0.09mi |
| 3283 Grand Lake Dr Bossier City, LA | 3.0 | 2.0 | 1302 | $1,950 | $1.50 | 23d | 1 | 0.34mi |
| 3461 Grand Cane Ln Bossier City, LA | 3.0 | 2.0 | 1297 | $2,100 | $1.62 | 15d | 1 | 0.41mi |
| 90 Kingston Xing Bossier City, LA | 1.0–3.0 | 1.0–2.0 | 1150 | $2,015 | $1.75 | 15d | 14 | 0.51mi |
| 217 Norwell Ln Bossier City, LA | 4.0 | 2.5 | 1851 | $2,400 | $1.30 | 23d | 1 | 1.06mi |
| 3055 Vanceville Rd Bossier City, LA | 2.0–3.0 | 2.0 | 1112 | $1,995 | $1.79 | 15d | 6 | 1.11mi |
| 606 Acacia Dr Bossier City, LA | 3.0 | 2.0 | 1765 | $2,200 | $1.25 | 23d | 1 | 1.28mi |
HOA detail
- Monthly dues
- $44 · $528/yr
- Likely covers
- pool
Listing history 1 events
-
2026-05-14$257,040 Active 1092-char remark
ⓘ Source: listings_history table (triggers on properties + properties_extension) + one-shot
backfill from property_details.listing_events for pre-trigger history.
Nearby sold comps map
Loading sold comps map…
Walkable amenities ~0.75 mi
Loading nearby amenities…
Taxation est. · year 1
- Rental income
- $24,568
- − Mortgage interest
- −$14,398
- − Property taxes
- −$3,856
- − Insurance
- −$1,285
- − Repairs & maintenance
- −$1,965
- − Management
- −$1,965
- − HOA
- −$528
- − Depreciation
- −$7,478
- Taxable loss
- −$6,907
- Est. tax savings @ 24.0%
- +$1,658
- After-tax cash flow
- $-778/yr
For passive investors: Depreciation is non-cash, so a rental often shows a tax loss while cash-flowing — sheltering income. Rental losses are passive: they offset passive income freely, and up to $25,000/yr can offset ordinary (W-2) income if you actively participate and your MAGI is under $100k (phasing out to $0 by $150k); unused losses carry forward. On sale, claimed depreciation is recaptured at up to 25%, and gains may owe capital-gains tax (a 1031 exchange can defer both). Figures are a year-1 estimate at your 24.0% rate — not tax advice; consult a CPA.
Schools (NCES district)
- District
- Bossier Parish
- NCES district ID
- 2200270
- Math proficiency
- 40% ▼ -32.00%
- Reading proficiency
- 47% ▼ -28.00%
- Median HH income
- $51,326
- Composite
- 37.5/100
- National rank
- #4402
- State rank
- #17 of 98 in LA
Livability — Bossier City
- Score
- 71/100
- State rank
- #47
- US rank
- #7044
Category grades
Schools grade is shown separately in the Schools card above.
Census & demographics
- County
- Bossier Parish · 98,704 people
- City population
- 91,925
- Metro
- Shreveport-Bossier City, LA
- Population (ZIP)
- 43,925
- Household income
- $65,292
- Rent vs Own
- Severe rent burden
- 1942.0
Population outlook (Bossier County) Hauer SSP2
- Today (2025)
- 143,247 people
- By 2030
- 151,802 · +6.0%
- By 2040
- 168,194 · +17.4%
- By 2050
- 183,533 · +28.1%
- By 2075
- 217,009 · +51.5%
- By 2100
- 230,091 · +60.6%
Race, ethnicity, and origin ACS 2023
- Neighborhood character
- Diverse neighborhood (Simpson 0.60)
- Race & ethnicity
- White 56% Black 29% Hispanic / Latino 9% Two or more races 8% Asian 3%
- Hispanic origin (detail)
- Mexican 5%
- Common ancestry
- Lithuanian 2% Iranian 1% Slovak 1%
- Foreign-born
- 5% · Canada, Vietnam
- Languages at home
- 90% English-only · Spanish 7% Vietnamese 1% French/Haitian/Cajun 1%
Political lean MEDSL · Bossier
- 2024 margin
- Solid R (+43.3) · D 27.7% · R 71.0% · Other 1.3%
- 2008→2024 swing
- +0.3pp no change · 2008: -43.7pp · 2024: -43.3pp
- All cycles
- 2024: R+43.3 2020: R+41.0 2016: R+45.8 2012: R+45.4 2008: R+43.7
Not yet ingested
- Civics
- —
Market trends
- HPI YoY
- ▼ -79.78%
- Current HPI
- 149.4336
- Rent YoY
- ▲ 6.56%
- Metro
- Shreveport-Bossier City, LA
- State GDP YoY
- ▲ 3.29%
- F500 in state
- 10
Industry mix (Fortune 500 HQ in LA)
| Industry | F500 HQs | Revenue |
|---|---|---|
| Telecommunications | 2 | $23B |
|
||
| Utilities | 1 | $12B |
|
||
| Wholesale / Distribution | 1 | $5B |
|
||
| Advertising | 1 | $2B |
|
||
Price history
3 events — show timeline
- 2026-06-01 Sold (MLS) — NTREIS
- 2026-05-19 Pending — NTREIS
- 2026-05-14 Listed $257,040 NTREIS
Property tax history
-1.0%/yrLatest (2025): $183 · -1.0% YoY. Source: county tax records.
Cash-flow waterfall
monthlySold comps — $/sqft
last 12 mo · ≤1 miLoading sold comps…