9250 Grace Ridge Dr · Willis, TX
Flood risk No data
- FEMA flood zone
- —
- Chance of flooding over 30 yrs
- —
- Est. flood insurance / yr
- —
Fire risk No data
- Est. fire insurance / yr
- —
Heat risk No data
- Hot days now (above threshold)
- —
- Hot days in 30 yrs
- —
Wind risk No data
- Chance of severe wind over 30 yrs
- —
Air-quality risk No data
- Unhealthy air days now
- —
- Unhealthy air days in 30 yrs
- —
Risk factors via First Street. Map © Google.
Why this score? — see what drove the F grade
The composite is a weighted blend of 9 inputs, each scored 0–100. Each bar is that input's sub-score; the figure is the points it added to the 100-point composite (weight × sub-score).
- Cash flow +13.3/30.0
- DSCR +4.0/10.0
- Schools +3.2/10.0
- Livability +3.1/5.0
- 1% rule +2.9/10.0
- ARV discount +2.5/15.0
- Condition / age +2.5/5.0
- Rent growth +2.0/5.0
- Appreciation +0.0/10.0
$299,990
🖨 Deal sheet 📄 Offer letter ✓ Due diligence
Listing remarks MLS
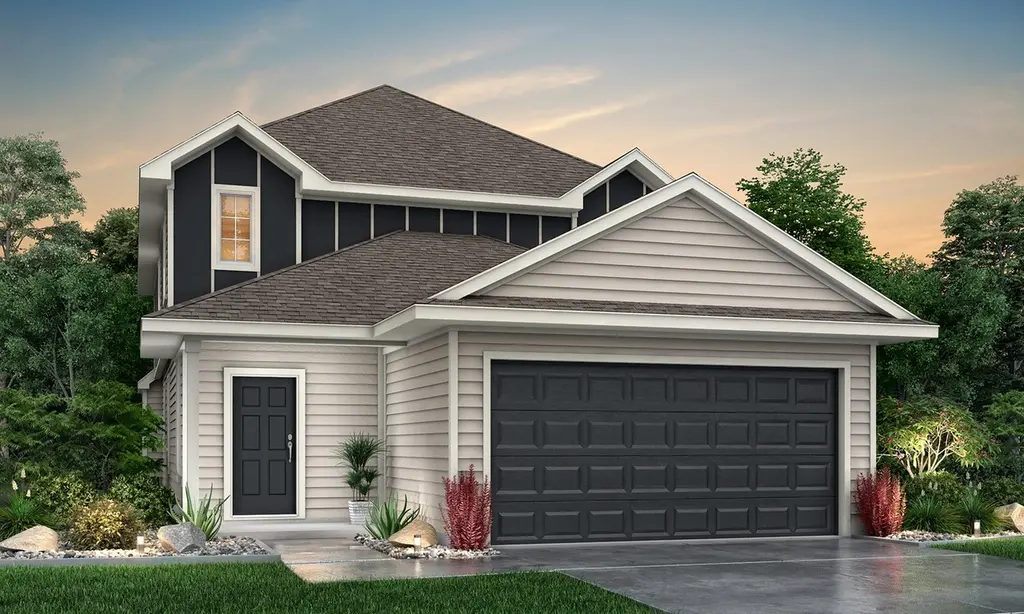
The Redbud is a 2-story home with 5 bedrooms, 3.5 baths, and features a kitchen with abundant counter space, an oversized 1st floor primary suite, and upstairs game room.
Key facts
- Smart home package
- Resort style pool
- Stunning pavilion
Tags
Neighborhood map
What this means for you Summary
Snapshot
- This is a 5-bed/3.5-bath land listed at $300k.
Deal economics
- At list price, monthly cash flow is $2 ($23/yr) — positive.
- The deal already cash-flows at list — no discount required.
- To meet the 1% rule (rent ≥ 1% of price), the offer needs to be $237k (20.9% below list).
- Recommended offer: $237k (20.9% below list) — sets the bar for 1% rule.
- Cap rate 6.3% vs local median 4.7% in Willis — top-decile yield for the area; either an underpriced asset or a hidden risk that comps aren't pricing in. Stress-test before assuming the spread holds.
Location & tenants
- Location reads 62/100 on livability (#933 in TX) — a middle-class / working-renter tenant base. Strengths: cost of living A+, housing A+; Watch: crime C-, schools D+, employment D+.
- Willis ISD (rural): math 33% / reading 40% proficiency, ranked #458 of 826 in TX (top 55%) — families likely to look elsewhere, expect single-tenant / working-renter base with shorter leases.
- Market conditions: Rents soft (-2.1%/yr); 1189 active listings in the ZIP; solid renter incomes; 13,259 units permitted in Montgomery County in 2024 (1,402 in 5+ unit buildings).
- This rent runs 31% of the median local income ($92k/yr) — at the standard rent-burdened threshold; future hikes will face affordability resistance.
Forward outlook
- Local home prices are declining (-3.0%/yr); year-one equity from $2k of loan paydown is wiped out by about $9k of value loss. Plan a longer hold.
- Montgomery County population projected at +65% by 2050 — long-run rental-demand tailwind backs the buy-and-hold thesis.
Negotiation context
- It's been on market 31 days — a 3% lower offer ($291k) is reasonable based on typical stale-listing flexibility.
- 2 sale attempts with the ask held roughly flat each time — persistent listings suggest the price (not the market) is what's stuck; bring a comps-based counter.
Questions for the listing agent
- It's been on market 31 days. Have you received any prior offers? Is the seller open to a 21% concession, seller financing, or rate buy-down credit?
- What does the HOA fee cover, when was the last increase, and are there any pending special assessments or reserve-fund shortfalls?
- Is there a deadline driving the sale (1031 exchange, divorce, estate, relocation)? That informs how much negotiation room exists.
- Schools are D-rated, which usually means shorter tenancies and higher turnover. Who's the typical renter profile here, and what's been the actual vacancy rate?
- The area grade is low — what's the realistic commute time and amenity access for the typical tenant pool here? Any planned neighborhood developments (good or bad) we should know about?
- What's the average days-on-market for RENTAL listings here right now (not sales)? A rising rental-DOM trend means longer vacancies and softer asking-rent achievability than the comps imply.
- What's the recent tenant-quality profile in this submarket — average credit score on applications, eviction rate, late-payment / NSF rate, and stable-employment percentage? A property-management company in the area should have these aggregated.
- How much new for-sale + rental construction is in the pipeline within 1–3 miles? Heavy new supply typically softens prices + rents 12–24 months out; constrained supply supports both.
Investment metrics
- 1% rule
- 0.79% ✗
- Cap rate
- 6.30%
- Cash-on-cash
- 0.03%
- DSCR
- 1.00
- GRM
- 10.5
CMA / ARV
- ARV (median comp)
- $269,984
- List price
- $299,990
- Delta
- 11.11%
- Verdict
- OVERPRICED
- Comps
- 20 within 1.0 mi
Projected returns pro-forma
-3.0% appreciation · 0.0% rent growth · sell at horizon
- IRR
- -19.4%
- Equity multiple
- 0.34×
- Total profit
- $-55,532
- Equity at exit
- $44,729
- IRR
- -19.1%
- Equity multiple
- 0.10×
- Total profit
- $-75,430
- Equity at exit
- $25,938
Cash invested: $83,997 (down + closing). Projections, not guarantees.
Landlord ↔ Tenant lean methodology
- Overall (STATE)
- 87 Strongly Landlord-Friendly
- State Texas
- 87 Strongly Landlord-Friendly · R+5
- County
- — inherits STATE
- City
- — inherits STATE
ZIP-level market 77318
- Home prices YoY
- -32.7%
- Rents YoY
- -2.1%
- Active inventory
- 1189
- Price-to-rent
- 10.5×
Monthly cashflow live
- Estimated rent
- $2,373 medium interval (Pro) →
- Mortgage (P&I)
- −$1,573
- Tax from tax record
- −$105 /mo · $1,265/yr
- Insurance
- −$125
- HOA
- −$69
- Vacancy / Maint / Mgmt
- −$498
- Net cashflow
- $2
Break-even live
UW: 25.0% down · 7.5% · 30yr · 1.5% tax · 5.0% vac · 8.0% maint · 8.0% mgmt
Financing live
Cash to close
- Down payment
- $74,998
- Closing costs
- $9,000
- Reserves months
- —
- Total cash needed
- —
Loan-product check · same deal, 3 products live
Conventional
25% down · 7.5% · 30yr
- Down + closing
- —
- Monthly P&I
- —
- Monthly cashflow
- —
- DSCR
- —
- Eligible?
- —
Personal DTI + credit; lowest rate.
DSCR
20% down · 8.5% · 30yr
- Down + closing
- —
- Monthly P&I
- —
- Monthly cashflow
- —
- DSCR
- —
- Eligible?
- —
No personal income docs; deal must DSCR.
Hard money
10% down · 12.0% · 12mo
- Down + closing
- —
- Monthly P&I
- —
- Monthly cashflow
- —
- DSCR
- —
- Eligible?
- —
Short-term bridge; refi at stabilization.
HOA detail
- Monthly dues
- $69 · $828/yr
Listing history 11 events
-
2026-06-18days on market $299,990 Active 31 DOM
-
2026-06-17remarks 688-char remark
-
2026-06-17days on market $299,990 Active 30 DOM
-
2026-06-17days on market $299,990 Active 27 DOM
-
2026-06-16days on market $299,990 Active 26 DOM
-
2026-06-15days on market $299,990 Active 25 DOM
-
2026-06-13pricestatusdays on market $299,990 Active 23 DOM
-
2026-05-05price $302,990 170-char remark
Show marketing remark (170 chars)
The Redbud is a 2-story home with 5 bedrooms, 3.5 baths, and features a kitchen with abundant counter space, an oversized 1st floor primary suite, and upstairs game room.
-
2026-05-04price $302,990 1010-char remark
Show marketing remark (1010 chars)
Love where you live in Ridgeland Hills in Willis, TX! Ridgeland Hills has convenient access directly to I-45 and features a stunning pavilion, resort style pool, large community playground and a boardwalk along the water for fishing! Now featuring Legend’s NEW Smart Home package and Signature Series Design Collection! The Redbud floor plan is a spacious two-story home with 5 bedrooms, 3.5 baths, game room, and 2-car garage. This home has it all - including privacy blinds and vinyl plank flooring throughout the common areas! The gourmet kitchen is sure to please with 42" cabinets, silestone countertops, and stainless-steel appliances! You'll love the kitchen layout with extra counterspace and a center island! Retreat to the first-floor Owner's Suite featuring a box window, double sinks with silestone countertops, separate tub and shower, and a walk-in closet! Enjoy the great outdoors with a covered patio! Don't miss your opportunity to call Ridgeland Hills home, schedule a visit today!
-
2026-05-02$305,195 Active 170-char remark
Show marketing remark (170 chars)
The Redbud is a 2-story home with 5 bedrooms, 3.5 baths, and features a kitchen with abundant counter space, an oversized 1st floor primary suite, and upstairs game room.
-
2026-04-22$303,414 Active 1010-char remark
Show marketing remark (1010 chars)
Love where you live in Ridgeland Hills in Willis, TX! Ridgeland Hills has convenient access directly to I-45 and features a stunning pavilion, resort style pool, large community playground and a boardwalk along the water for fishing! Now featuring Legend’s NEW Smart Home package and Signature Series Design Collection! The Redbud floor plan is a spacious two-story home with 5 bedrooms, 3.5 baths, game room, and 2-car garage. This home has it all - including privacy blinds and vinyl plank flooring throughout the common areas! The gourmet kitchen is sure to please with 42" cabinets, silestone countertops, and stainless-steel appliances! You'll love the kitchen layout with extra counterspace and a center island! Retreat to the first-floor Owner's Suite featuring a box window, double sinks with silestone countertops, separate tub and shower, and a walk-in closet! Enjoy the great outdoors with a covered patio! Don't miss your opportunity to call Ridgeland Hills home, schedule a visit today!
ⓘ Source: listings_history table (triggers on properties + properties_extension) + one-shot
backfill from property_details.listing_events for pre-trigger history.
Tax reassessment forecast TX · Resets to sale price
- Current annual tax
- $1,265 · $105/mo
- Projected year-2 tax
- $5,490 · $457/mo
- Expected delta
- +$4,225/yr (+$352/mo · 334.1%)
ⓘ Screening estimate from a state-policy table — verify with the county assessor before closing.
Nearby sold comps map
Loading sold comps map…
Walkable amenities ~0.75 mi
Loading nearby amenities…
Taxation est. · year 1
- Rental income
- $28,473
- − Mortgage interest
- −$16,804
- − Property taxes
- −$1,265
- − Insurance
- −$1,500
- − Repairs & maintenance
- −$2,278
- − Management
- −$2,278
- − HOA
- −$828
- − Depreciation
- −$8,727
- Taxable loss
- −$5,207
- Est. tax savings @ 24.0%
- +$1,250
- After-tax cash flow
- $1,272/yr
For passive investors: Depreciation is non-cash, so a rental often shows a tax loss while cash-flowing — sheltering income. Rental losses are passive: they offset passive income freely, and up to $25,000/yr can offset ordinary (W-2) income if you actively participate and your MAGI is under $100k (phasing out to $0 by $150k); unused losses carry forward. On sale, claimed depreciation is recaptured at up to 25%, and gains may owe capital-gains tax (a 1031 exchange can defer both). Figures are a year-1 estimate at your 24.0% rate — not tax advice; consult a CPA.
Schools (NCES district)
- District
- Willis ISD
- NCES district ID
- 4845900
- Math proficiency
- 33% ▼ -15.00%
- Reading proficiency
- 40% ▼ -2.00%
- Median HH income
- $57,828
- Composite
- 32.32/100
- National rank
- #5746
- State rank
- #458 of 826 in TX
Livability — Willis
- Score
- 62/100
- State rank
- #933
- US rank
- #16579
Category grades
Schools grade is shown separately in the Schools card above.
Census & demographics
- County
- Montgomery County · 663,713 people
- City population
- 38,421
- Metro
- Houston-The Woodlands-Sugar Land, TX
- Population (ZIP)
- 20,792
- Household income
- $92,415
- Rent vs Own
- Severe rent burden
- 279.0
Population outlook (Montgomery County) Hauer SSP2
- Today (2025)
- 713,896 people
- By 2030
- 805,263 · +12.8%
- By 2040
- 992,708 · +39.1%
- By 2050
- 1,179,590 · +65.2%
- By 2075
- 1,628,084 · +128.1%
- By 2100
- 1,937,880 · +171.5%
Race, ethnicity, and origin ACS 2023
- Neighborhood character
- Predominantly White (72%)
- Race & ethnicity
- White 72% Hispanic / Latino 17% Two or more races 14% Black 3%
- Hispanic origin (detail)
- Mexican 12%
- Common ancestry
- Lithuanian 4% Slovak 2% Serbian 2%
- Foreign-born
- 6% · Canada, Jamaica
- Languages at home
- 88% English-only · Spanish 10%
Political lean MEDSL · Montgomery
- 2024 margin
- Solid R (+45.5) · D 26.8% · R 72.3%
- 2008→2024 swing
- +7.2pp toward D · 2008: -52.7pp · 2024: -45.5pp
- All cycles
- 2024: R+45.5 2020: R+43.8 2016: R+51.4 2012: R+60.7 2008: R+52.7
Not yet ingested
- Civics
- —
Market trends
- HPI YoY
- ▼ -114.58%
- Current HPI
- 236.256
- Rent YoY
- ▼ -2.09%
- Metro
- Houston-The Woodlands-Sugar Land, TX
- State GDP YoY
- ▲ 3.95%
- F500 in state
- 110
Industry mix (Fortune 500 HQ in TX)
| Industry | F500 HQs | Revenue |
|---|---|---|
| Energy | 16 | $1,198B |
|
||
| Technology | 5 | $198B |
|
||
| Engineering / Construction | 4 | $72B |
|
||
| Energy Services | 3 | $60B |
|
||
| Utilities | 3 | $41B |
|
||
| Healthcare | 2 | $330B |
|
||
Price history
-0.1% since first listed4 events — show timeline
- 2026-05-05 Price Changed $302,990 Zillow
- 2026-05-04 Price Changed $302,990 HARMLS
- 2026-05-02 Listed $305,195 Zillow
- 2026-04-22 Listed $303,414 HARMLS
Property tax history
-14.2%/yrLatest (2025): $1,265 · -14.2% YoY. Source: county tax records.
Cash-flow waterfall
monthlySold comps — $/sqft
last 12 mo · ≤1 miLoading sold comps…