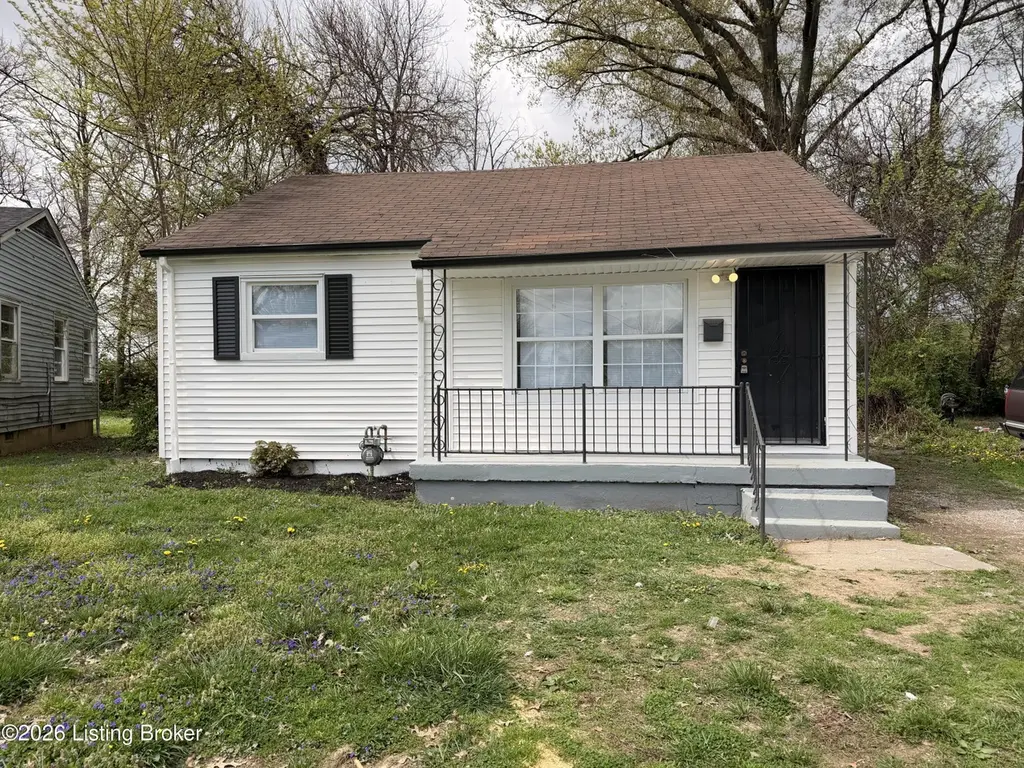
3618 Hudson Ave · Louisville, KY
Flood risk 1/10 · Minimal
- FEMA flood zone
- X (shaded)
- Chance of flooding over 30 yrs
- 0.0%
- Est. flood insurance / yr
- $507 – $1,088
Fire risk 2/10 · Minimal
- Est. fire insurance / yr
- $839 – $1,559
Heat risk 5/10 · Moderate
- Hot days now (above 105°F)
- 7 days/yr
- Hot days in 30 yrs
- 20 days/yr
Wind risk 2/10 · Minimal
- Chance of severe wind over 30 yrs
- 1.0%
Air-quality risk 2/10 · Minimal
- Unhealthy air days now
- 1 days/yr
- Unhealthy air days in 30 yrs
- 3 days/yr
Risk factors via First Street. Map © Google.
Why this score? — see what drove the D grade
The composite is a weighted blend of 9 inputs, each scored 0–100. Each bar is that input's sub-score; the figure is the points it added to the 100-point composite (weight × sub-score).
- Cash flow +15.6/30.0
- ARV discount +6.0/15.0
- DSCR +4.8/10.0
- Rent growth +3.7/5.0
- 1% rule +3.3/10.0
- Livability +3.2/5.0
- Condition / age +2.5/5.0
- Schools +2.3/10.0
- Appreciation +0.0/10.0
$150,000
🖨 Deal sheet (PDF) 📄 Offer letter ✓ Due diligence
Listing remarks MLS
A great first time home with that extra 4th bedroom. This home has been remodeled with new carpet, kitchen flooring, freshly painted, new windows, updated electrical, new central air, and some new siding, as well as, bathroom fixtures. This home is ready for a new family that would like low monthly payments. Ideal for a Metro-County Government Grant. The seller is providing a home warranty. the seller is related to the listing agent.
Key facts
- White cabinets
- Front porch
- New flooring
Tags
Property features AI
Finance
- Other: Subdivision: Algonquin Terrace
- HOA & community: No association fee; No monthly maintenance
Exterior
- Parking: Driveway
- Utilities: Electricity connected; Natural gas available; One HVAC unit
- Home design: Single-family ranch-style home; 1 story; Facing information not provided
- Construction: Built in 1953; Vinyl siding; Shingle roof; Poured concrete foundation
- Exterior features: Partial fencing; Located on a cul-de-sac
Interior
- Kitchen: Kitchen on the first floor; Dining area on the first floor
- Bedrooms: 3 bedrooms, all on the first floor
- Bathrooms: 1 full bathroom on the first floor
- Heating & cooling: Forced air heating; Central air conditioning
- Interior features: 6 total rooms; 6 closets; Basement (cellar)
- Laundry & utility: First-floor laundry
Neighborhood map
What this means for you Summary
Snapshot
- This is a 3-bed/1.0-bath single-family listed at $150k.
Deal economics
- At list price, monthly cash flow is $64 ($773/yr) — positive.
- The deal already cash-flows at list — no discount required.
- To meet the 1% rule (rent ≥ 1% of price), the offer needs to be $125k (16.5% below list).
- Recommended offer: $125k (16.5% below list) — sets the bar for 1% rule.
- Cap rate 6.8% vs local median 5.0% in Louisville — top-decile yield for the area; either an underpriced asset or a hidden risk that comps aren't pricing in. Stress-test before assuming the spread holds.
Location & tenants
- Location reads 63/100 on livability (#333 in KY) — a middle-class / working-renter tenant base. Strengths: cost of living A+, housing A+; Watch: employment C-, health & safety D+, crime F.
- Jefferson County (urban): math 19% / reading 35% proficiency, ranked #121 of 165 in KY (top 73%) — low school quality limits family demand, transient renter base, plan for 1-2y turnover.
- Zoned schools: Crums Lane Elementary (math 8% / reading 27%, grade F, #602 of 676 statewide, top 90%, 373 students, 77% FRL); Stuart Academy (math 4% / reading 17%, grade F, #216 of 217 statewide, top 100%, 1,105 students, 72% FRL); Western High (math 2% / reading 12%, grade F, #248 of 254 statewide, top 98%, 869 students, 77% FRL) — zoned schools average 75% FRL vs 56% district-wide (20 pts higher); higher-poverty schools than district average — tighter screening recommended.
- Zoned-school proficiency averages 12% at this address vs 27% district-wide (-15 pts) — the specific schools serving this property underperform the Jefferson County average; the district grade overstates school quality for this exact location.
- Market conditions: Rents rising fast (+4.9%/yr); 144 active listings in the ZIP; 31 comparable units currently listed for rent nearby; rentals at typical pace (median 18d on market — plan ~3-4 weeks tenant-placement turnaround); lower-income renter base — watch delinquency; 2,836 units permitted in Jefferson County in 2024 (1,558 in 5+ unit buildings).
Forward outlook
- Local home prices are declining (-3.0%/yr); year-one equity from $1k of loan paydown is wiped out by about $4k of value loss. Plan a longer hold.
- Jefferson County population projected at +13% by 2050 — modest demand growth; plan on rents tracking national, not racing it.
Negotiation context
- It's been on market 16 days — a 2% lower offer ($148k) is reasonable based on typical stale-listing flexibility.
- 2 sale attempts since 7y ago; this cycle's ask has dropped $15k (9%) from the opening price — seller is motivated, your offer sets the floor, not the list.
- Current owner paid $85k; list at $150k implies a 76% gain — meaningful room to come down on a strong offer.
Risks & watch-outs
- Watch-outs: built in 1953 — expect roof / HVAC / electrical / plumbing capex.
- Climate carrying-cost: extreme-heat days projected 7→20/yr by 2055 (HVAC capex compounding) — expect insurance premiums to compound above CPI over the hold.
Questions for the listing agent
- Built in 1953 — when were the roof, HVAC, electrical panel, plumbing, and water heater last replaced?
- Is there a deadline driving the sale (1031 exchange, divorce, estate, relocation)? That informs how much negotiation room exists.
- Schools are D-rated, which usually means shorter tenancies and higher turnover. Who's the typical renter profile here, and what's been the actual vacancy rate?
- Crime grade is F in this area — have there been break-ins, vandalism, or insurance claims at this property in the last 3 years? What carrier currently insures it and at what premium?
- The area grade is low — what's the realistic commute time and amenity access for the typical tenant pool here? Any planned neighborhood developments (good or bad) we should know about?
- What's the average days-on-market for RENTAL listings here right now (not sales)? A rising rental-DOM trend means longer vacancies and softer asking-rent achievability than the comps imply.
- What's the recent tenant-quality profile in this submarket — average credit score on applications, eviction rate, late-payment / NSF rate, and stable-employment percentage? A property-management company in the area should have these aggregated.
- How much new for-sale + rental construction is in the pipeline within 1–3 miles? Heavy new supply typically softens prices + rents 12–24 months out; constrained supply supports both.
Investment metrics
- 1% rule
- 0.83% ✗
- Cap rate
- 6.81%
- Cash-on-cash
- 1.84%
- DSCR
- 1.08
- GRM
- 10.0
CMA / ARV
- ARV (on-the-fly)
- $145,152
- Comps found
- 7
Show comp detail 7 sales within ~0.75 mi
| Address | Dist | Beds/Ba | Sqft | Sold | Price | $/sf | Match |
|---|---|---|---|---|---|---|---|
| 3326 Penway Ave | 0.25mi | 3/1.0 | 1,022 (+1%) | 14mo | $158,000 | $155 | 74 |
| 3721 Penway Ave | 0.15mi | 3/2.0 | 1,080 (+7%) | 10mo | $170,000 | $157 | 69 |
| 2031 S 41st St | 0.46mi | 2/1.0 (-1) | 1,056 (+5%) | 21mo | $130,000 | $123 | 48 |
| 3410 Chauncey Ave | 0.64mi | 2/1.0 (-1) | 1,044 (+4%) | 14mo | $72,500 | $69 | 48 |
| 3305 Pacific Ct | 0.44mi | 4/1.5 (+1) | 1,125 (+12%) | 14mo | $200,000 | $178 | 41 |
| 1504 Weaver Ct | 0.72mi | 4/2.0 (+1) | 1,104 (+10%) | 5mo | $105,000 | $95 | 37 |
| 3010 Wyandotte Ave | 0.61mi | 4/1.0 (+1) | 1,148 (+14%) | 12mo | $165,000 | $144 | 33 |
Match score weights: distance 35% · size 25% · config 20% · recency 20%. Top-matched comps best support the ARV.
Projected returns pro-forma
-3.0% appreciation · 4.87% rent growth · sell at horizon
- IRR
- -11.5%
- Equity multiple
- 0.57×
- Total profit
- $-17,852
- Equity at exit
- $22,365
- IRR
- -0.1%
- Equity multiple
- 0.99×
- Total profit
- $-233
- Equity at exit
- $12,969
Cash invested: $42,000 (down + closing). Projections, not guarantees.
Landlord ↔ Tenant lean methodology
- Overall (STATE)
- 83 Strongly Landlord-Friendly
- State Kentucky
- 83 Strongly Landlord-Friendly · R+16
- County
- — inherits STATE
- City
- — inherits STATE
ZIP-level market 40211
- Home prices YoY
- -33.4%
- Rents YoY
- 4.9%
- Active inventory
- 144
- Price-to-rent
- 10.0×
Monthly cashflow live
- Estimated rent
- $1,252 high interval (Pro) →
- Mortgage (P&I)
- −$787
- Tax from tax record
- −$75 /mo · $906/yr
- Insurance
- −$62
- HOA
- −$0
- Vacancy / Maint / Mgmt
- −$263
- Net cashflow
- $64
Break-even live
Sensitivity live
| Price | -10% $149 | -5% $107 | +0% $64 | +5% $22 | +10% $-20 |
|---|---|---|---|---|---|
| Rent | -10% $-34 | -5% $15 | +0% $64 | +5% $114 | +10% $163 |
| Rate | -1.0pp $140 | -0.5pp $103 | base $64 | +0.5pp $26 | +1.0pp $-14 |
UW: 25.0% down · 7.5% · 30yr · 1.5% tax · 5.0% vac · 8.0% maint · 8.0% mgmt
Financing live
Cash to close
- Down payment
- $37,500
- Closing costs
- $4,500
- Reserves months
- —
- Total cash needed
- —
Loan-product check · same deal, 3 products live
Conventional
25% down · 7.5% · 30yr
- Down + closing
- —
- Monthly P&I
- —
- Monthly cashflow
- —
- DSCR
- —
- Eligible?
- —
Personal DTI + credit; lowest rate.
DSCR
20% down · 8.5% · 30yr
- Down + closing
- —
- Monthly P&I
- —
- Monthly cashflow
- —
- DSCR
- —
- Eligible?
- —
No personal income docs; deal must DSCR.
Hard money
10% down · 12.0% · 12mo
- Down + closing
- —
- Monthly P&I
- —
- Monthly cashflow
- —
- DSCR
- —
- Eligible?
- —
Short-term bridge; refi at stabilization.
Rent comps 31 comps
| Address | Beds | Baths | Sqft | Rent | $/sqft | DOM | Units | Dist |
|---|---|---|---|---|---|---|---|---|
| 3313 Penway Ave Louisville, KY | 4.0 | 2.0 | 1142 | $1,645 | $1.44 | 25d | 1 | 0.31mi |
| 2128 S 40th St Louisville, KY | 2.0 | 1.0 | 942 | $980 | $1.04 | 17d | 1 | 0.33mi |
| 1804 Russell Lee Dr Louisville, KY | 1.0–3.0 | 1.0–1.5 | 810 | $1,304 | $1.61 | 3d | 1 | 0.40mi |
| 2016 S 40th St Louisville, KY | 2.0 | 1.0 | 700 | $980 | $1.40 | 17d | 1 | 0.41mi |
| 3019 Penway Ave Louisville, KY | 2.0 | 1.0 | 700 | $960 | $1.37 | 13d | 1 | 0.50mi |
| 3005 Linwood Ave Louisville, KY | 2.0 | 1.0 | 700 | $1,025 | $1.46 | 17d | 1 | 0.55mi |
| 3004 Wyandotte Ave Louisville, KY | 2.0 | 1.0 | 700 | $1,200 | $1.71 | 17d | 1 | 0.63mi |
| 1927 S 28th St Louisville, KY | 2.0 | 1.0 | 700 | $1,200 | $1.71 | 25d | 1 | 0.70mi |
| 1622 Beech St Louisville, KY | 4.0 | 1.0 | 1108 | $1,445 | $1.30 | 17d | 1 | 0.74mi |
| 2629 Olive St Louisville, KY | 4.0 | 1.0 | 1120 | $1,500 | $1.34 | 25d | 1 | 0.79mi |
| 2706 Wyandotte Ave Louisville, KY | 2.0 | 1.0 | 756 | $1,295 | $1.71 | 5d | 1 | 0.84mi |
| 1439 Beech St Apt 1 Louisville, KY | 3.0 | 1.5 | 1000 | $820 | $0.82 | 25d | 1 | 0.96mi |
| 1418 Beech St Unit 2 Louisville, KY | 2.0 | 1.0 | 1000 | $980 | $0.98 | 23d | 1 | 0.98mi |
| 3611 Regatta Way Louisville, KY | 3.0 | 1.0 | 1035 | $1,450 | $1.40 | 17d | 1 | 1.00mi |
| 2311 Plantation Dr Louisville, KY | 3.0 | 1.0 | 988 | $1,200 | $1.21 | 17d | 1 | 1.04mi |
| 2400 Burwell Ave Louisville, KY | 2.0 | 1.0 | 972 | $895 | $0.92 | 17d | 1 | 1.10mi |
| 1816 Gregg Ave Louisville, KY | 2.0 | 2.0 | 773 | $1,100 | $1.42 | 17d | 1 | 1.13mi |
| 3215 Virginia Ave Louisville, KY | 3.0 | 1.0 | 975 | $924 | $0.95 | 25d | 1 | 1.21mi |
| 1145 Louis Coleman Jr Dr Louisville, KY | 2.0 | 1.0 | 913 | $875 | $0.96 | 25d | 1 | 1.22mi |
| 1339 S 28th St Unit 3 Louisville, KY | 3.0 | 1.0 | 1125 | $1,175 | $1.04 | 22d | 1 | 1.25mi |
| 4514 Winnrose Way Louisville, KY | 3.0 | 1.5 | 1064 | $1,500 | $1.41 | 3d | 1 | 1.26mi |
| 2913 Dumesnil St Apt 3 Louisville, KY | 3.0 | 1.0 | 1112 | $740 | $0.67 | 12d | 1 | 1.26mi |
| 3514 Grand Ave Louisville, KY | 3.0 | 1.5 | 1450 | $1,295 | $0.89 | 23d | 1 | 1.31mi |
| 1115 S 32nd St Louisville, KY | 3.0 | 1.0 | 1393 | $1,275 | $0.92 | 23d | 1 | 1.35mi |
| 1115 S 32nd St Louisville, KY | 3.0 | 1.0 | 1393 | $1,275 | $0.92 | 25d | 1 | 1.35mi |
| 1726 Sonne Ave Louisville, KY | 2.0 | 1.0 | 820 | $1,095 | $1.34 | 17d | 1 | 1.37mi |
| 1410 Standard Village Cir Louisville, KY | 3.0 | 2.0 | 1200 | $900 | $0.75 | 25d | 1 | 1.39mi |
| 4221 Sunset Ave Louisville, KY | 3.0 | 1.0 | 1075 | $1,199 | $1.12 | 25d | 1 | 1.42mi |
| 1155 S 28th St Unit 4 Louisville, KY | 4.0 | 2.0 | 1010 | $1,350 | $1.34 | 25d | 1 | 1.42mi |
| 1731 Sonne Ave Louisville, KY | 3.0 | 1.0 | 1010 | $1,300 | $1.29 | 17d | 1 | 1.42mi |
| 2614 Virginia Ave Louisville, KY | 2.0 | 1.0 | 975 | $925 | $0.95 | 25d | 1 | 1.48mi |
Listing history 21 events
-
2026-06-21days on market $150,000 Active 16 DOM
-
2026-06-18days on market $150,000 Active 13 DOM
-
2026-06-17days on market $150,000 Active 12 DOM
-
2026-06-16days on market $150,000 Active 11 DOM
-
2026-06-15days on market $150,000 Active 10 DOM
-
2026-06-13days on market $150,000 Active 8 DOM
-
2026-06-10days on market $150,000 Active 5 DOM
-
2026-06-09days on market $150,000 Active 4 DOM
-
2026-06-08days on market $150,000 Active 3 DOM
-
2026-06-07remarks 699-char remark
-
2026-06-07pricedays on market $150,000 Active 2 DOM
-
2026-06-01days on market $165,000 Active 11 DOM
-
2026-05-31days on market $165,000 Active 10 DOM
-
2026-05-21$165,000 Active
-
2026-04-15price $174,999
-
2026-02-23soldstatus $85,000
-
2019-10-21soldstatus $66,000
-
2019-10-16soldstatus $66,000 Closed 442-char remark
Show marketing remark (442 chars)
A great first time home with that extra 4th bedroom. This home has been remodeled with new carpet, kitchen flooring, freshly painted, new windows, updated electrical, new central air, and some new siding, as well as, bathroom fixtures. This home is ready for a new family that would like low monthly payments. Ideal for a Metro-County Government Grant. The seller is providing a home warranty. the seller is related to the listing agent.
-
2019-09-04status Pending 442-char remark
Show marketing remark (442 chars)
A great first time home with that extra 4th bedroom. This home has been remodeled with new carpet, kitchen flooring, freshly painted, new windows, updated electrical, new central air, and some new siding, as well as, bathroom fixtures. This home is ready for a new family that would like low monthly payments. Ideal for a Metro-County Government Grant. The seller is providing a home warranty. the seller is related to the listing agent.
-
2019-08-25$66,000 Active 442-char remark
Show marketing remark (442 chars)
A great first time home with that extra 4th bedroom. This home has been remodeled with new carpet, kitchen flooring, freshly painted, new windows, updated electrical, new central air, and some new siding, as well as, bathroom fixtures. This home is ready for a new family that would like low monthly payments. Ideal for a Metro-County Government Grant. The seller is providing a home warranty. the seller is related to the listing agent.
-
2019-08-25price $66,000 442-char remark
Show marketing remark (442 chars)
A great first time home with that extra 4th bedroom. This home has been remodeled with new carpet, kitchen flooring, freshly painted, new windows, updated electrical, new central air, and some new siding, as well as, bathroom fixtures. This home is ready for a new family that would like low monthly payments. Ideal for a Metro-County Government Grant. The seller is providing a home warranty. the seller is related to the listing agent.
ⓘ Source: listings_history table (triggers on properties + properties_extension) + one-shot
backfill from property_details.listing_events for pre-trigger history.
Tax reassessment forecast KY · Resets to sale price
- Current annual tax
- $906 · $75/mo
- Projected year-2 tax
- $1,290 · $108/mo
- Expected delta
- +$384/yr (+$32/mo · 42.4%)
ⓘ Screening estimate from a state-policy table — verify with the county assessor before closing.
Climate risk First Street
- Flood 1/10 Low FEMA zone X (shaded) · 0% chance over 30 yrs
- Wildfire 2/10 Low
- Heat 5/10 Major 7 d/yr ≥105°F today · 20 d/yr by 30 yrs out
- Wind 2/10 Low 100% chance of damaging wind over 30 yrs
- Air quality 2/10 Low 1 unhealthy d/yr today · 3 by 30 yrs out
Nearby sold comps map
Loading sold comps map…
Walkable amenities ~0.75 mi
Loading nearby amenities…
Taxation est. · year 1
- Rental income
- $15,024
- − Mortgage interest
- −$8,402
- − Property taxes
- −$906
- − Insurance
- −$750
- − Repairs & maintenance
- −$1,202
- − Management
- −$1,202
- − Depreciation
- −$4,364
- Taxable loss
- −$1,802
- Est. tax savings @ 24.0%
- +$432
- After-tax cash flow
- $1,206/yr
For passive investors: Depreciation is non-cash, so a rental often shows a tax loss while cash-flowing — sheltering income. Rental losses are passive: they offset passive income freely, and up to $25,000/yr can offset ordinary (W-2) income if you actively participate and your MAGI is under $100k (phasing out to $0 by $150k); unused losses carry forward. On sale, claimed depreciation is recaptured at up to 25%, and gains may owe capital-gains tax (a 1031 exchange can defer both). Figures are a year-1 estimate at your 24.0% rate — not tax advice; consult a CPA.
Schools (NCES district)
- District
- Jefferson County
- NCES district ID
- 2102990
- Math proficiency
- 19% ▼ -17.00%
- Reading proficiency
- 35% ▼ -11.00%
- Median HH income
- $47,885
- Composite
- 23.45/100
- National rank
- #7884
- State rank
- #121 of 165 in KY
Livability — Louisville
- Score
- 63/100
- State rank
- #333
- US rank
- #15887
Category grades
Schools grade is shown separately in the Schools card above.
Census & demographics
- Census place
- Louisville, KY
- County
- Jefferson County · 790,184 people
- City population
- 769,292
- Metro
- Louisville/Jefferson County, KY-IN
- Population (ZIP)
- 20,407
- Household income
- $31,749
- Rent vs Own
- Severe rent burden
- 1483.0
Population outlook (Jefferson County) Hauer SSP2
- Today (2025)
- 823,112 people
- By 2030
- 849,343 · +3.2%
- By 2040
- 895,696 · +8.8%
- By 2050
- 933,630 · +13.4%
- By 2075
- 1,028,262 · +24.9%
- By 2100
- 1,072,675 · +30.3%
Race, ethnicity, and origin ACS 2023
- Neighborhood character
- Predominantly Black (90%)
- Race & ethnicity
- Black 90% White 5% Two or more races 4% Hispanic / Latino 1%
- Common ancestry
- Italian 1%
- Foreign-born
- 1% · Canada
- Languages at home
- 98% English-only · Spanish 1%
Political lean MEDSL · Jefferson
- 2024 margin
- D (+16.6) · D 57.4% · R 40.9% · Other 1.7%
- 2008→2024 swing
- +4.5pp toward D · 2008: 12.0pp · 2024: 16.6pp
- All cycles
- 2024: D+16.6 2020: D+20.1 2016: D+13.3 2012: D+11.1 2008: D+12.0
Not yet ingested
- Civics
- —
Market trends
- HPI YoY
- ▼ -88.22%
- Current HPI
- 176.337
- Rent YoY
- ▲ 4.87%
- Metro
- Louisville/Jefferson County, KY-IN
- State GDP YoY
- ▲ 1.81%
- F500 in state
- 4
Industry mix (Fortune 500 HQ in KY)
| Industry | F500 HQs | Revenue |
|---|---|---|
| Healthcare | 1 | $118B |
|
||
| Food / Beverage | 1 | $7B |
|
||
Price history
+150.0% since first listed8 events — show timeline
- 2026-05-21 Listed $165,000 Metro Search MLS
- 2026-04-15 Price Changed $174,999 Metro Search MLS
- 2026-02-23 Sold (Public Records) $85,000 Public Records
- 2019-10-21 Sold (Public Records) $66,000 Public Records
- 2019-10-16 Sold (MLS) $66,000 Metro Search MLS
- 2019-09-04 Pending — Metro Search MLS
- 2019-08-25 Price Changed $66,000 Metro Search MLS
- 2019-08-25 Listed $66,000 Metro Search MLS
Property tax history
+7.8%/yrLatest (2025): $906 · -1.9% YoY. Source: county tax records.
Cash-flow waterfall
monthlySold comps — $/sqft
last 12 mo · ≤1 miLoading sold comps…