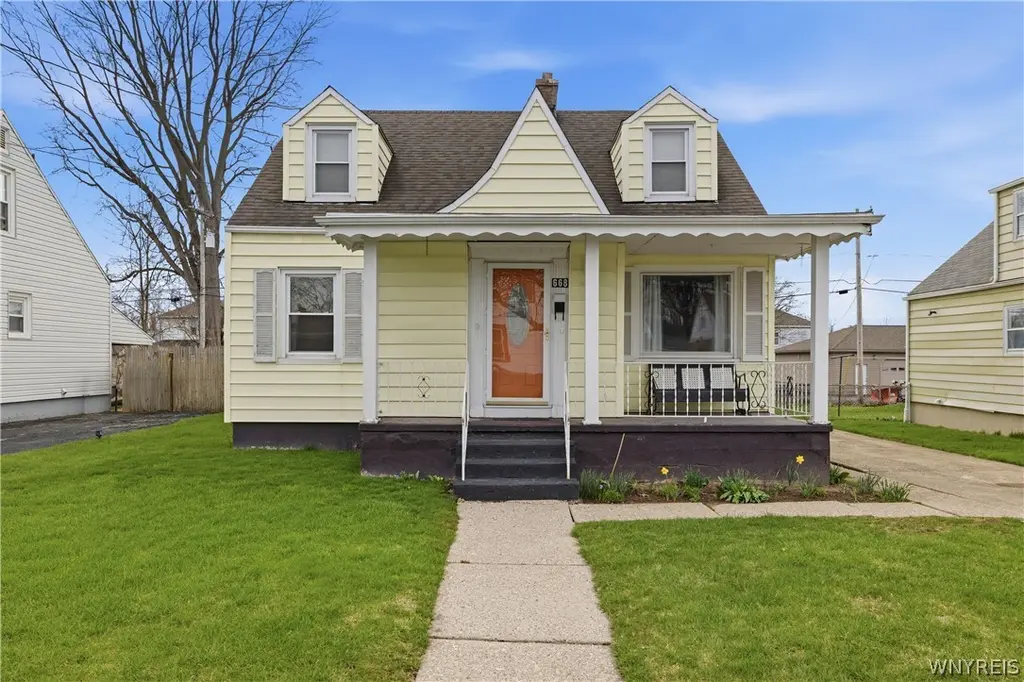
668 77th St · Niagara Falls, NY
Flood risk 1/10 · Minimal
- FEMA flood zone
- X (unshaded)
- Chance of flooding over 30 yrs
- 0.0%
- Est. flood insurance / yr
- $473 – $860
Fire risk 1/10 · Minimal
- Est. fire insurance / yr
- $691 – $1,283
Heat risk 3/10 · Minor
- Hot days now (above 94°F)
- 7 days/yr
- Hot days in 30 yrs
- 14 days/yr
Wind risk 1/10 · Minimal
- Chance of severe wind over 30 yrs
- —
Air-quality risk 3/10 · Minor
- Unhealthy air days now
- 2 days/yr
- Unhealthy air days in 30 yrs
- 3 days/yr
Risk factors via First Street. Map © Google.
Why this score? — see what drove the C+ grade
The composite is a weighted blend of 9 inputs, each scored 0–100. Each bar is that input's sub-score; the figure is the points it added to the 100-point composite (weight × sub-score).
- Cash flow +22.6/30.0
- ARV discount +14.8/15.0
- DSCR +7.2/10.0
- 1% rule +6.7/10.0
- Livability +3.0/5.0
- Rent growth +2.5/5.0
- Schools +2.5/10.0
- Condition / age +2.5/5.0
- Appreciation +0.0/10.0
$159,900
🖨 Deal sheet 📄 Offer letter ✓ Due diligence
Listing remarks
This well maintained Lasalle are home has been recently painted, some newer windows floors along with kitchen and bathroom updates. 4th bedroom is currently being used as a dining room. It wouldn't take much to return it to a bedroom. 1.5 bathrooms. Spacious, fully fenced backyard. Offers are due Tuesday, 4/21/26 at 6pm.
Key facts
- Kitchen updates
- Bathroom updates
- 5,664 sq ft lot
Tags
Neighborhood map
What this means for you Summary
Snapshot
- This is a 4-bed/1.0-bath single-family listed at $160k.
Deal economics
- At list price, monthly cash flow is $271 ($3k/yr) — positive.
- The deal already cash-flows at list — no discount required.
- Meets the 1% rule at list price ($2k rent vs $160k).
Location & tenants
- Location reads 60/100 on livability (#956 in NY) — a middle-class / working-renter tenant base. Strengths: cost of living A+, housing A+; Watch: schools F, crime F, amenities F.
- Niagara Falls City School District (urban): math 26% / reading 34% proficiency, ranked #578 of 590 in NY (top 98%) — families likely to look elsewhere, expect single-tenant / working-renter base with shorter leases; 66% free/reduced lunch — lower-income household profile, screen leases tightly.
- Market conditions: 142 active listings in the ZIP; 1 comparable units currently listed for rent nearby; 167 units permitted in Niagara County in 2024 (0 in 5+ unit buildings).
- This rent runs 34% of the median local income ($67k/yr) — at the standard rent-burdened threshold; future hikes will face affordability resistance.
Forward outlook
- Local home prices are declining (-3.0%/yr); year-one equity from $1k of loan paydown is wiped out by about $5k of value loss. Plan a longer hold.
- Niagara County population projected at -19% by 2050 — secular population decline; favor cash flow + early exit over multi-decade hold.
Negotiation context
- Only 7 days on market — expect competitive offers; lowballing is unlikely to land.
Risks & watch-outs
- Watch-outs: built in 1950 — expect roof / HVAC / electrical / plumbing capex.
Questions for the listing agent
- Built in 1950 — when were the roof, HVAC, electrical panel, plumbing, and water heater last replaced?
- Is there a deadline driving the sale (1031 exchange, divorce, estate, relocation)? That informs how much negotiation room exists.
- Schools are F-rated, which usually means shorter tenancies and higher turnover. Who's the typical renter profile here, and what's been the actual vacancy rate?
- Crime grade is F in this area — have there been break-ins, vandalism, or insurance claims at this property in the last 3 years? What carrier currently insures it and at what premium?
- What's the average days-on-market for RENTAL listings here right now (not sales)? A rising rental-DOM trend means longer vacancies and softer asking-rent achievability than the comps imply.
- What's the recent tenant-quality profile in this submarket — average credit score on applications, eviction rate, late-payment / NSF rate, and stable-employment percentage? A property-management company in the area should have these aggregated.
- How much new for-sale + rental construction is in the pipeline within 1–3 miles? Heavy new supply typically softens prices + rents 12–24 months out; constrained supply supports both.
Investment metrics
- 1% rule
- 1.17% ✓
- Cap rate
- 8.33%
- Cash-on-cash
- 7.26%
- DSCR
- 1.32
- GRM
- 7.1
CMA / ARV
- ARV (on-the-fly)
- $190,944
- Comps found
- 12
Show comp detail 12 sales within ~0.75 mi
| Address | Dist | Beds/Ba | Sqft | Sold | Price | $/sf | Match |
|---|---|---|---|---|---|---|---|
| 550 78th St | 0.22mi | 4/1.0 | 1,200 (-2%) | 1mo | $175,000 | $146 | 85 |
| 502 81st St | 0.38mi | 3/1.0 (-1) | 1,194 (-2%) | 1mo | $185,000 | $155 | 73 |
| 618 82nd St | 0.31mi | 4/1.0 | 1,152 (-6%) | 6mo | $180,000 | $156 | 71 |
| 555 77th St | 0.20mi | 3/1.0 (-1) | 1,312 (+7%) | 4mo | $49,000 | $37 | 70 |
| 445 71st St | 0.50mi | 3/1.0 (-1) | 1,232 (+1%) | 4mo | $177,000 | $144 | 68 |
| 503 77th St | 0.30mi | 3/2.0 (-1) | 1,296 (+6%) | 0mo | $230,000 | $177 | 67 |
| 615 69th St | 0.46mi | 3/1.5 (-1) | 1,134 (-7%) | 2mo | $260,000 | $229 | 58 |
| 8235 Laughlin Dr | 0.42mi | 3/1.0 (-1) | 1,115 (-9%) | 4mo | $160,000 | $143 | 57 |
| 6428 John Ave | 0.66mi | 3/1.5 (-1) | 1,170 (-4%) | 0mo | $215,000 | $184 | 54 |
| 432 74th St | 0.43mi | 3/1.0 (-1) | 1,092 (-11%) | 6mo | $182,500 | $167 | 52 |
| 411 81st St | 0.55mi | 3/1.5 (-1) | 1,344 (+10%) | 1mo | $170,000 | $126 | 50 |
| 8113 Frontier Ave | 0.60mi | 3/1.0 (-1) | 1,050 (-14%) | 6mo | $180,200 | $172 | 39 |
Match score weights: distance 35% · size 25% · config 20% · recency 20%. Top-matched comps best support the ARV.
Projected returns pro-forma
-3.0% appreciation · 3.0% rent growth · sell at horizon
- IRR
- -5.1%
- Equity multiple
- 0.81×
- Total profit
- $-8,568
- Equity at exit
- $23,842
- IRR
- 4.6%
- Equity multiple
- 1.34×
- Total profit
- $15,120
- Equity at exit
- $13,825
Cash invested: $44,772 (down + closing). Projections, not guarantees.
Landlord ↔ Tenant lean methodology
- Overall (STATE)
- 15 Strongly Tenant-Friendly
- State New York
- 15 Strongly Tenant-Friendly · D+10
- County
- — inherits STATE
- City
- — inherits STATE
ZIP-level market 14304
- Active inventory
- 142
- Price-to-rent
- 7.1×
Monthly cashflow live
- Estimated rent
- $1,869 medium interval (Pro) →
- Mortgage (P&I)
- −$839
- Tax from tax record
- −$301 /mo · $3,607/yr
- Insurance
- −$67
- HOA
- −$0
- Vacancy / Maint / Mgmt
- −$393
- Net cashflow
- $271
Break-even live
UW: 25.0% down · 7.5% · 30yr · 1.5% tax · 5.0% vac · 8.0% maint · 8.0% mgmt
Financing live
Cash to close
- Down payment
- $39,975
- Closing costs
- $4,797
- Reserves months
- —
- Total cash needed
- —
Loan-product check · same deal, 3 products live
Conventional
25% down · 7.5% · 30yr
- Down + closing
- —
- Monthly P&I
- —
- Monthly cashflow
- —
- DSCR
- —
- Eligible?
- —
Personal DTI + credit; lowest rate.
DSCR
20% down · 8.5% · 30yr
- Down + closing
- —
- Monthly P&I
- —
- Monthly cashflow
- —
- DSCR
- —
- Eligible?
- —
No personal income docs; deal must DSCR.
Hard money
10% down · 12.0% · 12mo
- Down + closing
- —
- Monthly P&I
- —
- Monthly cashflow
- —
- DSCR
- —
- Eligible?
- —
Short-term bridge; refi at stabilization.
Rent comps 1 comps
| Address | Beds | Baths | Sqft | Rent | $/sqft | DOM | Units | Dist |
|---|---|---|---|---|---|---|---|---|
| 8520 Munson Ave Niagara Falls, NY | 3.0 | 1.0 | 1216 | $2,200 | $1.81 | 16d | 1 | 0.66mi |
Listing history 2 events
-
2026-04-23status Pending
-
2026-04-16$159,900 Active
ⓘ Source: listings_history table (triggers on properties + properties_extension) + one-shot
backfill from property_details.listing_events for pre-trigger history.
Tax reassessment forecast NY · Partial reset (capped growth)
- Current annual tax
- $3,607 · $301/mo
- Projected year-2 tax
- $3,607 · $301/mo
- Expected delta
- $0/yr ($0/mo · 0.0%)
ⓘ Screening estimate from a state-policy table — verify with the county assessor before closing.
Climate risk First Street
- Flood 1/10 Low FEMA zone X (unshaded) · 0% chance over 30 yrs
- Wildfire 1/10 Low
- Heat 3/10 Moderate 7 d/yr ≥94°F today · 14 d/yr by 30 yrs out
- Wind 1/10 Low
- Air quality 3/10 Moderate 2 unhealthy d/yr today · 3 by 30 yrs out
Nearby sold comps map
Loading sold comps map…
Walkable amenities ~0.75 mi
Loading nearby amenities…
Taxation est. · year 1
- Rental income
- $22,430
- − Mortgage interest
- −$8,957
- − Property taxes
- −$3,607
- − Insurance
- −$800
- − Repairs & maintenance
- −$1,794
- − Management
- −$1,794
- − Depreciation
- −$4,652
- Taxable income
- $826
- Est. tax owed @ 24.0%
- −$198
- After-tax cash flow
- $3,052/yr
For passive investors: Depreciation is non-cash, so a rental often shows a tax loss while cash-flowing — sheltering income. Rental losses are passive: they offset passive income freely, and up to $25,000/yr can offset ordinary (W-2) income if you actively participate and your MAGI is under $100k (phasing out to $0 by $150k); unused losses carry forward. On sale, claimed depreciation is recaptured at up to 25%, and gains may owe capital-gains tax (a 1031 exchange can defer both). Figures are a year-1 estimate at your 24.0% rate — not tax advice; consult a CPA.
Schools (NCES district)
- District
- Niagara Falls City School District
- NCES district ID
- 3620820
- Math proficiency
- 26% ▼ -10.00%
- Reading proficiency
- 34% ▲ 3.00%
- Median HH income
- $32,488
- Composite
- 24.5/100
- National rank
- #7655
- State rank
- #578 of 590 in NY
Livability — Niagara Falls
- Score
- 60/100
- State rank
- #956
- US rank
- #18749
Category grades
Schools grade is shown separately in the Schools card above.
Census & demographics
- Census place
- Niagara Falls, NY
- County
- Niagara County · 157,377 people
- City population
- 62,983
- Metro
- Buffalo-Cheektowaga, NY
- Population (ZIP)
- 29,208
- Household income
- $66,660
- Rent vs Own
- Severe rent burden
- 698.0
Population outlook (Niagara County) Hauer SSP2
- Today (2025)
- 204,149 people
- By 2030
- 197,900 · -3.1%
- By 2040
- 182,239 · -10.7%
- By 2050
- 165,198 · -19.1%
- By 2075
- 129,416 · -36.6%
- By 2100
- 96,222 · -52.9%
Race, ethnicity, and origin ACS 2023
- Neighborhood character
- Predominantly White (85%)
- Race & ethnicity
- White 85% Two or more races 6% Hispanic / Latino 4% Black 3% Asian 2%
- Common ancestry
- Romanian 10% Lithuanian 3% Slovak 2%
- Foreign-born
- 3% · Canada, China, Vietnam
- Languages at home
- 93% English-only · Spanish 3% Other Indo-European 1% Russian/Polish/Slavic 1%
Political lean MEDSL · Niagara
- 2024 margin
- R (+14.9) · D 42.5% · R 57.5%
- 2008→2024 swing
- -15.9pp toward R · 2008: 1.0pp · 2024: -14.9pp
- All cycles
- 2024: R+14.9 2020: R+9.7 2016: R+19.0 2012: D+0.6 2008: D+1.0
Not yet ingested
- Civics
- —
Market trends
- HPI YoY
- ▼ -231.77%
- Current HPI
- 280.3295
- Rent YoY
- —
- Metro
- Buffalo-Cheektowaga, NY
- State GDP YoY
- ▲ 2.60%
- F500 in state
- 92
Industry mix (Fortune 500 HQ in NY)
| Industry | F500 HQs | Revenue |
|---|---|---|
| Financial Services | 10 | $950B |
|
||
| Consumer Goods | 9 | $162B |
|
||
| Insurance | 4 | $225B |
|
||
| Telecommunications | 2 | $144B |
|
||
| Pharmaceuticals | 2 | $112B |
|
||
| Media / Entertainment | 2 | $69B |
|
||
Price history
2 events — show timeline
- 2026-04-23 Pending — WNYREIS
- 2026-04-16 Listed $159,900 WNYREIS
Property tax history
+9.6%/yrLatest (2025): $3,607 · +27.0% YoY. Source: county tax records.
Cash-flow waterfall
monthlySold comps — $/sqft
last 12 mo · ≤1 miLoading sold comps…