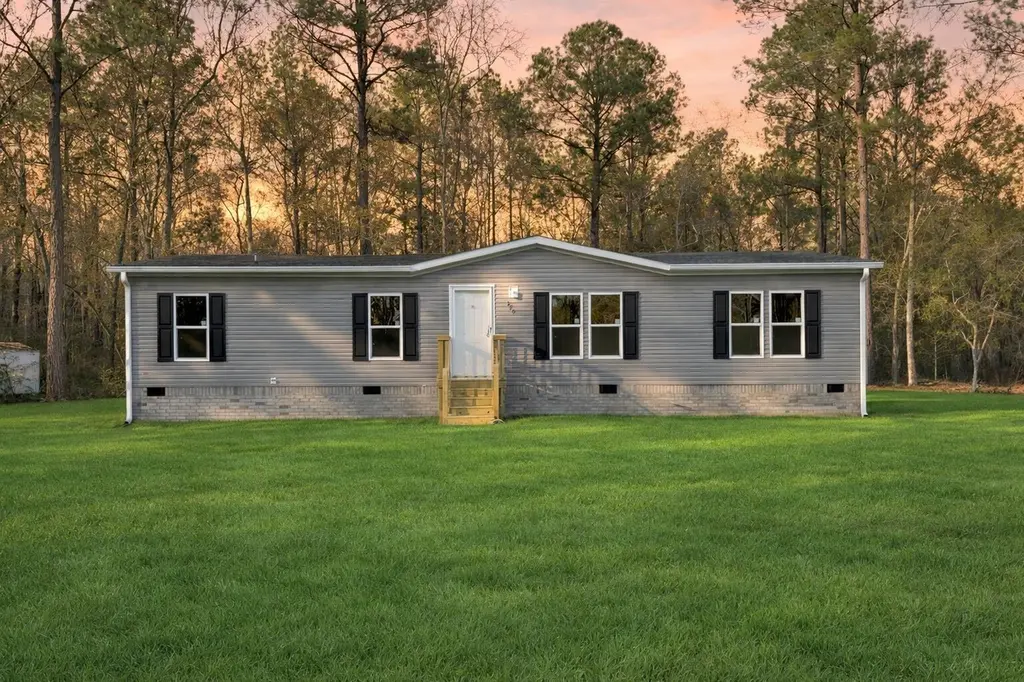
270 Saturn Ln · Walterboro, SC
Flood risk 1/10 · Minimal
- FEMA flood zone
- X (unshaded)
- Chance of flooding over 30 yrs
- 0.0%
- Est. flood insurance / yr
- $507 – $1,088
Fire risk 6/10 · Moderate
- Est. fire insurance / yr
- $783 – $1,453
Heat risk 8/10 · Major
- Hot days now (above 108°F)
- 7 days/yr
- Hot days in 30 yrs
- 17 days/yr
Wind risk 8/10 · Major
- Chance of severe wind over 30 yrs
- 80.0%
Air-quality risk 3/10 · Minor
- Unhealthy air days now
- 3 days/yr
- Unhealthy air days in 30 yrs
- 3 days/yr
Risk factors via First Street. Map © Google.
Why this score? — see what drove the C grade
The composite is a weighted blend of 9 inputs, each scored 0–100. Each bar is that input's sub-score; the figure is the points it added to the 100-point composite (weight × sub-score).
- Cash flow +24.3/30.0
- DSCR +7.8/10.0
- ARV discount +7.5/15.0
- 1% rule +6.3/10.0
- Condition / age +4.0/5.0
- Livability +2.9/5.0
- Rent growth +2.5/5.0
- Schools +1.7/10.0
- Appreciation +0.0/10.0
$229,999
🖨 Deal sheet 📄 Offer letter ✓ Due diligence
Listing remarks
Seller will contribute to closing costs! 1 ACRE!! Welcome to 270 Saturn Lane -- brand-new country living just minutes from town in Walterboro. Situated on a full 1-acre lot with no HOA, this new home offers the perfect blend of space, privacy, and convenience. Inside, you'll find 4 spacious bedrooms and 2 full baths, designed with an open, functional layout ideal for everyday living or hosting family and friends. Everything is brand new, giving you peace of mind and a fresh start from day one. Comes with a 1 year manufacturer's warranty, as well! Enjoy wide-open space and freedom with no HOA restrictions. Enjoy the tranquility of country living without sacrificing proximity to town, shoppin
Key facts
- Country living
- Full lot
- 1 acre
Tags
Property features AI
Exterior
- Parking: Off-street parking
- Utilities: Septic tank
- Home design: Manufactured/mobile home; One story; New construction; Fee simple ownership
- Construction: Asphalt roof; Brick skirting
- Exterior features: Wooded lot; Lot between 0.5 and 2 acres
Interior
- Kitchen: Dishwasher; Electric range; Refrigerator
- Bedrooms: 4 bedrooms; Primary bedroom on lower level with walk-in closet
- Flooring: Luxury vinyl
- Bathrooms: 2 bathrooms
- Heating & cooling: Central heating (electric); Central air conditioning
- Interior features: Garden tub/shower; Kitchen island; Walk-in closet(s); Eat-in kitchen; Pantry; Utility room
- Laundry & utility: Laundry room with washer hookup and electric dryer hookup
Neighborhood map
What this means for you Summary
Snapshot
- This is a 4-bed/2.0-bath manufactured listed at $230k. Condition is rated good.
Deal economics
- At list price, monthly cash flow is $464 ($6k/yr) — positive.
- The deal already cash-flows at list — no discount required.
- Meets the 1% rule at list price ($3k rent vs $230k).
- Recommended offer: $223k (3.0% below list) — sets the bar for market timing.
Location & tenants
- Location reads 57/100 on livability (#269 in SC) — a working-class tenant base; expect higher turnover. Strengths: cost of living A+, health & safety A+, housing A-; Watch: crime F, amenities F, commute F.
- Colleton 01 (rural): math 13% / reading 28% proficiency, ranked #69 of 80 in SC (top 86%) — low school quality limits family demand, transient renter base, plan for 1-2y turnover; 69% free/reduced lunch — lower-income household profile, screen leases tightly.
- Zoned schools: Hendersonville Elementary (math 12% / reading 17%, grade F, #553 of 597 statewide, top 95%, 342 students, 100% FRL); Colleton County Middle (math 8% / reading 18%, grade F, #210 of 229 statewide, top 93%, 1,121 students, 100% FRL); Colleton County High (math 28% / reading 80%, grade C-, #137 of 196 statewide, top 70%, 1,497 students, 100% FRL) — zoned schools average 100% FRL vs 69% district-wide (31 pts higher); higher-poverty schools than district average — tighter screening recommended.
- Market conditions: 222 active listings in the ZIP; 50 units permitted in Colleton County in 2024 (0 in 5+ unit buildings).
Forward outlook
- Local home prices are declining (-3.0%/yr); year-one equity from $2k of loan paydown is wiped out by about $7k of value loss. Plan a longer hold.
- Colleton County population projected at -28% by 2050 — secular population decline; favor cash flow + early exit over multi-decade hold.
Negotiation context
- It's been on market 44 days — a 3% lower offer ($223k) is reasonable based on typical stale-listing flexibility.
- 2 sale attempts with the ask held roughly flat each time — persistent listings suggest the price (not the market) is what's stuck; bring a comps-based counter.
Risks & watch-outs
- Climate carrying-cost: severe wind risk, 80% chance of damaging wind over 30y; major wildfire risk; extreme-heat days projected 7→17/yr by 2055 (HVAC capex compounding) — expect insurance premiums to compound above CPI over the hold.
Questions for the listing agent
- It's been on market 44 days. Have you received any prior offers? Is the seller open to a 3% concession, seller financing, or rate buy-down credit?
- Is there a deadline driving the sale (1031 exchange, divorce, estate, relocation)? That informs how much negotiation room exists.
- Schools are F-rated, which usually means shorter tenancies and higher turnover. Who's the typical renter profile here, and what's been the actual vacancy rate?
- Crime grade is F in this area — have there been break-ins, vandalism, or insurance claims at this property in the last 3 years? What carrier currently insures it and at what premium?
- What's the average days-on-market for RENTAL listings here right now (not sales)? A rising rental-DOM trend means longer vacancies and softer asking-rent achievability than the comps imply.
- What's the recent tenant-quality profile in this submarket — average credit score on applications, eviction rate, late-payment / NSF rate, and stable-employment percentage? A property-management company in the area should have these aggregated.
- How much new for-sale + rental construction is in the pipeline within 1–3 miles? Heavy new supply typically softens prices + rents 12–24 months out; constrained supply supports both.
Investment metrics
- 1% rule
- 1.13% ✓
- Cap rate
- 8.71%
- Cash-on-cash
- 8.65%
- DSCR
- 1.38
- GRM
- 7.4
CMA / ARV
No comps found within radius.
Projected returns pro-forma
-3.0% appreciation · 3.0% rent growth · sell at horizon
- IRR
- -3.2%
- Equity multiple
- 0.88×
- Total profit
- $-7,679
- Equity at exit
- $34,294
- IRR
- 6.5%
- Equity multiple
- 1.49×
- Total profit
- $31,525
- Equity at exit
- $19,886
Cash invested: $64,400 (down + closing). Projections, not guarantees.
Landlord ↔ Tenant lean methodology
- Overall (STATE)
- 90 Strongly Landlord-Friendly
- State South Carolina
- 90 Strongly Landlord-Friendly · R+6
- County
- — inherits STATE
- City
- — inherits STATE
ZIP-level market 29488
- Home prices YoY
- -33.6%
- Active inventory
- 222
- Price-to-rent
- 7.4×
Monthly cashflow live
- Estimated rent
- $2,599 medium interval (Pro) →
- Mortgage (P&I)
- −$1,206
- Tax est. 1.5%
- −$287 /mo · $3,450/yr
- Insurance
- −$96
- HOA
- −$0
- Vacancy / Maint / Mgmt
- −$546
- Net cashflow
- $464
Break-even live
UW: 25.0% down · 7.5% · 30yr · 1.5% tax · 5.0% vac · 8.0% maint · 8.0% mgmt
Financing live
Cash to close
- Down payment
- $57,500
- Closing costs
- $6,900
- Reserves months
- —
- Total cash needed
- —
Loan-product check · same deal, 3 products live
Conventional
25% down · 7.5% · 30yr
- Down + closing
- —
- Monthly P&I
- —
- Monthly cashflow
- —
- DSCR
- —
- Eligible?
- —
Personal DTI + credit; lowest rate.
DSCR
20% down · 8.5% · 30yr
- Down + closing
- —
- Monthly P&I
- —
- Monthly cashflow
- —
- DSCR
- —
- Eligible?
- —
No personal income docs; deal must DSCR.
Hard money
10% down · 12.0% · 12mo
- Down + closing
- —
- Monthly P&I
- —
- Monthly cashflow
- —
- DSCR
- —
- Eligible?
- —
Short-term bridge; refi at stabilization.
Listing history 24 events
-
2026-06-18days on market $229,999 Active 44 DOM
-
2026-06-17days on market $229,999 Active 43 DOM
-
2026-06-16days on market $229,999 Active 42 DOM
-
2026-06-15days on market $229,999 Active 41 DOM
-
2026-06-13days on market $229,999 Active 39 DOM
-
2026-06-12days on market $229,999 Active 38 DOM
-
2026-06-09days on market $229,999 Active 35 DOM
-
2026-06-08days on market $229,999 Active 34 DOM
-
2026-06-08days on market $229,999 Active 33 DOM
-
2026-06-04days on market $229,999 Active 29 DOM
-
2026-06-02days on market $229,999 Active 28 DOM
-
2026-06-01days on market $229,999 Active 27 DOM
-
2026-05-31days on market $229,999 Active 26 DOM
-
2026-05-05$236,900 Active
-
2026-03-23price $236,900
-
2026-03-21price $237,900
-
2026-03-19price $238,900
-
2026-02-16price $239,900
-
2026-02-15price $241,900
-
2026-02-13price $243,900
-
2026-02-12price $245,900
-
2026-02-11price $247,900
-
2026-01-15price $249,900
-
2025-12-22$250,000 Active
ⓘ Source: listings_history table (triggers on properties + properties_extension) + one-shot
backfill from property_details.listing_events for pre-trigger history.
Climate risk First Street
- Flood 1/10 Low FEMA zone X (unshaded) · 0% chance over 30 yrs
- Wildfire 6/10 Major
- Heat 8/10 Severe 7 d/yr ≥108°F today · 17 d/yr by 30 yrs out
- Wind 8/10 Severe 80% chance of damaging wind over 30 yrs
- Air quality 3/10 Moderate 3 unhealthy d/yr today · 3 by 30 yrs out
Nearby sold comps map
Loading sold comps map…
Walkable amenities ~0.75 mi
Loading nearby amenities…
Taxation est. · year 1
- Rental income
- $31,192
- − Mortgage interest
- −$12,884
- − Property taxes
- −$3,450
- − Insurance
- −$1,150
- − Repairs & maintenance
- −$2,495
- − Management
- −$2,495
- − Depreciation
- −$6,691
- Taxable income
- $2,027
- Est. tax owed @ 24.0%
- −$486
- After-tax cash flow
- $5,081/yr
For passive investors: Depreciation is non-cash, so a rental often shows a tax loss while cash-flowing — sheltering income. Rental losses are passive: they offset passive income freely, and up to $25,000/yr can offset ordinary (W-2) income if you actively participate and your MAGI is under $100k (phasing out to $0 by $150k); unused losses carry forward. On sale, claimed depreciation is recaptured at up to 25%, and gains may owe capital-gains tax (a 1031 exchange can defer both). Figures are a year-1 estimate at your 24.0% rate — not tax advice; consult a CPA.
Condition & rehab AI · 12 photos
This home is in excellent condition with a good condition score of 80. It is move-in ready and offers a great blend of space, privacy, and convenience.
Value-add opportunities
- Both Landscaping and curb appeal improvements — Enhances the home's curb appeal and could attract more buyers
- Both Painting exterior and interior walls — Fresh paint can make the home look more inviting and maintain its value
- Both Landscaping and adding outdoor furniture — Improves the outdoor living space and can increase the home's rental value
Renovation cost estimate screening
Value-add ROI direction
- Both Landscaping and curb appeal improvements — Enhances the home's curb appeal and could attract more buyers ↑
- Both Painting exterior and interior walls — Fresh paint can make the home look more inviting and maintain its value ↑
- Both Landscaping and adding outdoor furniture — Improves the outdoor living space and can increase the home's rental value ↑
ⓘ Cost ranges are severity-bucket heuristics (US national rule-of-thumb). Get contractor quotes + a written scope before underwriting a rehab budget.
Schools (NCES district)
- District
- Colleton 01
- NCES district ID
- 4501830
- Math proficiency
- 13% ▼ -10.00%
- Reading proficiency
- 28% ▬ 0.00%
- Median HH income
- $33,128
- Composite
- 16.66/100
- National rank
- #9171
- State rank
- #69 of 80 in SC
Livability — Walterboro
- Score
- 57/100
- State rank
- #269
- US rank
- #21618
Category grades
Schools grade is shown separately in the Schools card above.
Census & demographics
- City population
- 22,367
- Population (ZIP)
- 22,367
Population outlook (Colleton County) Hauer SSP2
- Today (2025)
- 34,932 people
- By 2030
- 33,078 · -5.3%
- By 2040
- 29,017 · -16.9%
- By 2050
- 25,029 · -28.3%
- By 2075
- 16,894 · -51.6%
- By 2100
- 10,518 · -69.9%
Race, ethnicity, and origin ACS 2023
- Neighborhood character
- Diverse neighborhood (Simpson 0.56)
- Race & ethnicity
- White 54% Black 38% Hispanic / Latino 4% Two or more races 4%
- Common ancestry
- Italian 2% Lithuanian 1% Slovak 1%
- Foreign-born
- 2% · Canada
- Languages at home
- 97% English-only · Spanish 2%
Political lean MEDSL · Colleton
- 2024 margin
- R (+18.2) · D 40.4% · R 58.5% · Other 1.1%
- 2008→2024 swing
- -18.7pp toward R · 2008: 0.5pp · 2024: -18.2pp
- All cycles
- 2024: R+18.2 2020: R+9.5 2016: R+8.5 2012: D+0.2 2008: D+0.5
Not yet ingested
- Civics
- —
Market trends
- HPI YoY
- ▼ -119.20%
- Current HPI
- 235.1237
- Rent YoY
- —
- Metro
- —
- State GDP YoY
- ▲ 4.51%
- F500 in state
- 2
Industry mix (Fortune 500 HQ in SC)
| Industry | F500 HQs | Revenue |
|---|---|---|
| Packaging | 1 | $7B |
|
||
Price history
-5.2% since first listed11 events — show timeline
- 2026-05-05 Listed $236,900 Charleston Trident MLS
- 2026-03-23 Price Changed $236,900 Charleston Trident MLS
- 2026-03-21 Price Changed $237,900 Charleston Trident MLS
- 2026-03-19 Price Changed $238,900 Charleston Trident MLS
- 2026-02-16 Price Changed $239,900 Charleston Trident MLS
- 2026-02-15 Price Changed $241,900 Charleston Trident MLS
- 2026-02-13 Price Changed $243,900 Charleston Trident MLS
- 2026-02-12 Price Changed $245,900 Charleston Trident MLS
- 2026-02-11 Price Changed $247,900 Charleston Trident MLS
- 2026-01-15 Price Changed $249,900 Charleston Trident MLS
- 2025-12-22 Listed $250,000 Charleston Trident MLS
Cash-flow waterfall
monthlySold comps — $/sqft
last 12 mo · ≤1 miLoading sold comps…