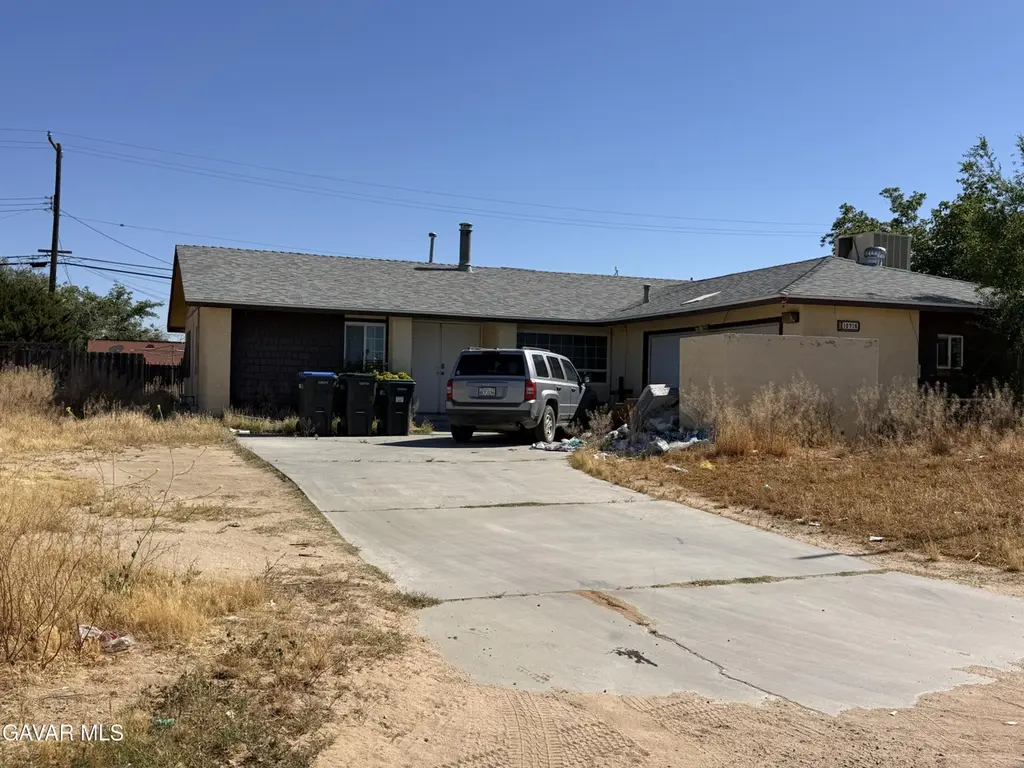
10716 Proctor Blvd · California City, CA
Flood risk 1/10 · Minimal
- FEMA flood zone
- X (unshaded)
- Chance of flooding over 30 yrs
- 0.0%
- Est. flood insurance / yr
- $507 – $1,088
Fire risk 1/10 · Minimal
- Est. fire insurance / yr
- $659 – $1,223
Heat risk 8/10 · Major
- Hot days now (above 101°F)
- 5 days/yr
- Hot days in 30 yrs
- 14 days/yr
Wind risk 1/10 · Minimal
- Chance of severe wind over 30 yrs
- —
Air-quality risk 7/10 · Major
- Unhealthy air days now
- 13 days/yr
- Unhealthy air days in 30 yrs
- 15 days/yr
Risk factors via First Street. Map © Google.
Why this score? — see what drove the C- grade
The composite is a weighted blend of 9 inputs, each scored 0–100. Each bar is that input's sub-score; the figure is the points it added to the 100-point composite (weight × sub-score).
- ARV discount +12.2/15.0
- Cash flow +11.5/30.0
- Appreciation +10.0/10.0
- Rent growth +3.9/5.0
- DSCR +3.4/10.0
- Condition / age +2.5/5.0
- 1% rule +2.4/10.0
- Livability +2.2/5.0
- Schools +2.1/10.0
$249,900
🖨 Deal sheet (PDF) 📄 Offer letter ✓ Due diligence
Listing remarks
CALLING ALL INVESTORS. Your opportunity to own your pool home and rebuild to your liking is here. This home is also in foreclosure needing an offer asap.
Key facts
- Pool home
- 0.23 acre lot
- 2 garage spots
Tags
Property features AI
Exterior
- Parking: Attached 2-car garage
- Security: Security system
- Utilities: Public water; Septic sewer; Natural gas
- Home design: Single-story tract home; Faces unknown
- Construction: Stucco exterior; Shingle roof; Concrete slab foundation; Solar energy generation
- Exterior features: Back and wood fencing; Covered patio; RV access; In-ground pool; Solar panels (owned/paid); Paved streets
Interior
- Flooring: Carpet; Laminate
- Bathrooms: Two full bathrooms; One 3/4 bathroom
- Heating & cooling: Central air
- Interior features: Family room; Pets allowed; Accessory buildings
- Laundry & utility: Laundry area in unit
Neighborhood map
What this means for you Summary
Snapshot
- This is a 3-bed/2.0-bath single-family listed at $250k.
Deal economics
- At list price, monthly cash flow is $-82 ($-985/yr) — negative.
- To cash-flow at today's rent, offer at most $235k (5.8% below list).
- To meet the 1% rule (rent ≥ 1% of price), the offer needs to be $186k (25.5% below list).
- Recommended offer: $186k (25.5% below list) — sets the bar for 1% rule.
Location & tenants
- Location reads 44/100 on livability (#1,329 in CA) — a working-class tenant base; expect higher turnover. Strengths: housing A+; Watch: schools F, crime F, amenities F.
- Mojave Unified (town): math 25% / reading 25% proficiency, ranked #411 of 517 in CA (top 80%) — low school quality limits family demand, transient renter base, plan for 1-2y turnover; 76% free/reduced lunch — lower-income household profile, screen leases tightly.
- Market conditions: Rents rising fast (+5.5%/yr); 703 active listings in the ZIP; 17 comparable units currently listed for rent nearby; rentals at typical pace (median 20d on market — plan ~3-4 weeks tenant-placement turnaround); 3,244 units permitted in Kern County in 2024 (73 in 5+ unit buildings).
- This rent runs 37% of the median local income ($60k/yr) — at the standard rent-burdened threshold; future hikes will face affordability resistance.
Forward outlook
- In year one you build about $27k of equity ($2k loan paydown + $25k appreciation (10.0% local appreciation)).
- Kern County population projected at +17% by 2050 — long-run rental-demand tailwind backs the buy-and-hold thesis.
- At projected returns (10.0% appreciation + 5.5% rent growth), your $70k cash investment doubles in ~3 years — after that, you're playing with house money.
- By year 2, paydown + projected appreciation supports a ~$43k cash-out refi (75% LTV) — recoverable capital for the next deal without selling this one.
Negotiation context
- It's been on market 40 days — a 3% lower offer ($242k) is reasonable based on typical stale-listing flexibility.
- 2 sale attempts since 25y ago with the ask held roughly flat each time — persistent listings suggest the price (not the market) is what's stuck; bring a comps-based counter.
- Current owner paid $87k; list at $250k implies a 187% gain — meaningful room to come down on a strong offer.
Risks & watch-outs
- Climate carrying-cost: extreme-heat days projected 5→14/yr by 2055 (HVAC capex compounding) — expect insurance premiums to compound above CPI over the hold.
Questions for the listing agent
- What do current leases actually rent for vs. the listed asking? Can we see a recent rent roll and the last 12 months of T-12 income?
- It's been on market 40 days. Have you received any prior offers? Is the seller open to a 26% concession, seller financing, or rate buy-down credit?
- Built in 1969 — when were the roof, HVAC, electrical panel, plumbing, and water heater last replaced?
- Is there a deadline driving the sale (1031 exchange, divorce, estate, relocation)? That informs how much negotiation room exists.
- Schools are F-rated, which usually means shorter tenancies and higher turnover. Who's the typical renter profile here, and what's been the actual vacancy rate?
- Crime grade is F in this area — have there been break-ins, vandalism, or insurance claims at this property in the last 3 years? What carrier currently insures it and at what premium?
- What's the average days-on-market for RENTAL listings here right now (not sales)? A rising rental-DOM trend means longer vacancies and softer asking-rent achievability than the comps imply.
- What's the recent tenant-quality profile in this submarket — average credit score on applications, eviction rate, late-payment / NSF rate, and stable-employment percentage? A property-management company in the area should have these aggregated.
- How much new for-sale + rental construction is in the pipeline within 1–3 miles? Heavy new supply typically softens prices + rents 12–24 months out; constrained supply supports both.
Investment metrics
- 1% rule
- 0.74% ✗
- Cap rate
- 5.90%
- Cash-on-cash
- -1.41%
- DSCR
- 0.94
- GRM
- 11.2
CMA / ARV
- ARV (median comp)
- $278,846
- List price
- $249,900
- Delta
- -10.38%
- Verdict
- UNDERPRICED
- Comps
- 20 within 1.0 mi
Show comp detail 12 sales within ~0.75 mi
| Address | Dist | Beds/Ba | Sqft | Sold | Price | $/sf | Match |
|---|---|---|---|---|---|---|---|
| 10624 Aspen Ave | 0.11mi | 4/2.0 (+1) | 1,376 (-2%) | 13mo | $275,000 | $200 | 76 |
| 11043 Rome Beauty Dr | 0.37mi | 3/2.0 | 1,505 (+8%) | 3mo | $270,000 | $179 | 68 |
| 21400 Jupiter Pl Unit 1054-A | 0.42mi | 3/2.0 | 1,276 (-9%) | 1mo | $155,000 | $121 | 65 |
| 21400 Jupiter Pl | 0.42mi | 3/2.0 | 1,276 (-9%) | 1mo | $155,000 | $121 | 65 |
| 21251 Calhoun Ct | 0.62mi | 3/2.0 | 1,429 (+2%) | 4mo | $330,000 | $231 | 64 |
| 21231 Calhoun Ct | 0.64mi | 3/2.0 | 1,429 (+2%) | 4mo | $331,000 | $232 | 63 |
| 21241 Calhoun Ct | 0.65mi | 4/2.0 (+1) | 1,429 (+2%) | 2mo | $323,000 | $226 | 59 |
| 11125 Rome Beauty Dr | 0.44mi | 3/2.0 | 1,237 (-12%) | 1mo | $225,000 | $182 | 59 |
| 10945 Rome Beauty Dr | 0.27mi | 4/2.0 (+1) | 1,236 (-12%) | 5mo | $210,000 | $170 | 58 |
| 21313 Heather Pl | 0.74mi | 3/2.0 | 1,389 (-1%) | 9mo | $215,000 | $155 | 57 |
| 10549 Camille Ct | 0.70mi | 3/2.0 | 1,508 (+8%) | 1mo | $319,000 | $212 | 54 |
| 10549 Oleander Ave | 0.65mi | 3/2.0 | 1,301 (-7%) | 12mo | $245,000 | $188 | 48 |
Match score weights: distance 35% · size 25% · config 20% · recency 20%. Top-matched comps best support the ARV.
Projected returns pro-forma
10.0% appreciation · 5.45% rent growth · sell at horizon
- IRR
- 24.0%
- Equity multiple
- 2.94×
- Total profit
- $135,496
- Equity at exit
- $225,130
- IRR
- 21.8%
- Equity multiple
- 6.91×
- Total profit
- $413,500
- Equity at exit
- $485,501
Cash invested: $69,972 (down + closing). Projections, not guarantees.
Landlord ↔ Tenant lean methodology
- Overall (STATE)
- 18 Strongly Tenant-Friendly
- State California
- 18 Strongly Tenant-Friendly · D+13
- County
- — inherits STATE
- City
- — inherits STATE
ZIP-level market 93505
- Home prices YoY
- 13.0%
- Rents YoY
- 5.5%
- Active inventory
- 703
- Price-to-rent
- 11.2×
Monthly cashflow live
- Estimated rent
- $1,861 high interval (Pro) →
- Mortgage (P&I)
- −$1,311
- Tax from tax record
- −$138 /mo · $1,654/yr
- Insurance
- −$104
- HOA
- −$0
- Vacancy / Maint / Mgmt
- −$391
- Net cashflow
- $-82
Break-even live
Sensitivity live
| Price | -10% $59 | -5% $-11 | +0% $-82 | +5% $-153 | +10% $-224 |
|---|---|---|---|---|---|
| Rent | -10% $-229 | -5% $-156 | +0% $-82 | +5% $-9 | +10% $65 |
| Rate | -1.0pp $44 | -0.5pp $-19 | base $-82 | +0.5pp $-147 | +1.0pp $-213 |
UW: 25.0% down · 7.5% · 30yr · 1.5% tax · 5.0% vac · 8.0% maint · 8.0% mgmt
Financing live
Cash to close
- Down payment
- $62,475
- Closing costs
- $7,497
- Reserves months
- —
- Total cash needed
- —
Loan-product check · same deal, 3 products live
Conventional
25% down · 7.5% · 30yr
- Down + closing
- —
- Monthly P&I
- —
- Monthly cashflow
- —
- DSCR
- —
- Eligible?
- —
Personal DTI + credit; lowest rate.
DSCR
20% down · 8.5% · 30yr
- Down + closing
- —
- Monthly P&I
- —
- Monthly cashflow
- —
- DSCR
- —
- Eligible?
- —
No personal income docs; deal must DSCR.
Hard money
10% down · 12.0% · 12mo
- Down + closing
- —
- Monthly P&I
- —
- Monthly cashflow
- —
- DSCR
- —
- Eligible?
- —
Short-term bridge; refi at stabilization.
Rent comps 17 comps
| Address | Beds | Baths | Sqft | Rent | $/sqft | DOM | Units | Dist |
|---|---|---|---|---|---|---|---|---|
| 21398 Baldwin Ln California City, CA | 4.0 | 2.0 | 1527 | $2,000 | $1.31 | 3d | 1 | 0.18mi |
| 21601 Randsburg Mojave Rd Unit C California City, CA | 2.0 | 2.0 | 896 | $1,150 | $1.28 | 3d | 1 | 0.63mi |
| 21306 Bancroft Ct California City, CA | 2.0 | 2.0 | 906 | $1,800 | $1.99 | 4d | 1 | 0.74mi |
| 21187 Conklin Blvd California City, CA | 3.0 | 2.0 | 1473 | $1,800 | $1.22 | 15d | 1 | 0.77mi |
| 9931 Putter Ct California City, CA | 3.0 | 2.0 | 1445 | $1,675 | $1.16 | 4d | 1 | 0.79mi |
| 21319 Conklin Ct California City, CA | 2.0 | 2.0 | 1816 | $2,200 | $1.21 | 45d | 1 | 0.83mi |
| 21235 Windsong St California City, CA | 3.0 | 3.0 | 1780 | $2,100 | $1.18 | 24d | 1 | 0.85mi |
| 9933 N Loop Blvd Unit B California City, CA | 2.0 | 2.0 | 895 | $1,875 | $2.09 | 24d | 1 | 0.97mi |
| 10193 Evelyn Ave California City, CA | 3.0 | 2.0 | 1616 | $2,150 | $1.33 | 15d | 1 | 1.02mi |
| 9848 Sally Ave Unit 2 California City, CA | 2.0 | 1.0 | 980 | $1,495 | $1.53 | 24d | 1 | 1.04mi |
| 9825 N Loop Blvd Unit B California City, CA | 2.0 | 1.0 | 883 | $1,350 | $1.53 | 20d | 1 | 1.06mi |
| 9749 N Loop Blvd California City, CA | 2.0 | 1.0 | 900 | $1,350 | $1.50 | 12d | 1 | 1.12mi |
| 9749 N Loop Blvd California City, CA | 2.0 | 1.0 | 900 | $1,350 | $1.50 | 4d | 1 | 1.12mi |
| 9749 N Loop Blvd California City, CA | 2.0 | 1.0 | 900 | $1,350 | $1.50 | 24d | 1 | 1.12mi |
| 9548 Sally Ave Unit B California City, CA | 3.0 | 2.5 | 1200 | $1,695 | $1.41 | 24d | 1 | 1.34mi |
| 9524 Sally Ave Unit C California City, CA | 2.0 | 1.5 | 1140 | $1,300 | $1.14 | 24d | 1 | 1.38mi |
| 9610 Oleander Ave Unit A California City, CA | 2.0 | 1.0 | 1300 | $1,575 | $1.21 | 24d | 1 | 1.49mi |
Listing history 24 events
-
2026-06-18days on market $249,900 Active 40 DOM
-
2026-06-17days on market $249,900 Active 39 DOM
-
2026-06-16days on market $249,900 Active 38 DOM
-
2026-06-15days on market $249,900 Active 37 DOM
-
2026-06-14days on market $249,900 Active 35 DOM
-
2026-06-13days on market $249,900 Active 34 DOM
-
2026-06-10days on market $249,900 Active 32 DOM
-
2026-06-09days on market $249,900 Active 31 DOM
-
2026-06-08days on market $249,900 Active 30 DOM
-
2026-06-07days on market $249,900 Active 29 DOM
-
2026-06-05days on market $249,900 Active 26 DOM
-
2026-06-03days on market $249,900 Active 25 DOM
-
2026-06-03days on market $249,900 Active 24 DOM
-
2026-06-01days on market $249,900 Active 23 DOM
-
2026-05-31days on market $249,900 Active 22 DOM
-
2026-05-09$249,900 Active 153-char remark
-
2022-11-04price $275,000
-
2022-09-16price $265,000
-
2022-09-15price $280,000
-
2022-07-26price $275,000
-
2001-09-13soldstatus $87,000
-
2001-09-13soldstatus $87,000
-
2001-07-10$84,000
-
1990-04-10soldstatus $78,500
ⓘ Source: listings_history table (triggers on properties + properties_extension) + one-shot
backfill from property_details.listing_events for pre-trigger history.
Tax reassessment forecast CA · Resets to sale price
- Current annual tax
- $1,654 · $138/mo
- Projected year-2 tax
- $1,899 · $158/mo
- Expected delta
- +$246/yr (+$20/mo · 14.8%)
ⓘ Screening estimate from a state-policy table — verify with the county assessor before closing.
Climate risk First Street
- Flood 1/10 Low FEMA zone X (unshaded) · 0% chance over 30 yrs
- Wildfire 1/10 Low
- Heat 8/10 Severe 5 d/yr ≥101°F today · 14 d/yr by 30 yrs out
- Wind 1/10 Low
- Air quality 7/10 Severe 13 unhealthy d/yr today · 15 by 30 yrs out
Nearby sold comps map
Loading sold comps map…
Walkable amenities ~0.75 mi
Loading nearby amenities…
Taxation est. · year 1
- Rental income
- $22,335
- − Mortgage interest
- −$13,998
- − Property taxes
- −$1,654
- − Insurance
- −$1,250
- − Repairs & maintenance
- −$1,787
- − Management
- −$1,787
- − Depreciation
- −$7,270
- Taxable loss
- −$5,410
- Est. tax savings @ 24.0%
- +$1,298
- After-tax cash flow
- $314/yr
For passive investors: Depreciation is non-cash, so a rental often shows a tax loss while cash-flowing — sheltering income. Rental losses are passive: they offset passive income freely, and up to $25,000/yr can offset ordinary (W-2) income if you actively participate and your MAGI is under $100k (phasing out to $0 by $150k); unused losses carry forward. On sale, claimed depreciation is recaptured at up to 25%, and gains may owe capital-gains tax (a 1031 exchange can defer both). Figures are a year-1 estimate at your 24.0% rate — not tax advice; consult a CPA.
Schools (NCES district)
- District
- Mojave Unified
- NCES district ID
- 0625230
- Math proficiency
- 25% ▲ 11.00%
- Reading proficiency
- 25% ▼ -1.00%
- Median HH income
- $43,017
- Composite
- 21.4/100
- National rank
- #8350
- State rank
- #411 of 517 in CA
Livability — California City
- Score
- 44/100
- State rank
- #1329
- US rank
- #26753
Category grades
Schools grade is shown separately in the Schools card above.
Census & demographics
- Census place
- California City, CA
- County
- Kern County · 710,371 people
- City population
- 14,353
- Metro
- Bakersfield, CA
- Population (ZIP)
- 14,353
- Household income
- $59,827
- Rent vs Own
- Severe rent burden
- 883.0
Population outlook (Kern County) Hauer SSP2
- Today (2025)
- 947,286 people
- By 2030
- 978,984 · +3.3%
- By 2040
- 1,045,018 · +10.3%
- By 2050
- 1,105,232 · +16.7%
- By 2075
- 1,229,538 · +29.8%
- By 2100
- 1,238,059 · +30.7%
Race, ethnicity, and origin ACS 2023
- Neighborhood character
- Highly diverse neighborhood (Simpson 0.70)
- Race & ethnicity
- Hispanic / Latino 40% White 30% Black 22% Two or more races 16% Native American 3% Asian 1%
- Hispanic origin (detail)
- Mexican 29%
- Common ancestry
- Italian 3% Lithuanian 1% Romanian 1%
- Foreign-born
- 13% · Canada, Dominican Republic
- Languages at home
- 68% English-only · Spanish 29%
Political lean MEDSL · Kern
- 2024 margin
- Strong R (+21.1) · D 38.2% · R 59.3% · Other 2.5%
- 2008→2024 swing
- -3.3pp toward R · 2008: -17.8pp · 2024: -21.1pp
- All cycles
- 2024: R+21.1 2020: R+10.2 2016: R+15.0 2012: R+20.9 2008: R+17.8
Not yet ingested
- Civics
- —
Market trends
- HPI YoY
- ▲ 46.32%
- Current HPI
- 402.4192
- Rent YoY
- ▲ 5.45%
- Metro
- Bakersfield, CA
- State GDP YoY
- ▲ 3.21%
- F500 in state
- 116
Industry mix (Fortune 500 HQ in CA)
| Industry | F500 HQs | Revenue |
|---|---|---|
| Technology | 27 | $1,492B |
|
||
| Financial Services | 3 | $174B |
|
||
| Retail | 3 | $44B |
|
||
| Insurance | 3 | $26B |
|
||
| Media / Entertainment | 2 | $115B |
|
||
| Pharmaceuticals / Biotech | 2 | $62B |
|
||
Price history
+218.3% since first listed9 events — show timeline
- 2026-05-09 Listed $249,900 AVMLS
- 2022-11-04 Price Changed $275,000 AVMLS
- 2022-09-16 Price Changed $265,000 GEMLS
- 2022-09-15 Price Changed $280,000 GEMLS
- 2022-07-26 Price Changed $275,000 GEMLS
- 2001-09-13 Sold (Public Records) $87,000 Public Records
- 2001-09-13 Sold (MLS) $87,000 AVMLS
- 2001-07-10 Listed $84,000 AVMLS
- 1990-04-10 Sold (Public Records) $78,500 Public Records
Property tax history
+7.2%/yrLatest (2025): $1,654 · -4.8% YoY. Source: county tax records.
Cash-flow waterfall
monthlySold comps — $/sqft
last 12 mo · ≤1 miLoading sold comps…