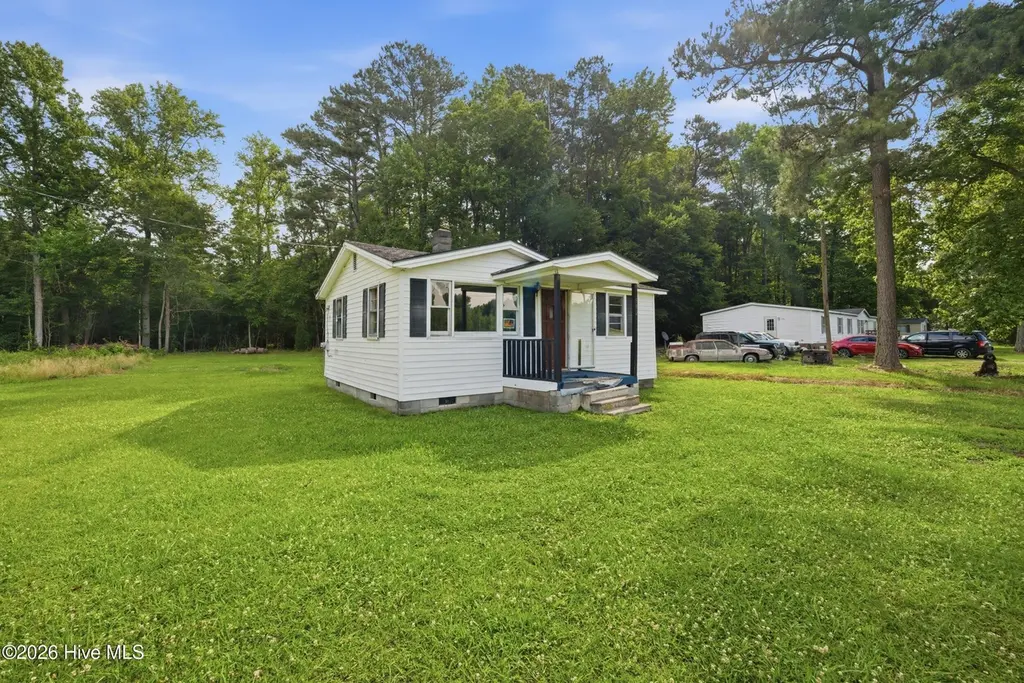
592 Crooked Run Rd · South Mills, NC
Flood risk 1/10 · Minimal
- FEMA flood zone
- X (unshaded)
- Chance of flooding over 30 yrs
- 0.0%
- Est. flood insurance / yr
- $507 – $1,088
Fire risk 4/10 · Minor
- Est. fire insurance / yr
- $906 – $1,684
Heat risk 9/10 · Severe
- Hot days now (above 107°F)
- 7 days/yr
- Hot days in 30 yrs
- 16 days/yr
Wind risk 8/10 · Major
- Chance of severe wind over 30 yrs
- 80.0%
Air-quality risk 1/10 · Minimal
- Unhealthy air days now
- 0 days/yr
- Unhealthy air days in 30 yrs
- 0 days/yr
Risk factors via First Street. Map © Google.
Why this score? — see what drove the B- grade
The composite is a weighted blend of 9 inputs, each scored 0–100. Each bar is that input's sub-score; the figure is the points it added to the 100-point composite (weight × sub-score).
- Cash flow +30.0/30.0
- 1% rule +10.0/10.0
- DSCR +10.0/10.0
- ARV discount +7.5/15.0
- Rent growth +3.5/5.0
- Livability +2.9/5.0
- Condition / age +2.5/5.0
- Schools +2.4/10.0
- Appreciation +0.0/10.0
$68,000
🖨 Deal sheet (PDF) 📄 Offer letter ✓ Due diligence
Listing remarks MLS
Enjoy living in the country close to the VA line! This is a fixer upper. Sold As Is! A 2/1 bungalow that you can make your own with some TLC!
Key facts
- Nearly half an acre
- 0.45 acre lot
- Built 1961
Tags
Property features AI
Finance
- Other: Zoning: A-1; Lot is level and wooded; Road frontage on city street and state road; Paved road surface; Lot dimensions approximately 104 x 202 x 77 x 62 x 158; Lot size about 0.45 acres; Directions: From 17N, turn left on US 158, slight right onto Firetower Rd, left onto Crooked Run Rd; in 0.8 miles the property will be on the right (driveway recently reinforced).
- Financial info: No investor or income/expense details listed
- HOA & community: No association amenities
Exterior
- Parking: Unpaved parking
- Security: No security features listed
- Utilities: Public water available; Water available; Private sewer / septic tank
- Home design: Single-family residence; One story; Entry on level 1; One-level floor plan
- Construction: Vinyl siding with frame construction; Composition roof; Built on crawl space
- Exterior features: Deck; Porch; Has a view; No additional exterior features listed
Interior
- Kitchen: No kitchen appliance details provided
- Bedrooms: No bedroom level details provided
- Flooring: Wood floors
- Bathrooms: One full bathroom; One half bathroom
- Heating & cooling: No heating; No cooling
- Interior features: No central heating or cooling; Electric water heater; Crawl space basement; Wood flooring; Two total rooms
- Laundry & utility: No laundry appliance details provided
Neighborhood map
What this means for you Summary
Snapshot
- This is a 2-bed/1.0-bath other listed at $68k.
Deal economics
- At list price, monthly cash flow is $535 ($6k/yr) — positive.
- The deal already cash-flows at list — no discount required.
- Meets the 1% rule at list price ($1k rent vs $68k).
- Recommended offer: $67k (1.5% below list) — sets the bar for market timing.
- Cap rate 15.7% vs local median 5.0% in South Mills — top-decile yield for the area; either an underpriced asset or a hidden risk that comps aren't pricing in. Stress-test before assuming the spread holds.
Location & tenants
- Location reads 57/100 on livability (#612 in NC) — a working-class tenant base; expect higher turnover. Strengths: cost of living A+, crime A, housing A; Watch: amenities F, commute F, employment F.
- Elizabeth City-Pasquotank Public Schools (rural): math 21% / reading 34% proficiency, ranked #152 of 178 in NC (top 85%) — low school quality limits family demand, transient renter base, plan for 1-2y turnover.
- Zoned schools: Northside Elementary (math 27% / reading 37%, grade F, #908 of 1,410 statewide, top 67%, 409 students, 99% FRL); Elizabeth City Middle (math 16% / reading 31%, grade F, #402 of 475 statewide, top 85%, 515 students, 99% FRL); Pasquotank County High (math 27% / reading 37%, grade F, #445 of 535 statewide, top 84%, 628 students, 100% FRL) — zoned schools average 99% FRL vs 56% district-wide (43 pts higher); higher-poverty schools than district average — tighter screening recommended.
- Market conditions: Rents rising fast (+4.0%/yr); 351 active listings in the ZIP; 153 units permitted in Pasquotank County in 2024 (0 in 5+ unit buildings).
Forward outlook
- Local home prices are declining (-3.0%/yr); year-one equity from $470 of loan paydown is wiped out by about $2k of value loss. Plan a longer hold.
- Pasquotank County population projected at -19% by 2050 — secular population decline; favor cash flow + early exit over multi-decade hold.
- At projected returns (-3.0% appreciation + 4.0% rent growth), your $19k cash investment doubles in ~4 years — after that, you're playing with house money.
Negotiation context
- It's been on market 20 days — a 2% lower offer ($67k) is reasonable based on typical stale-listing flexibility.
- 5 sale attempts since 2y ago with the ask held roughly flat each time — persistent listings suggest the price (not the market) is what's stuck; bring a comps-based counter.
- Current owner paid $45k; list at $68k implies a 51% gain — meaningful room to come down on a strong offer.
Risks & watch-outs
- Climate carrying-cost: severe wind risk, 80% chance of damaging wind over 30y; extreme-heat days projected 7→16/yr by 2055 (HVAC capex compounding) — expect insurance premiums to compound above CPI over the hold.
Questions for the listing agent
- Built in 1961 — when were the roof, HVAC, electrical panel, plumbing, and water heater last replaced?
- Is there a deadline driving the sale (1031 exchange, divorce, estate, relocation)? That informs how much negotiation room exists.
- Schools are D-rated, which usually means shorter tenancies and higher turnover. Who's the typical renter profile here, and what's been the actual vacancy rate?
- What's the average days-on-market for RENTAL listings here right now (not sales)? A rising rental-DOM trend means longer vacancies and softer asking-rent achievability than the comps imply.
- What's the recent tenant-quality profile in this submarket — average credit score on applications, eviction rate, late-payment / NSF rate, and stable-employment percentage? A property-management company in the area should have these aggregated.
- How much new for-sale + rental construction is in the pipeline within 1–3 miles? Heavy new supply typically softens prices + rents 12–24 months out; constrained supply supports both.
Investment metrics
- 1% rule
- 1.82% ✓
- Cap rate
- 15.74%
- Cash-on-cash
- 33.72%
- DSCR
- 2.50
- GRM
- 4.6
CMA / ARV
No comps found within radius.
Projected returns pro-forma
-3.0% appreciation · 4.02% rent growth · sell at horizon
- IRR
- 30.2%
- Equity multiple
- 2.28×
- Total profit
- $24,347
- Equity at exit
- $10,139
- IRR
- 38.0%
- Equity multiple
- 4.70×
- Total profit
- $70,472
- Equity at exit
- $5,879
Cash invested: $19,040 (down + closing). Projections, not guarantees.
Landlord ↔ Tenant lean methodology
- Overall (STATE)
- 85 Strongly Landlord-Friendly
- State North Carolina
- 85 Strongly Landlord-Friendly · R+3
- County
- — inherits STATE
- City
- — inherits STATE
ZIP-level market 27909
- Rents YoY
- 4.0%
- Active inventory
- 351
- Price-to-rent
- 4.6×
Monthly cashflow live
- Estimated rent
- $1,238 medium interval (Pro) →
- Mortgage (P&I)
- −$357
- Tax from tax record
- −$58 /mo · $698/yr
- Insurance
- −$28
- HOA
- −$0
- Lot rent
- −$0
- Vacancy / Maint / Mgmt
- −$260
- Net cashflow
- $535
Break-even live
Sensitivity live
| Price | -10% $574 | -5% $554 | +0% $535 | +5% $516 | +10% $497 |
|---|---|---|---|---|---|
| Rent | -10% $437 | -5% $486 | +0% $535 | +5% $584 | +10% $633 |
| Rate | -1.0pp $569 | -0.5pp $552 | base $535 | +0.5pp $517 | +1.0pp $500 |
UW: 25.0% down · 7.5% · 30yr · 1.5% tax · 5.0% vac · 8.0% maint · 8.0% mgmt
Financing live
Cash to close
- Down payment
- $17,000
- Closing costs
- $2,040
- Reserves months
- —
- Total cash needed
- —
Loan-product check · same deal, 3 products live
Conventional
25% down · 7.5% · 30yr
- Down + closing
- —
- Monthly P&I
- —
- Monthly cashflow
- —
- DSCR
- —
- Eligible?
- —
Personal DTI + credit; lowest rate.
DSCR
20% down · 8.5% · 30yr
- Down + closing
- —
- Monthly P&I
- —
- Monthly cashflow
- —
- DSCR
- —
- Eligible?
- —
No personal income docs; deal must DSCR.
Hard money
10% down · 12.0% · 12mo
- Down + closing
- —
- Monthly P&I
- —
- Monthly cashflow
- —
- DSCR
- —
- Eligible?
- —
Short-term bridge; refi at stabilization.
Listing history 17 events
-
2026-06-22days on market $68,000 Active 20 DOM
-
2026-06-21days on market $68,000 Active 19 DOM
-
2026-06-19days on market $68,000 Active 17 DOM
-
2026-06-18days on market $68,000 Active 16 DOM
-
2026-06-17days on market $68,000 Active 15 DOM
-
2026-06-16days on market $68,000 Active 14 DOM
-
2026-06-15days on market $68,000 Active 13 DOM
-
2026-06-14days on market $68,000 Active 11 DOM
-
2026-06-12days on market $68,000 Active 10 DOM
-
2026-06-09days on market $68,000 Active 7 DOM
-
2026-06-08days on market $68,000 Active 6 DOM
-
2026-06-07days on market $68,000 Active 5 DOM
-
2026-06-05days on market $68,000 Active 2 DOM
-
2026-06-03remarks 359-char remark
-
2026-06-03$68,000 Active 1 DOM
-
2026-06-02remarks 348-char remark
-
2026-06-02$68,000 Active 1 DOM
ⓘ Source: listings_history table (triggers on properties + properties_extension) + one-shot
backfill from property_details.listing_events for pre-trigger history.
Tax reassessment forecast NC · Resets to sale price
- Current annual tax
- $698 · $58/mo
- Projected year-2 tax
- $698 · $58/mo
- Expected delta
- $0/yr ($0/mo · 0.0%)
ⓘ Screening estimate from a state-policy table — verify with the county assessor before closing.
Climate risk First Street
- Flood 1/10 Low FEMA zone X (unshaded) · 0% chance over 30 yrs
- Wildfire 4/10 Moderate
- Heat 9/10 Extreme 7 d/yr ≥107°F today · 16 d/yr by 30 yrs out
- Wind 8/10 Severe 80% chance of damaging wind over 30 yrs
- Air quality 1/10 Low 0 unhealthy d/yr today · 0 by 30 yrs out
Nearby sold comps map
Loading sold comps map…
Walkable amenities ~0.75 mi
Loading nearby amenities…
Taxation est. · year 1
- Rental income
- $14,858
- − Mortgage interest
- −$3,809
- − Property taxes
- −$698
- − Insurance
- −$340
- − Repairs & maintenance
- −$1,189
- − Management
- −$1,189
- − Depreciation
- −$1,978
- Taxable income
- $5,656
- Est. tax owed @ 24.0%
- −$1,357
- After-tax cash flow
- $5,064/yr
For passive investors: Depreciation is non-cash, so a rental often shows a tax loss while cash-flowing — sheltering income. Rental losses are passive: they offset passive income freely, and up to $25,000/yr can offset ordinary (W-2) income if you actively participate and your MAGI is under $100k (phasing out to $0 by $150k); unused losses carry forward. On sale, claimed depreciation is recaptured at up to 25%, and gains may owe capital-gains tax (a 1031 exchange can defer both). Figures are a year-1 estimate at your 24.0% rate — not tax advice; consult a CPA.
Schools (NCES district)
- District
- Elizabeth City-Pasquotank Public Schools
- NCES district ID
- 3703540
- Math proficiency
- 21% ▼ -7.00%
- Reading proficiency
- 34% ▼ -1.00%
- Median HH income
- $45,294
- Composite
- 23.63/100
- National rank
- #7847
- State rank
- #152 of 178 in NC
Livability — South Mills
- Score
- 57/100
- State rank
- #612
- US rank
- #22229
Category grades
Schools grade is shown separately in the Schools card above.
Census & demographics
- County
- Pasquotank County · 40,869 people
- Metro
- Elizabeth City, NC
- Population (ZIP)
- 40,869
- Household income
- $66,732
- Rent vs Own
- Severe rent burden
- 1160.0
Population outlook (Pasquotank County) Hauer SSP2
- Today (2025)
- 38,172 people
- By 2030
- 36,890 · -3.4%
- By 2040
- 33,845 · -11.3%
- By 2050
- 31,086 · -18.6%
- By 2075
- 27,191 · -28.8%
- By 2100
- 26,093 · -31.6%
Race, ethnicity, and origin ACS 2023
- Neighborhood character
- Diverse neighborhood (Simpson 0.59)
- Race & ethnicity
- White 54% Black 35% Hispanic / Latino 6% Two or more races 6% Asian 1%
- Hispanic origin (detail)
- Mexican 2% Puerto Rican 2%
- Common ancestry
- Slovak 2% Romanian 1% Lithuanian 1%
- Foreign-born
- 3% · Canada, Vietnam
- Languages at home
- 96% English-only · Spanish 2% Other Asian/Pacific 1% Vietnamese 1%
Political lean MEDSL · Pasquotank
- 2024 margin
- Toss-up / Even · D 47.1% · R 52.0%
- 2008→2024 swing
- -18.6pp toward R · 2008: 13.7pp · 2024: -4.9pp
- All cycles
- 2024: R+4.9 2020: D+0.3 2016: D+2.2 2012: D+15.9 2008: D+13.7
Not yet ingested
- Civics
- —
Market trends
- HPI YoY
- ▼ -141.03%
- Current HPI
- 164.7511
- Rent YoY
- ▲ 4.02%
- Metro
- Elizabeth City, NC
- State GDP YoY
- ▲ 3.28%
- F500 in state
- 26
Industry mix (Fortune 500 HQ in NC)
| Industry | F500 HQs | Revenue |
|---|---|---|
| Financial Services | 2 | $213B |
|
||
| Retail | 2 | $95B |
|
||
| Industrial Conglomerate | 1 | $38B |
|
||
| Metals / Steel | 1 | $35B |
|
||
| Utilities | 1 | $30B |
|
||
| Industrial Machinery | 1 | $19B |
|
||
Price history
-2.7% since first listed11 events — show timeline
- 2026-06-01 Listed $68,000 Hive MLS
- 2025-05-16 Sold (Public Records) $225,000 Public Records
- 2025-05-16 Sold (MLS) $45,000 Hive MLS
- 2025-04-28 Pending — Hive MLS
- 2025-01-06 Relisted — Hive MLS
- 2024-10-15 Pending — Hive MLS
- 2024-08-15 Relisted — Hive MLS
- 2024-08-05 Pending — Hive MLS
- 2024-05-22 Relisted — Hive MLS
- 2024-05-08 Pending — Hive MLS
- 2024-04-30 Listed $69,900 Hive MLS
Property tax history
+2.2%/yrLatest (2025): $698 · +7.3% YoY. Source: county tax records.
Cash-flow waterfall
monthlySold comps — $/sqft
last 12 mo · ≤1 miLoading sold comps…