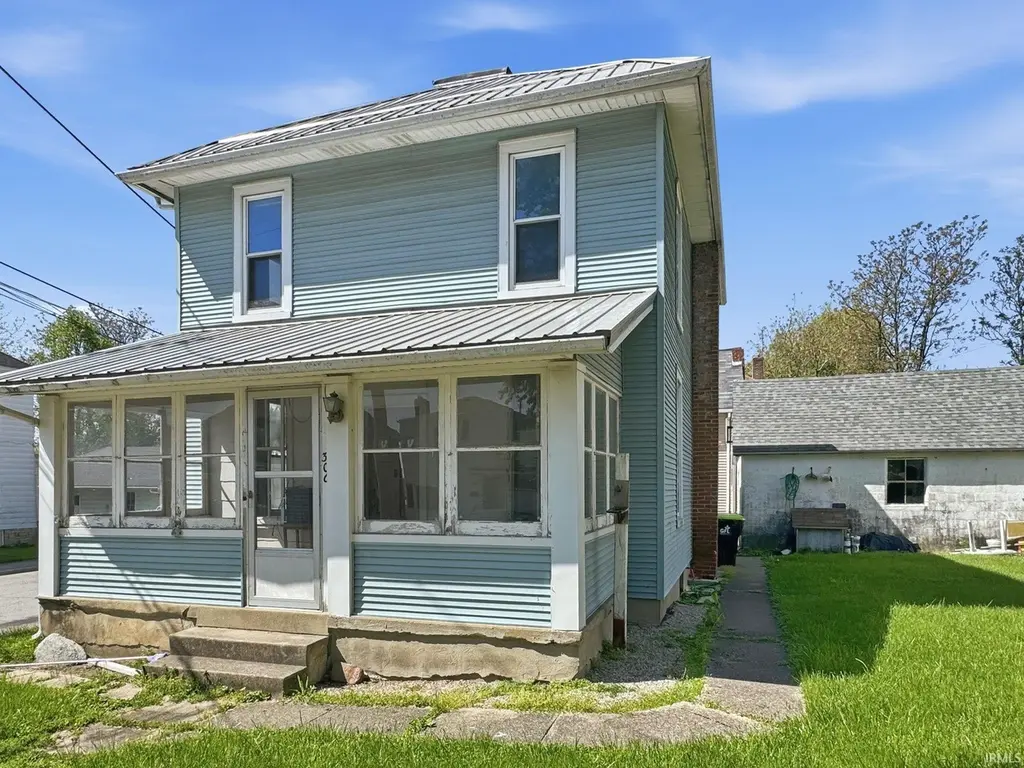
300 Oak St · Huntington, IN
Flood risk 1/10 · Minimal
- FEMA flood zone
- X (unshaded)
- Chance of flooding over 30 yrs
- 0.0%
- Est. flood insurance / yr
- $473 – $860
Fire risk 1/10 · Minimal
- Est. fire insurance / yr
- $717 – $1,331
Heat risk 3/10 · Minor
- Hot days now (above 101°F)
- 7 days/yr
- Hot days in 30 yrs
- 17 days/yr
Wind risk 2/10 · Minimal
- Chance of severe wind over 30 yrs
- —
Air-quality risk 3/10 · Minor
- Unhealthy air days now
- 1 days/yr
- Unhealthy air days in 30 yrs
- 3 days/yr
Risk factors via First Street. Map © Google.
Why this score? — see what drove the B- grade
The composite is a weighted blend of 9 inputs, each scored 0–100. Each bar is that input's sub-score; the figure is the points it added to the 100-point composite (weight × sub-score).
- Cash flow +30.0/30.0
- DSCR +10.0/10.0
- 1% rule +8.7/10.0
- ARV discount +7.5/15.0
- Livability +3.5/5.0
- Schools +3.1/10.0
- Rent growth +2.5/5.0
- Condition / age +2.5/5.0
- Appreciation +0.0/10.0
$79,900
🖨 Deal sheet 📄 Offer letter ✓ Due diligence
Listing remarks
Look inside this Northside 2 Story that offers TREMENDOUS OPPORTUNITY! 4 Bedroom, 1.5 Bath, Home of 1564 sq ft of living space + 2 enclosed porches and it's 20x24 Detached Garage, GFA Furnace, 200 Amp Electrical, Metal Roof. ALL this conveniently located to the Heartbeat of Downtown Huntington. [Neighboring the post office; library; dining & shopping to share a close few niceties nearby. ] This Opportunity to build from an AFFORDABLE INVESTMENT is a rare find. Make your offer count! NOTE: Late 2025 home experienced power failure, a pipe burst causing water damage. Paul Davis Restoration extracted water & plumbing concern was remedied. PROOF of Funds is Required with ALL Offers.
Key facts
- 200 amp electrical
- Metal roof
- 2 enclosed porches
Tags
Property features AI
Exterior
- Parking: Detached 1-car garage
- Utilities: Public water; Public sewer; Cable available
- Home design: Single-family residence (site-built); 2-story
- Construction: Vinyl siding; Stone foundation; Metal roof; Built above grade (finished area listed)
- Exterior features: Corner, level lot; No fencing; Detached workshop
Interior
- Kitchen: Gas range; Refrigerator
- Bedrooms: Total of 7 rooms (bedroom count not specified)
- Flooring: Hardwood; Vinyl
- Bathrooms: 1 full bathroom; 1 half bathroom; One main-level bathroom
- Heating & cooling: Natural gas heating; Forced air; Floor furnace; Window air conditioning units
- Interior features: Refrigerator; Gas range; Gas water heater; Water heater; One fireplace; Basement access to exterior (full, unfinished, walk-up); Main-level laundry
- Laundry & utility: Laundry on the main level
Neighborhood map
What this means for you Summary
Snapshot
- This is a 3-bed/1.5-bath single-family listed at $80k.
Deal economics
- At list price, monthly cash flow is $378 ($5k/yr) — positive.
- The deal already cash-flows at list — no discount required.
- Meets the 1% rule at list price ($1k rent vs $80k).
- Recommended offer: $79k (1.5% below list) — sets the bar for market timing.
- Cap rate 12.0% vs local median 4.3% in Huntington — top-decile yield for the area; either an underpriced asset or a hidden risk that comps aren't pricing in. Stress-test before assuming the spread holds.
Location & tenants
- Location reads 69/100 on livability (#193 in IN) — a middle-class / working-renter tenant base. Strengths: crime A+, cost of living A+, housing A+; Watch: health & safety C-, employment D, amenities F.
- Huntington County Community School Corporation (rural): math 34% / reading 39% proficiency, ranked #176 of 301 in IN (top 58%) — families likely to look elsewhere, expect single-tenant / working-renter base with shorter leases.
- Zoned schools: Flint Springs Elementary (math 35% / reading 38%, grade F, #571 of 994 statewide, top 58%, 461 students, 55% FRL); Crestview Middle School (math 28% / reading 38%, grade F, #180 of 330 statewide, top 56%, 606 students, 47% FRL); Huntington North High School (math 30% / reading 55%, grade F, #195 of 369 statewide, top 53%, 1,424 students, 42% FRL).
- Market conditions: 112 active listings in the ZIP; 79 units permitted in Huntington County in 2024 (0 in 5+ unit buildings).
Forward outlook
- Local home prices are declining (-3.0%/yr); year-one equity from $552 of loan paydown is wiped out by about $2k of value loss. Plan a longer hold.
- Huntington County population projected at -14% by 2050 — secular population decline; favor cash flow + early exit over multi-decade hold.
- At projected returns (-3.0% appreciation + 3.0% rent growth), your $22k cash investment doubles in ~6 years — after that, you're playing with house money.
Negotiation context
- It's been on market 15 days — a 2% lower offer ($79k) is reasonable based on typical stale-listing flexibility.
- 2 sale attempts with the ask held roughly flat each time — persistent listings suggest the price (not the market) is what's stuck; bring a comps-based counter.
Risks & watch-outs
- Watch-outs: built in 1888 — expect roof / HVAC / electrical / plumbing capex.
Questions for the listing agent
- Built in 1888 — when were the roof, HVAC, electrical panel, plumbing, and water heater last replaced?
- Is there a deadline driving the sale (1031 exchange, divorce, estate, relocation)? That informs how much negotiation room exists.
- Schools are D-rated, which usually means shorter tenancies and higher turnover. Who's the typical renter profile here, and what's been the actual vacancy rate?
- What's the average days-on-market for RENTAL listings here right now (not sales)? A rising rental-DOM trend means longer vacancies and softer asking-rent achievability than the comps imply.
- What's the recent tenant-quality profile in this submarket — average credit score on applications, eviction rate, late-payment / NSF rate, and stable-employment percentage? A property-management company in the area should have these aggregated.
- How much new for-sale + rental construction is in the pipeline within 1–3 miles? Heavy new supply typically softens prices + rents 12–24 months out; constrained supply supports both.
Investment metrics
- 1% rule
- 1.37% ✓
- Cap rate
- 11.97%
- Cash-on-cash
- 20.27%
- DSCR
- 1.90
- GRM
- 6.1
CMA / ARV
- ARV (on-the-fly)
- $167,348
- Comps found
- 12
Show comp detail 12 sales within ~0.75 mi
| Address | Dist | Beds/Ba | Sqft | Sold | Price | $/sf | Match |
|---|---|---|---|---|---|---|---|
| 1020 N Lafontaine St | 0.44mi | 3/1.5 | 1,539 (-2%) | 2mo | $162,500 | $106 | 75 |
| 920 Poplar St | 0.29mi | 3/1.0 | 1,694 (+8%) | 1mo | $165,000 | $97 | 70 |
| 253 W Tipton St | 0.12mi | 3/2.0 | 1,792 (+15%) | 0mo | $170,000 | $95 | 68 |
| 719 Etna Ave | 0.53mi | 3/1.5 | 1,636 (+5%) | 1mo | $179,000 | $109 | 67 |
| 1101 Oak St | 0.47mi | 3/2.5 | 1,644 (+5%) | 1mo | $272,000 | $165 | 65 |
| 917 W Tipton St | 0.30mi | 3/1.0 | 1,350 (-14%) | 1mo | $152,000 | $113 | 60 |
| 503 Court St | 0.49mi | 4/1.5 (+1) | 1,666 (+6%) | 2mo | $142,000 | $85 | 60 |
| 840 Elm St | 0.57mi | 3/2.5 | 1,672 (+7%) | 1mo | $214,900 | $129 | 57 |
| 515 E Market St St | 0.49mi | 4/2.0 (+1) | 1,720 (+10%) | 0mo | $175,000 | $102 | 53 |
| 1111 Cherry St | 0.38mi | 2/1.5 (-1) | 1,335 (-15%) | 1mo | $165,000 | $124 | 52 |
| 1464 Byron St | 0.58mi | 4/3.0 (+1) | 1,690 (+8%) | 2mo | $181,000 | $107 | 47 |
| 617 E Franklin St | 0.59mi | 2/1.0 (-1) | 1,370 (-12%) | 0mo | $74,900 | $55 | 45 |
Match score weights: distance 35% · size 25% · config 20% · recency 20%. Top-matched comps best support the ARV.
Projected returns pro-forma
-3.0% appreciation · 3.0% rent growth · sell at horizon
- IRR
- 12.5%
- Equity multiple
- 1.50×
- Total profit
- $11,102
- Equity at exit
- $11,913
- IRR
- 21.4%
- Equity multiple
- 2.81×
- Total profit
- $40,566
- Equity at exit
- $6,908
Cash invested: $22,372 (down + closing). Projections, not guarantees.
Landlord ↔ Tenant lean methodology
- Overall (STATE)
- 90 Strongly Landlord-Friendly
- State Indiana
- 90 Strongly Landlord-Friendly · R+11
- County
- — inherits STATE
- City
- — inherits STATE
ZIP-level market 46750
- Home prices YoY
- -33.0%
- Active inventory
- 112
- Price-to-rent
- 6.1×
Monthly cashflow live
- Estimated rent
- $1,093 medium interval (Pro) →
- Mortgage (P&I)
- −$419
- Tax from tax record
- −$33 /mo · $401/yr
- Insurance
- −$33
- HOA
- −$0
- Vacancy / Maint / Mgmt
- −$230
- Net cashflow
- $378
Break-even live
UW: 25.0% down · 7.5% · 30yr · 1.5% tax · 5.0% vac · 8.0% maint · 8.0% mgmt
Financing live
Cash to close
- Down payment
- $19,975
- Closing costs
- $2,397
- Reserves months
- —
- Total cash needed
- —
Loan-product check · same deal, 3 products live
Conventional
25% down · 7.5% · 30yr
- Down + closing
- —
- Monthly P&I
- —
- Monthly cashflow
- —
- DSCR
- —
- Eligible?
- —
Personal DTI + credit; lowest rate.
DSCR
20% down · 8.5% · 30yr
- Down + closing
- —
- Monthly P&I
- —
- Monthly cashflow
- —
- DSCR
- —
- Eligible?
- —
No personal income docs; deal must DSCR.
Hard money
10% down · 12.0% · 12mo
- Down + closing
- —
- Monthly P&I
- —
- Monthly cashflow
- —
- DSCR
- —
- Eligible?
- —
Short-term bridge; refi at stabilization.
Listing history 3 events
-
2026-05-23status Pending
-
2026-05-07$79,900 Active
-
2025-08-21Active
ⓘ Source: listings_history table (triggers on properties + properties_extension) + one-shot
backfill from property_details.listing_events for pre-trigger history.
Tax reassessment forecast IN · Partial reset (capped growth)
- Current annual tax
- $401 · $33/mo
- Projected year-2 tax
- $540 · $45/mo
- Expected delta
- +$139/yr (+$12/mo · 34.7%)
ⓘ Screening estimate from a state-policy table — verify with the county assessor before closing.
Climate risk First Street
- Flood 1/10 Low FEMA zone X (unshaded) · 0% chance over 30 yrs
- Wildfire 1/10 Low
- Heat 3/10 Moderate 7 d/yr ≥101°F today · 17 d/yr by 30 yrs out
- Wind 2/10 Low
- Air quality 3/10 Moderate 1 unhealthy d/yr today · 3 by 30 yrs out
Nearby sold comps map
Loading sold comps map…
Walkable amenities ~0.75 mi
Loading nearby amenities…
Taxation est. · year 1
- Rental income
- $13,119
- − Mortgage interest
- −$4,476
- − Property taxes
- −$401
- − Insurance
- −$400
- − Repairs & maintenance
- −$1,050
- − Management
- −$1,050
- − Depreciation
- −$2,324
- Taxable income
- $3,420
- Est. tax owed @ 24.0%
- −$821
- After-tax cash flow
- $3,715/yr
For passive investors: Depreciation is non-cash, so a rental often shows a tax loss while cash-flowing — sheltering income. Rental losses are passive: they offset passive income freely, and up to $25,000/yr can offset ordinary (W-2) income if you actively participate and your MAGI is under $100k (phasing out to $0 by $150k); unused losses carry forward. On sale, claimed depreciation is recaptured at up to 25%, and gains may owe capital-gains tax (a 1031 exchange can defer both). Figures are a year-1 estimate at your 24.0% rate — not tax advice; consult a CPA.
Schools (NCES district)
- District
- Huntington County Community School Corporation
- NCES district ID
- 1804710
- Math proficiency
- 34% ▼ -6.00%
- Reading proficiency
- 39% ▼ -10.00%
- Median HH income
- $47,010
- Composite
- 31.29/100
- National rank
- #6013
- State rank
- #176 of 301 in IN
Livability — Huntington
- Score
- 69/100
- State rank
- #193
- US rank
- #8771
Category grades
Schools grade is shown separately in the Schools card above.
Census & demographics
- Census place
- Huntington, IN
- City population
- 27,341
- Population (ZIP)
- 27,341
Population outlook (Huntington County) Hauer SSP2
- Today (2025)
- 35,613 people
- By 2030
- 34,759 · -2.4%
- By 2040
- 32,682 · -8.2%
- By 2050
- 30,495 · -14.4%
- By 2075
- 26,298 · -26.2%
- By 2100
- 22,653 · -36.4%
Race, ethnicity, and origin ACS 2023
- Neighborhood character
- Predominantly White (93%)
- Race & ethnicity
- White 93% Hispanic / Latino 3% Two or more races 2% Black 1%
- Common ancestry
- Italian 2% Slovak 2% Romanian 2%
- Foreign-born
- 2% · China, Canada
- Languages at home
- 96% English-only · Spanish 2% Chinese 1% German/W. Germanic 1%
Political lean MEDSL · Huntington
- 2024 margin
- Solid R (+48.4) · D 24.9% · R 73.3% · Other 1.8%
- 2008→2024 swing
- -21.2pp toward R · 2008: -27.2pp · 2024: -48.4pp
- All cycles
- 2024: R+48.4 2020: R+49.9 2016: R+51.0 2012: R+39.8 2008: R+27.2
Not yet ingested
- Civics
- —
Market trends
- HPI YoY
- ▼ -106.89%
- Current HPI
- 216.5969
- Rent YoY
- —
- Metro
- —
- State GDP YoY
- ▲ 2.90%
- F500 in state
- 18
Industry mix (Fortune 500 HQ in IN)
| Industry | F500 HQs | Revenue |
|---|---|---|
| Industrial Machinery | 2 | $37B |
|
||
| Healthcare | 1 | $177B |
|
||
| Pharmaceuticals | 1 | $45B |
|
||
| Metals / Steel | 1 | $18B |
|
||
| Agriculture | 1 | $17B |
|
||
| Packaging | 1 | $12B |
|
||
Price history
3 events — show timeline
- 2026-05-23 Pending — IRMLS
- 2026-05-07 Listed $79,900 IRMLS
- 2025-08-21 Listed — IRMLS
Property tax history
+11.9%/yrLatest (2024): $401 · +58.9% YoY. Source: county tax records.
Cash-flow waterfall
monthlySold comps — $/sqft
last 12 mo · ≤1 miLoading sold comps…