407 Tennessee Walking Ln · Brooksburg, IN
Flood risk 9/10 · Severe
- FEMA flood zone
- X (unshaded)
- Chance of flooding over 30 yrs
- 0.99%
- Est. flood insurance / yr
- $507 – $1,088
Fire risk 3/10 · Minor
- Est. fire insurance / yr
- $839 – $1,559
Heat risk 4/10 · Minor
- Hot days now (above 104°F)
- 7 days/yr
- Hot days in 30 yrs
- 19 days/yr
Wind risk 2/10 · Minimal
- Chance of severe wind over 30 yrs
- 1.0%
Air-quality risk 2/10 · Minimal
- Unhealthy air days now
- 1 days/yr
- Unhealthy air days in 30 yrs
- 2 days/yr
Risk factors via First Street. Map © Google.
Why this score? — see what drove the D grade
The composite is a weighted blend of 9 inputs, each scored 0–100. Each bar is that input's sub-score; the figure is the points it added to the 100-point composite (weight × sub-score).
- Cash flow +12.5/30.0
- ARV discount +7.5/15.0
- Appreciation +5.1/10.0
- DSCR +3.7/10.0
- 1% rule +3.6/10.0
- Livability +2.9/5.0
- Rent growth +2.5/5.0
- Condition / age +2.5/5.0
- Schools +1.5/10.0
$189,900
🖨 Deal sheet 📄 Offer letter ✓ Due diligence
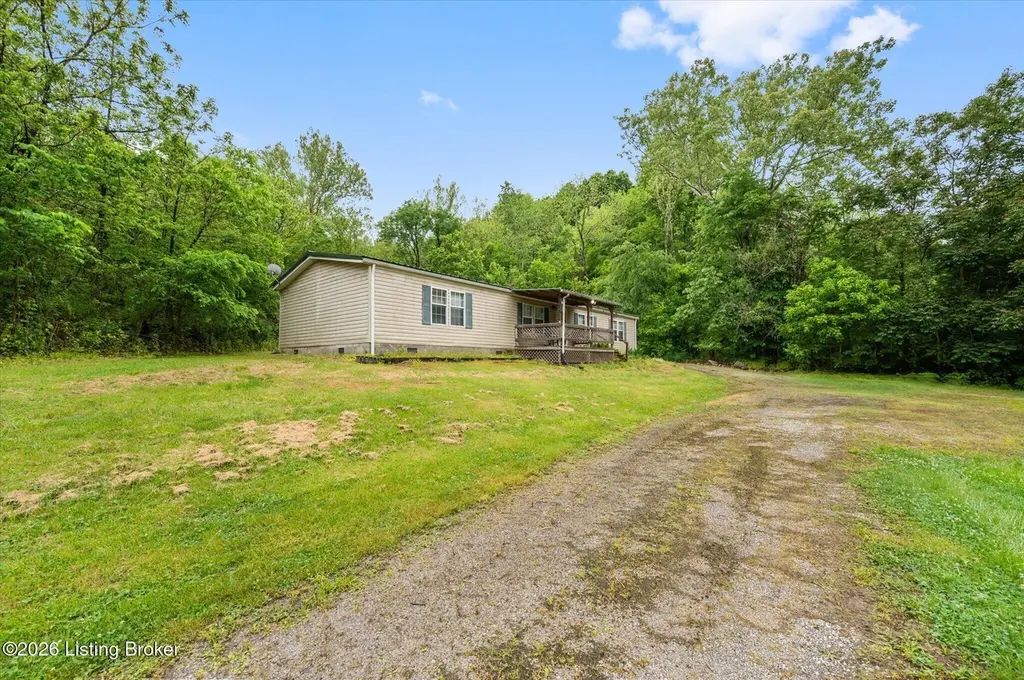
Listing remarks
Tucked away across the creek and surrounded by peaceful woods, 3-bedroom home in Milton. Inside, you'll find durable vinyl plank flooring, spacious walk-in closets in every bedroom, and the comfort of both an electric furnace and a wood-burning furnace for efficient year-round heating. Step outside to enjoy the covered rear porch, complete with an attached lean-to for convenient dry wood storage. A standout feature of the property is the impressive 30x50 detached garage with concrete floors, electric, frost-free hydrant, and 12-foot ceilings — large enough to accommodate a dump truck, making it ideal for equipment storage, hobbies, or a workshop. Looking for even more acreage? An addi
Key facts
- Walk-in closets
- Vinyl plank flooring
- Concrete floors
Tags
Property features AI
Finance
- HOA & community: No association fee
Exterior
- Parking: Detached garage and driveway; Two garage spaces
- Utilities: Electricity connected
- Home design: Residential ranch-style home; Single-story (1 story); Built in 2003
- Construction: Vinyl siding construction; Metal roof; Crawl space foundation
- Exterior features: Property includes easement; Located on a dead-end road; Wooded parcel
Interior
- Kitchen: Kitchen on the first floor; Dining area adjacent to the kitchen
- Bedrooms: Three bedrooms (all on the first floor); Primary bedroom on the first floor
- Bathrooms: Three full bathrooms (primary and full bathrooms located on the first floor)
- Interior features: Seven total rooms; Three closets; No basement; Great room; Dining area
- Laundry & utility: First-floor laundry room
Neighborhood map
What this means for you Summary
Snapshot
- This is a 3-bed/3.0-bath manufactured listed at $190k.
Deal economics
- At list price, monthly cash flow is $-93 ($-1k/yr) — negative.
- To cash-flow at today's rent, offer at most $176k (7.1% below list).
- To meet the 1% rule (rent ≥ 1% of price), the offer needs to be $163k (14.3% below list).
- Recommended offer: $163k (14.3% below list) — sets the bar for 1% rule.
Location & tenants
- Location reads 57/100 on livability (#611 in IN) — a working-class tenant base; expect higher turnover. Strengths: cost of living A+; Watch: employment D+, crime D, health & safety D.
- Carroll County (town): math 12% / reading 23% proficiency, ranked #163 of 165 in KY (top 99%) — low school quality limits family demand, transient renter base, plan for 1-2y turnover.
- Market conditions: 3 units permitted in Carroll County in 2024 (0 in 5+ unit buildings).
Forward outlook
- In year one you build about $2k of equity ($1k loan paydown + $463 appreciation (0.2% local appreciation)).
- Carroll County population projected at -15% by 2050 — secular population decline; favor cash flow + early exit over multi-decade hold.
Negotiation context
- Only 4 days on market — expect competitive offers; lowballing is unlikely to land.
- Current owner paid $100k; list at $190k implies a 90% gain — meaningful room to come down on a strong offer.
Risks & watch-outs
- Watch-outs: flood insurance adds $66/mo.
- Climate carrying-cost: severe flood risk — expect insurance premiums to compound above CPI over the hold.
Questions for the listing agent
- What do current leases actually rent for vs. the listed asking? Can we see a recent rent roll and the last 12 months of T-12 income?
- What's the actual annual flood-insurance premium (NFIP or private), and is the property in a SFHA with mandatory coverage?
- Is there a deadline driving the sale (1031 exchange, divorce, estate, relocation)? That informs how much negotiation room exists.
- Schools are F-rated, which usually means shorter tenancies and higher turnover. Who's the typical renter profile here, and what's been the actual vacancy rate?
- Crime grade is D in this area — have there been break-ins, vandalism, or insurance claims at this property in the last 3 years? What carrier currently insures it and at what premium?
- The area grade is low — what's the realistic commute time and amenity access for the typical tenant pool here? Any planned neighborhood developments (good or bad) we should know about?
- What's the average days-on-market for RENTAL listings here right now (not sales)? A rising rental-DOM trend means longer vacancies and softer asking-rent achievability than the comps imply.
- What's the recent tenant-quality profile in this submarket — average credit score on applications, eviction rate, late-payment / NSF rate, and stable-employment percentage? A property-management company in the area should have these aggregated.
- How much new for-sale + rental construction is in the pipeline within 1–3 miles? Heavy new supply typically softens prices + rents 12–24 months out; constrained supply supports both.
Investment metrics
- 1% rule
- 0.86% ✗
- Cap rate
- 6.13%
- Cash-on-cash
- -0.60%
- DSCR
- 0.97
- GRM
- 9.7
CMA / ARV
No comps found within radius.
Projected returns pro-forma
0.24% appreciation · 3.0% rent growth · sell at horizon
- IRR
- -3.6%
- Equity multiple
- 0.83×
- Total profit
- $-9,218
- Equity at exit
- $57,467
- IRR
- 2.0%
- Equity multiple
- 1.23×
- Total profit
- $12,032
- Equity at exit
- $70,963
Cash invested: $53,172 (down + closing). Projections, not guarantees.
Landlord ↔ Tenant lean methodology
- Overall (STATE)
- 90 Strongly Landlord-Friendly
- State Indiana
- 90 Strongly Landlord-Friendly · R+11
- County
- — inherits STATE
- City
- — inherits STATE
ZIP-level market 40045
- Home prices YoY
- 0.1%
- Price-to-rent
- 9.7×
Monthly cashflow live
- Estimated rent
- $1,628 medium interval (Pro) →
- Mortgage (P&I)
- −$996
- Tax est. 1.5%
- −$237 /mo · $2,848/yr
- Insurance
- −$79
- Flood insurance flood zone
- −$66 /mo · $798/yr
- HOA
- −$0
- Vacancy / Maint / Mgmt
- −$342
- Net cashflow
- $-93
Break-even live
UW: 25.0% down · 7.5% · 30yr · 1.5% tax · 5.0% vac · 8.0% maint · 8.0% mgmt
Financing live
Cash to close
- Down payment
- $47,475
- Closing costs
- $5,697
- Reserves months
- —
- Total cash needed
- —
Loan-product check · same deal, 3 products live
Conventional
25% down · 7.5% · 30yr
- Down + closing
- —
- Monthly P&I
- —
- Monthly cashflow
- —
- DSCR
- —
- Eligible?
- —
Personal DTI + credit; lowest rate.
DSCR
20% down · 8.5% · 30yr
- Down + closing
- —
- Monthly P&I
- —
- Monthly cashflow
- —
- DSCR
- —
- Eligible?
- —
No personal income docs; deal must DSCR.
Hard money
10% down · 12.0% · 12mo
- Down + closing
- —
- Monthly P&I
- —
- Monthly cashflow
- —
- DSCR
- —
- Eligible?
- —
Short-term bridge; refi at stabilization.
Listing history 2 events
-
2026-05-18$189,900 Active
-
2014-10-16soldstatus $100,000
ⓘ Source: listings_history table (triggers on properties + properties_extension) + one-shot
backfill from property_details.listing_events for pre-trigger history.
Climate risk First Street
- Flood 9/10 Extreme FEMA zone X (unshaded) · 99% chance over 30 yrs
- Wildfire 3/10 Moderate
- Heat 4/10 Moderate 7 d/yr ≥104°F today · 19 d/yr by 30 yrs out
- Wind 2/10 Low 100% chance of damaging wind over 30 yrs
- Air quality 2/10 Low 1 unhealthy d/yr today · 2 by 30 yrs out
Nearby sold comps map
Loading sold comps map…
Walkable amenities ~0.75 mi
Loading nearby amenities…
Taxation est. · year 1
- Rental income
- $19,533
- − Mortgage interest
- −$10,637
- − Property taxes
- −$2,848
- − Insurance
- −$1,747
- − Repairs & maintenance
- −$1,563
- − Management
- −$1,563
- − Depreciation
- −$5,524
- Taxable loss
- −$4,349
- Est. tax savings @ 24.0%
- +$1,044
- After-tax cash flow
- $-71/yr
For passive investors: Depreciation is non-cash, so a rental often shows a tax loss while cash-flowing — sheltering income. Rental losses are passive: they offset passive income freely, and up to $25,000/yr can offset ordinary (W-2) income if you actively participate and your MAGI is under $100k (phasing out to $0 by $150k); unused losses carry forward. On sale, claimed depreciation is recaptured at up to 25%, and gains may owe capital-gains tax (a 1031 exchange can defer both). Figures are a year-1 estimate at your 24.0% rate — not tax advice; consult a CPA.
Schools (NCES district)
- District
- Carroll County
- NCES district ID
- 2100990
- Math proficiency
- 12% ▼ -14.00%
- Reading proficiency
- 23% ▼ -15.00%
- Median HH income
- $41,646
- Composite
- 15.0/100
- National rank
- #9361
- State rank
- #163 of 165 in KY
Livability — Brooksburg
- Score
- 57/100
- State rank
- #611
- US rank
- #22020
Category grades
Schools grade is shown separately in the Schools card above.
Census & demographics
- Population (ZIP)
- 3,118
Population outlook (Carroll County) Hauer SSP2
- Today (2025)
- 10,359 people
- By 2030
- 10,058 · -2.9%
- By 2040
- 9,465 · -8.6%
- By 2050
- 8,788 · -15.2%
- By 2075
- 7,079 · -31.7%
- By 2100
- 5,066 · -51.1%
Race, ethnicity, and origin ACS 2023
- Neighborhood character
- Predominantly White (92%)
- Race & ethnicity
- White 92% Hispanic / Latino 5% Two or more races 3%
- Hispanic origin (detail)
- Mexican 3% Puerto Rican 2%
- Common ancestry
- Slovak 5% Serbian 2% Iranian 1%
- Foreign-born
- 1% · Canada
- Languages at home
- 98% English-only · Spanish 1% Other Indo-European 1%
Political lean MEDSL · Carroll
- 2024 margin
- Solid R (+51.0) · D 23.9% · R 74.9% · Other 1.2%
- 2008→2024 swing
- -42.7pp toward R · 2008: -8.2pp · 2024: -51.0pp
- All cycles
- 2024: R+51.0 2020: R+44.4 2016: R+38.5 2012: R+10.1 2008: R+8.2
Not yet ingested
- Civics
- —
Market trends
- HPI YoY
- ▲ 0.24%
- Current HPI
- 186.5524
- Rent YoY
- —
- Metro
- —
- State GDP YoY
- ▲ 2.90%
- F500 in state
- 18
Industry mix (Fortune 500 HQ in IN)
| Industry | F500 HQs | Revenue |
|---|---|---|
| Industrial Machinery | 2 | $37B |
|
||
| Healthcare | 1 | $177B |
|
||
| Pharmaceuticals | 1 | $45B |
|
||
| Metals / Steel | 1 | $18B |
|
||
| Agriculture | 1 | $17B |
|
||
| Packaging | 1 | $12B |
|
||
Price history
+89.9% since first listed2 events — show timeline
- 2026-05-18 Listed $189,900 Metro Search MLS
- 2014-10-16 Sold (Public Records) $100,000 Public Records
Property tax history
-6.7%/yrLatest (2025): $309 · -8.7% YoY. Source: county tax records.
Cash-flow waterfall
monthlySold comps — $/sqft
last 12 mo · ≤1 miLoading sold comps…