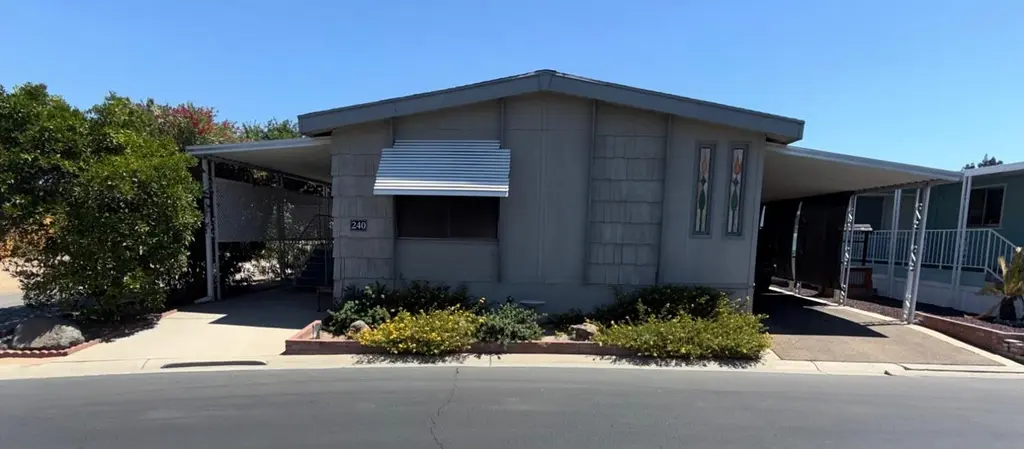
2706 W Ashlan Ave #240 · Fresno, CA
Flood risk 1/10 · Minimal
- FEMA flood zone
- X (unshaded)
- Chance of flooding over 30 yrs
- 0.0%
- Est. flood insurance / yr
- $507 – $1,088
Fire risk 1/10 · Minimal
- Est. fire insurance / yr
- $659 – $1,223
Heat risk 8/10 · Major
- Hot days now (above 105°F)
- 7 days/yr
- Hot days in 30 yrs
- 16 days/yr
Wind risk 1/10 · Minimal
- Chance of severe wind over 30 yrs
- —
Air-quality risk 10/10 · Severe
- Unhealthy air days now
- 48 days/yr
- Unhealthy air days in 30 yrs
- 50 days/yr
Risk factors via First Street. Map © Google.
Why this score? — see what drove the C+ grade
The composite is a weighted blend of 9 inputs, each scored 0–100. Each bar is that input's sub-score; the figure is the points it added to the 100-point composite (weight × sub-score).
- Cash flow +30.0/30.0
- 1% rule +10.0/10.0
- DSCR +10.0/10.0
- Rent growth +3.8/5.0
- Livability +3.1/5.0
- Schools +2.7/10.0
- Condition / age +2.5/5.0
- ARV discount +0.0/15.0
- Appreciation +0.0/10.0
$120,000
🖨 Deal sheet 📄 Offer letter ✓ Due diligence
Listing remarks MLS
Beautifully Renovated Large Home located in the wonderful community Westlake Mobile Home Park. 2 bedrooms, 2 baths, separate living room and family room! Don't wait! All Buyers are required to be approved by Park Management prior to completing purchase. 55+ community.
Key facts
- Gated community
- Private back yard
- Hidden closet
Tags
Property features AI
Finance
- Other: Urban lot setting; Directions: West on Ashlan from Marks; left into the community.
- HOA & community: Association fee paid monthly
Exterior
- Parking: Carport; Has carport
- Utilities: Electric service on; Public sewer; Public utilities
- Home design: Mobile home (dualwide); Park space rented
- Construction: Wood siding exterior; Composition roof; Wood subfloor foundation; Built as a mobile home (dualwide)
- Exterior features: One level; Covered, uncovered, enclosed and screened porch/patio areas; Deck; Private in-ground pool (fenced, community access); Community spa
Interior
- Kitchen: Dishwasher; Refrigerator
- Flooring: Carpet
- Bathrooms: 2 bathrooms; Shower and tub
- Heating & cooling: Central heating and cooling; Has heating; Has cooling
- Interior features: Dishwasher; Refrigerator; Carpet flooring; Inside laundry
- Laundry & utility: Laundry located inside
Neighborhood map
What this means for you Summary
Snapshot
- This is a 3-bed/2.0-bath manufactured listed at $120k.
Deal economics
- At list price, monthly cash flow is $769 ($9k/yr) — positive.
- The deal already cash-flows at list — no discount required.
- Meets the 1% rule at list price ($2k rent vs $120k).
- Recommended offer: $118k (1.5% below list) — sets the bar for market timing.
- Cap rate 14.0% vs local median 3.7% in Fresno — top-decile yield for the area; either an underpriced asset or a hidden risk that comps aren't pricing in. Stress-test before assuming the spread holds.
Location & tenants
- Location reads 62/100 on livability (#469 in CA) — a middle-class / working-renter tenant base. Strengths: commute A+, housing A+; Watch: amenities D+, employment D+, crime F.
- Fresno Unified (urban): math 18% / reading 47% proficiency, ranked #327 of 517 in CA (top 63%) — families likely to look elsewhere, expect single-tenant / working-renter base with shorter leases; 77% free/reduced lunch — lower-income household profile, screen leases tightly.
- Zoned schools: Wilson Elementary (670 students, 97% FRL); Fort Miller Middle (623 students, 98% FRL); Fresno High (math 10% / reading 38%, grade F, #934 of 1,170 statewide, top 80%, 2,092 students, 90% FRL) — zoned schools average 95% FRL vs 77% district-wide (18 pts higher); higher-poverty schools than district average — tighter screening recommended.
- Market conditions: Rents rising fast (+5.2%/yr); 96 active listings in the ZIP; 24 comparable units currently listed for rent nearby; rentals at typical pace (median 24d on market — plan ~3-4 weeks tenant-placement turnaround); 2,426 units permitted in Fresno County in 2024 (296 in 5+ unit buildings).
- This rent runs 39% of the median local income ($57k/yr) — at the standard rent-burdened threshold; future hikes will face affordability resistance.
Forward outlook
- Local home prices are declining (-3.0%/yr); year-one equity from $830 of loan paydown is wiped out by about $4k of value loss. Plan a longer hold.
- Fresno County population projected at +11% by 2050 — modest demand growth; plan on rents tracking national, not racing it.
- At projected returns (-3.0% appreciation + 5.2% rent growth), your $34k cash investment doubles in ~5 years — after that, you're playing with house money.
Negotiation context
- It's been on market 17 days — a 2% lower offer ($118k) is reasonable based on typical stale-listing flexibility.
- 4 sale attempts since 8y ago with the ask held roughly flat each time — persistent listings suggest the price (not the market) is what's stuck; bring a comps-based counter.
- Current owner paid $58k; list at $120k implies a 109% gain — meaningful room to come down on a strong offer.
Risks & watch-outs
- Climate carrying-cost: extreme-heat days projected 7→16/yr by 2055 (HVAC capex compounding) — expect insurance premiums to compound above CPI over the hold.
Questions for the listing agent
- Built in 1977 — when were the roof, HVAC, electrical panel, plumbing, and water heater last replaced?
- Is there a deadline driving the sale (1031 exchange, divorce, estate, relocation)? That informs how much negotiation room exists.
- Schools are D-rated, which usually means shorter tenancies and higher turnover. Who's the typical renter profile here, and what's been the actual vacancy rate?
- Crime grade is F in this area — have there been break-ins, vandalism, or insurance claims at this property in the last 3 years? What carrier currently insures it and at what premium?
- What's the average days-on-market for RENTAL listings here right now (not sales)? A rising rental-DOM trend means longer vacancies and softer asking-rent achievability than the comps imply.
- What's the recent tenant-quality profile in this submarket — average credit score on applications, eviction rate, late-payment / NSF rate, and stable-employment percentage? A property-management company in the area should have these aggregated.
- How much new for-sale + rental construction is in the pipeline within 1–3 miles? Heavy new supply typically softens prices + rents 12–24 months out; constrained supply supports both.
Investment metrics
- 1% rule
- 1.55% ✓
- Cap rate
- 13.99%
- Cash-on-cash
- 27.48%
- DSCR
- 2.22
- GRM
- 5.4
CMA / ARV
- ARV (on-the-fly)
- $95,040
- Comps found
- 12
Show comp detail 12 sales within ~0.75 mi
| Address | Dist | Beds/Ba | Sqft | Sold | Price | $/sf | Match |
|---|---|---|---|---|---|---|---|
| 2706 W Ashlan Ave #156 | 0.09mi | 3/2.0 | 1,440 (0%) | 0mo | $127,500 | $89 | 96 |
| 2706 W Ashlan Ave #144 | 0.00mi | 2/2.0 (-1) | 1,440 (0%) | 0mo | $136,000 | $94 | 95 |
| 2706 W Ashlan Ave #46 | 0.00mi | 2/2.0 (-1) | 1,440 (0%) | 1mo | $89,000 | $62 | 94 |
| 2706 W Ashlan Ave #266 | 0.00mi | 2/2.0 (-1) | 1,440 (0%) | 2mo | $124,900 | $87 | 93 |
| 2706 W Ashlan Ave #175 | 0.00mi | 2/2.0 (-1) | 1,436 (-0%) | 3mo | $94,900 | $66 | 92 |
| 2706 W Ashlan Ave #86 | 0.09mi | 2/2.0 (-1) | 1,440 (0%) | 4mo | $50,000 | $35 | 88 |
| 2706 W Ashlan Ave #200 | 0.17mi | 3/2.0 | 1,440 (0%) | 7mo | $53,500 | $37 | 86 |
| 2706 W Ashlan Ave #281 | 0.00mi | 2/2.0 (-1) | 1,344 (-7%) | 1mo | $89,000 | $66 | 83 |
| 2706 W Ashlan Ave #11 | 0.14mi | 2/2.0 (-1) | 1,440 (0%) | 7mo | $98,000 | $68 | 83 |
| 2706 W Ashlan Ave #158 | 0.09mi | 2/2.0 (-1) | 1,488 (+3%) | 6mo | $80,000 | $54 | 80 |
| 2706 W Ashlan Ave #299 | 0.13mi | 2/2.0 (-1) | 1,310 (-9%) | 1mo | $165,000 | $126 | 73 |
| 3138 W Dakota Ave #210 | 0.70mi | 3/2.0 | 1,344 (-7%) | 4mo | $42,500 | $32 | 52 |
Match score weights: distance 35% · size 25% · config 20% · recency 20%. Top-matched comps best support the ARV.
Projected returns pro-forma
-3.0% appreciation · 5.19% rent growth · sell at horizon
- IRR
- 23.8%
- Equity multiple
- 2.00×
- Total profit
- $33,711
- Equity at exit
- $17,892
- IRR
- 32.9%
- Equity multiple
- 4.28×
- Total profit
- $110,280
- Equity at exit
- $10,375
Cash invested: $33,600 (down + closing). Projections, not guarantees.
Landlord ↔ Tenant lean methodology
- Overall (STATE)
- 18 Strongly Tenant-Friendly
- State California
- 18 Strongly Tenant-Friendly · D+13
- County
- — inherits STATE
- City
- — inherits STATE
ZIP-level market 93705
- Rents YoY
- 5.2%
- Active inventory
- 96
- Price-to-rent
- 5.4×
Monthly cashflow live
- Estimated rent
- $1,865 high interval (Pro) →
- Mortgage (P&I)
- −$629
- Tax from tax record
- −$25 /mo · $296/yr
- Insurance
- −$50
- HOA
- −$0
- Vacancy / Maint / Mgmt
- −$392
- Net cashflow
- $769
Break-even live
UW: 25.0% down · 7.5% · 30yr · 1.5% tax · 5.0% vac · 8.0% maint · 8.0% mgmt
Financing live
Cash to close
- Down payment
- $30,000
- Closing costs
- $3,600
- Reserves months
- —
- Total cash needed
- —
Loan-product check · same deal, 3 products live
Conventional
25% down · 7.5% · 30yr
- Down + closing
- —
- Monthly P&I
- —
- Monthly cashflow
- —
- DSCR
- —
- Eligible?
- —
Personal DTI + credit; lowest rate.
DSCR
20% down · 8.5% · 30yr
- Down + closing
- —
- Monthly P&I
- —
- Monthly cashflow
- —
- DSCR
- —
- Eligible?
- —
No personal income docs; deal must DSCR.
Hard money
10% down · 12.0% · 12mo
- Down + closing
- —
- Monthly P&I
- —
- Monthly cashflow
- —
- DSCR
- —
- Eligible?
- —
Short-term bridge; refi at stabilization.
Rent comps 24 comps
| Address | Beds | Baths | Sqft | Rent | $/sqft | DOM | Units | Dist |
|---|---|---|---|---|---|---|---|---|
| 4184 N Briarwood Ave Fresno, CA | 3.0 | 2.0 | 1628 | $2,195 | $1.35 | 44d | 1 | 0.26mi |
| 3274 W Ashlan Ave Fresno, CA | 2.0 | 1.0 | 975 | $1,535 | $1.57 | 2d | 5 | 0.51mi |
| 3058 W San Gabriel Ave Fresno, CA | 3.0 | 2.0 | 1284 | $2,450 | $1.91 | 44d | 1 | 0.53mi |
| 4264 N Bengston Ave Unit 101 Fresno, CA | 2.0 | 1.0 | 950 | $1,450 | $1.53 | 44d | 1 | 0.62mi |
| 1668 W Ashlan Ave Fresno, CA | 2.0 | 1.0 | 877 | $1,185 | $1.35 | 24d | 1 | 0.64mi |
| 4144 N Valentine Ave Unit 60-147 Fresno, CA | 2.0 | 1.0 | 960 | $1,695 | $1.77 | 20d | 1 | 0.67mi |
| 4144 N Valentine Ave Unit 60-158 Fresno, CA | 2.0 | 1.0 | 960 | $1,695 | $1.77 | 24d | 1 | 0.67mi |
| 4144 N Valentine Ave Unit 84-118 Fresno, CA | 2.0 | 1.0 | 960 | $1,695 | $1.77 | 44d | 1 | 0.67mi |
| 4144 N Valentine Ave Fresno, CA | 2.0 | 1.0 | 960 | $1,450 | $1.51 | 16d | 1 | 0.67mi |
| 3818 N Cheryl Ave Fresno, CA | 4.0 | 3.0 | 1649 | $2,500 | $1.52 | 24d | 1 | 0.71mi |
| 4942 N Holt Ave #103 Fresno, CA | 2.0 | 1.0 | 1000 | $1,395 | $1.40 | 24d | 1 | 0.71mi |
| 4597 N Emerson Ave Apt 103 Fresno, CA | 2.0 | 2.0 | 1100 | $1,700 | $1.55 | 24d | 1 | 0.74mi |
| 4467 N Van Dyke Ave Fresno, CA | 3.0 | 2.0 | 1292 | $2,195 | $1.70 | 3d | 1 | 0.87mi |
| 1493 W Fairmont Ave Unit A Fresno, CA | 2.0 | 2.0 | 1050 | $1,595 | $1.52 | 24d | 1 | 0.96mi |
| 1696 W Shaw Ave Unit AVE-104 Fresno, CA | 3.0 | 2.0 | 1100 | $1,700 | $1.55 | 3d | 1 | 1.24mi |
| 3515 W San Jose Ave Unit 8106 Fresno, CA | 3.0 | 2.5 | 1215 | $1,925 | $1.58 | 24d | 1 | 1.25mi |
| 3515 W San Jose Ave Unit 15-202 Fresno, CA | 2.0 | 2.0 | 915 | $1,550 | $1.69 | 16d | 1 | 1.25mi |
| 3515 W San Jose Ave Unit 9105 Fresno, CA | 2.0 | 2.5 | 1115 | $1,725 | $1.55 | 44d | 1 | 1.25mi |
| 941 W Dakota Ave Fresno, CA | 3.0 | 2.0 | 960 | $1,895 | $1.97 | 10d | 2 | 1.26mi |
| 5066-5098 N Marty Ave Fresno, CA | 2.0 | 1.0–2.0 | 961 | $1,750 | $1.82 | 20d | 1 | 1.31mi |
| 3207 W Shields Ave Fresno, CA | 1.0–3.0 | 1.0–2.0 | 959 | $1,725 | $1.80 | 2d | 3 | 1.36mi |
| 5355 N Valentine Ave Fresno, CA | 2.0–3.0 | 1.5–2.5 | 1318 | $2,799 | $2.12 | 16d | 1 | 1.38mi |
| 3326 N West Ave Fresno, CA | 2.0 | 1.0 | 950 | $1,225 | $1.29 | 21d | 1 | 1.40mi |
| 1212 W Andrews Ave Fresno, CA | 2.0 | 1.0 | 950 | $1,300 | $1.37 | 16d | 1 | 1.43mi |
Listing history 13 events
-
2026-06-18days on market $120,000 Active 17 DOM
-
2026-06-17days on market $120,000 Active 16 DOM
-
2026-06-16days on market $120,000 Active 15 DOM
-
2026-06-15days on market $120,000 Active 14 DOM
-
2026-06-13statusdays on market $120,000 Active 12 DOM
-
2026-06-10days on market $120,000 Pending Accepting Backups 9 DOM
-
2026-06-09days on market $120,000 Pending Accepting Backups 8 DOM
-
2026-06-08days on market $120,000 Pending Accepting Backups 7 DOM
-
2026-06-07statusdays on market $120,000 Pending Accepting Backups 6 DOM
-
2026-06-05days on market $120,000 Active 3 DOM
-
2026-06-03days on market $120,000 Active 2 DOM
-
2026-06-02remarks 699-char remark
-
2026-06-02$120,000 Active 1 DOM
ⓘ Source: listings_history table (triggers on properties + properties_extension) + one-shot
backfill from property_details.listing_events for pre-trigger history.
Tax reassessment forecast CA · Resets to sale price
- Current annual tax
- $296 · $25/mo
- Projected year-2 tax
- $912 · $76/mo
- Expected delta
- +$616/yr (+$51/mo · 208.1%)
ⓘ Screening estimate from a state-policy table — verify with the county assessor before closing.
Climate risk First Street
- Flood 1/10 Low FEMA zone X (unshaded) · 0% chance over 30 yrs
- Wildfire 1/10 Low
- Heat 8/10 Severe 7 d/yr ≥105°F today · 16 d/yr by 30 yrs out
- Wind 1/10 Low
- Air quality 10/10 Extreme 48 unhealthy d/yr today · 50 by 30 yrs out
Nearby sold comps map
Loading sold comps map…
Walkable amenities ~0.75 mi
Loading nearby amenities…
Taxation est. · year 1
- Rental income
- $22,381
- − Mortgage interest
- −$6,722
- − Property taxes
- −$296
- − Insurance
- −$600
- − Repairs & maintenance
- −$1,790
- − Management
- −$1,790
- − Depreciation
- −$3,491
- Taxable income
- $7,691
- Est. tax owed @ 24.0%
- −$1,846
- After-tax cash flow
- $7,387/yr
For passive investors: Depreciation is non-cash, so a rental often shows a tax loss while cash-flowing — sheltering income. Rental losses are passive: they offset passive income freely, and up to $25,000/yr can offset ordinary (W-2) income if you actively participate and your MAGI is under $100k (phasing out to $0 by $150k); unused losses carry forward. On sale, claimed depreciation is recaptured at up to 25%, and gains may owe capital-gains tax (a 1031 exchange can defer both). Figures are a year-1 estimate at your 24.0% rate — not tax advice; consult a CPA.
Schools (NCES district)
- District
- Fresno Unified
- NCES district ID
- 0614550
- Math proficiency
- 18% ▼ -12.00%
- Reading proficiency
- 47% ▲ 9.00%
- Median HH income
- $36,095
- Composite
- 26.83/100
- National rank
- #7111
- State rank
- #327 of 517 in CA
Livability — Fresno
- Score
- 62/100
- State rank
- #469
- US rank
- #15907
Category grades
Schools grade is shown separately in the Schools card above.
Census & demographics
- Census place
- Fresno, CA
- County
- Fresno County · 834,801 people
- City population
- 593,114
- Metro
- Fresno, CA
- Population (ZIP)
- 38,888
- Household income
- $57,003
- Rent vs Own
- Severe rent burden
- 2217.0
Population outlook (Fresno County) Hauer SSP2
- Today (2025)
- 1,042,971 people
- By 2030
- 1,072,198 · +2.8%
- By 2040
- 1,122,408 · +7.6%
- By 2050
- 1,157,251 · +11.0%
- By 2075
- 1,182,575 · +13.4%
- By 2100
- 1,105,899 · +6.0%
Race, ethnicity, and origin ACS 2023
- Neighborhood character
- Diverse neighborhood (Simpson 0.56)
- Race & ethnicity
- Hispanic / Latino 62% Two or more races 34% White 22% Black 6% Asian 6% Native American 2%
- Hispanic origin (detail)
- Mexican 60%
- Common ancestry
- Lithuanian 1% Iranian 1% Russian 1%
- Foreign-born
- 13% · Canada, China
- Languages at home
- 61% English-only · Spanish 34% Other Asian/Pacific 2% Other Indo-European 1%
Political lean MEDSL · Fresno
- 2024 margin
- Toss-up / Even · D 46.5% · R 50.9% · Other 2.6%
- 2008→2024 swing
- -6.5pp toward R · 2008: 2.1pp · 2024: -4.4pp
- All cycles
- 2024: R+4.4 2020: D+7.8 2016: D+3.9 2012: R+2.9 2008: D+2.1
Not yet ingested
- Civics
- —
Market trends
- HPI YoY
- ▼ -331.23%
- Current HPI
- 399.0061
- Rent YoY
- ▲ 5.19%
- Metro
- Fresno, CA
- State GDP YoY
- ▲ 3.21%
- F500 in state
- 116
Industry mix (Fortune 500 HQ in CA)
| Industry | F500 HQs | Revenue |
|---|---|---|
| Technology | 27 | $1,492B |
|
||
| Financial Services | 3 | $174B |
|
||
| Retail | 3 | $44B |
|
||
| Insurance | 3 | $26B |
|
||
| Media / Entertainment | 2 | $115B |
|
||
| Pharmaceuticals / Biotech | 2 | $62B |
|
||
Price history
+837.5% since first listed11 events — show timeline
- 2026-06-01 Listed $120,000 FRESNOMLS
- 2019-05-07 Sold (MLS) $57,500 FRESNOMLS
- 2019-04-25 Pending — FRESNOMLS
- 2019-04-09 Relisted — FRESNOMLS
- 2019-03-11 Pending — FRESNOMLS
- 2019-02-15 Price Changed $57,500 FRESNOMLS
- 2019-01-17 Listed $62,500 FRESNOMLS
- 2018-11-29 Sold (MLS) $12,800 FRESNOMLS
- 2018-10-27 Pending — FRESNOMLS
- 2018-10-27 Pending — FRESNOMLS
- 2018-10-19 Listed $12,800 FRESNOMLS
Cash-flow waterfall
monthlySold comps — $/sqft
last 12 mo · ≤1 miLoading sold comps…