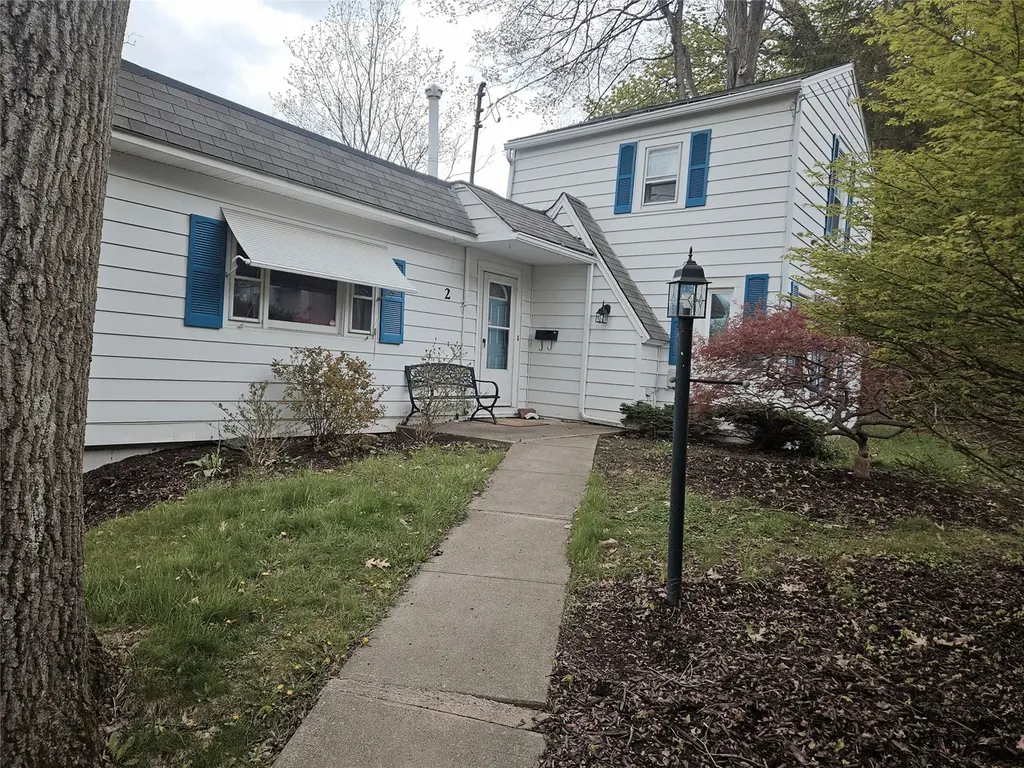
2 Payne Way · Binghamton, NY
Flood risk 8/10 · Major
- FEMA flood zone
- X
- Chance of flooding over 30 yrs
- 0.99%
- Est. flood insurance / yr
- $473 – $860
Fire risk 1/10 · Minimal
- Est. fire insurance / yr
- $691 – $1,283
Heat risk 3/10 · Minor
- Hot days now (above 92°F)
- 7 days/yr
- Hot days in 30 yrs
- 16 days/yr
Wind risk 2/10 · Minimal
- Chance of severe wind over 30 yrs
- 2.0%
Air-quality risk 2/10 · Minimal
- Unhealthy air days now
- 0 days/yr
- Unhealthy air days in 30 yrs
- 1 days/yr
Risk factors via First Street. Map © Google.
Why this score? — see what drove the D grade
The composite is a weighted blend of 9 inputs, each scored 0–100. Each bar is that input's sub-score; the figure is the points it added to the 100-point composite (weight × sub-score).
- ARV discount +10.1/15.0
- Appreciation +10.0/10.0
- Cash flow +6.3/30.0
- 1% rule +4.4/10.0
- Livability +3.9/5.0
- Schools +3.0/10.0
- Rent growth +2.5/5.0
- Condition / age +2.5/5.0
- DSCR +0.6/10.0
$119,999
🖨 Deal sheet 📄 Offer letter ✓ Due diligence
Listing remarks
Welcome to 2 Payne Way, tucked back in behind Ben Franklin school it is surrounded by Dead End roads. The perfect place to walk and have privacy. A short walk to Pierce Creek or the playground at Ben Franklin. This 3-bedroom 1 bath home needs a little TLC but will make a great home. A radon mitigation system, new windows and a new roof were installed in 2010. First floor bedroom and wood burning fireplace in the living room.
Key facts
- New roof
- New windows
- 5,135 sq ft lot
Tags
Property features AI
Exterior
- Parking: Attached garage (1 car); Carport (1 car)
- Utilities: Public water; Public sewer; Cable available
- Home design: Single-family residence; Two levels / 2 stories
- Construction: Aluminum siding
- Exterior features: Covered patio; Level lot
Interior
- Kitchen: Range; Free-standing range; Dishwasher; Refrigerator
- Flooring: Carpet; Laminate; Vinyl
- Bathrooms: 1 full bathroom
- Heating & cooling: Forced air heating; Ceiling fan(s)
- Interior features: Living room wood-burning fireplace; Partial walk-out basement
- Laundry & utility: Washer; Dryer; Washer hookup; Gas dryer hookup; Gas water heater
Neighborhood map
What this means for you Summary
Snapshot
- This is a 1-bed/1.0-bath single-family listed at $120k.
Deal economics
- At list price, monthly cash flow is $-267 ($-3k/yr) — negative.
- To cash-flow at today's rent, offer at most $101k (15.5% below list).
- To meet the 1% rule (rent ≥ 1% of price), the offer needs to be $113k (6.1% below list).
- Recommended offer: $101k (15.5% below list) — sets the bar for cash-flow.
- Cap rate 4.2% vs local median 6.4% in Binghamton — below-typical yield; the buyer is paying a premium for something (appreciation thesis, condition, location) that the cap rate doesn't capture.
Location & tenants
- Location reads 78/100 on livability (#174 in NY, #2,710 nationally) — a middle-class / working-renter tenant base. Strengths: amenities A+, commute A+, cost of living A+; Watch: crime F, employment F.
- Binghamton City School District (urban): math 30% / reading 44% proficiency, ranked #557 of 590 in NY (top 94%) — families likely to look elsewhere, expect single-tenant / working-renter base with shorter leases; 61% free/reduced lunch — lower-income household profile, screen leases tightly.
- Zoned schools: Benjamin Franklin Elementary School (math 17% / reading 32%, grade F, #1,846 of 2,108 statewide, top 91%, 399 students, 75% FRL).
- Zoned-school proficiency averages 24% at this address vs 37% district-wide (-12 pts) — the specific schools serving this property underperform the Binghamton City School District average; the district grade overstates school quality for this exact location.
- Market conditions: 112 active listings in the ZIP; 14 comparable units currently listed for rent nearby; rentals lingering (median 44d on market — plan ~5-8 weeks vacancy on turnover, expect pricing pressure); 57% of comp listings sitting > 30 days — soft ceiling on asking rent; 340 units permitted in Broome County in 2024 (269 in 5+ unit buildings).
Forward outlook
- In year one you build about $13k of equity ($829 loan paydown + $12k appreciation (10.0% local appreciation)).
- Broome County population projected at -13% by 2050 — secular population decline; favor cash flow + early exit over multi-decade hold.
- By year 3, paydown + projected appreciation supports a ~$32k cash-out refi (75% LTV) — recoverable capital for the next deal without selling this one.
Negotiation context
- Only 8 days on market — expect competitive offers; lowballing is unlikely to land.
- Current owner paid $63k; list at $120k implies a 91% gain — meaningful room to come down on a strong offer.
Risks & watch-outs
- Watch-outs: property tax is 4.2% of price; flood insurance adds $56/mo; built in 1900 — expect roof / HVAC / electrical / plumbing capex.
- Climate carrying-cost: severe flood risk — expect insurance premiums to compound above CPI over the hold.
Questions for the listing agent
- What do current leases actually rent for vs. the listed asking? Can we see a recent rent roll and the last 12 months of T-12 income?
- Built in 1900 — when were the roof, HVAC, electrical panel, plumbing, and water heater last replaced?
- Property tax is high relative to price — has the assessment been appealed recently, and will the sale trigger a re-assessment?
- What's the actual annual flood-insurance premium (NFIP or private), and is the property in a SFHA with mandatory coverage?
- Is there a deadline driving the sale (1031 exchange, divorce, estate, relocation)? That informs how much negotiation room exists.
- Schools are D-rated, which usually means shorter tenancies and higher turnover. Who's the typical renter profile here, and what's been the actual vacancy rate?
- Crime grade is F in this area — have there been break-ins, vandalism, or insurance claims at this property in the last 3 years? What carrier currently insures it and at what premium?
- The area grade is low — what's the realistic commute time and amenity access for the typical tenant pool here? Any planned neighborhood developments (good or bad) we should know about?
- What's the average days-on-market for RENTAL listings here right now (not sales)? A rising rental-DOM trend means longer vacancies and softer asking-rent achievability than the comps imply.
- What's the recent tenant-quality profile in this submarket — average credit score on applications, eviction rate, late-payment / NSF rate, and stable-employment percentage? A property-management company in the area should have these aggregated.
- How much new for-sale + rental construction is in the pipeline within 1–3 miles? Heavy new supply typically softens prices + rents 12–24 months out; constrained supply supports both.
Investment metrics
- 1% rule
- 0.94% ✗
- Cap rate
- 4.18%
- Cash-on-cash
- -7.56%
- DSCR
- 0.66
- GRM
- 8.9
CMA / ARV
- ARV (median comp)
- $127,285
- List price
- $119,999
- Delta
- -5.72%
- Verdict
- FAIR
- Comps
- 20 within 1.0 mi
Show comp detail 6 sales within ~0.75 mi
| Address | Dist | Beds/Ba | Sqft | Sold | Price | $/sf | Match |
|---|---|---|---|---|---|---|---|
| 54 Second St | 0.23mi | 2/1.0 (+1) | 900 (-13%) | 12mo | $83,000 | $92 | 52 |
| 5 Espial Dr | 0.18mi | 2/1.0 (+1) | 924 (-11%) | 22mo | $110,000 | $119 | 50 |
| 36 Hall St | 0.44mi | 2/1.0 (+1) | 1,160 (+12%) | 6mo | $95,000 | $82 | 49 |
| 42 Telegraph St | 0.67mi | 2/1.0 (+1) | 996 (-4%) | 19mo | $49,000 | $49 | 41 |
| 22 Belden St | 0.47mi | 2/1.0 (+1) | 948 (-9%) | 23mo | $110,000 | $116 | 40 |
| 2319 Seneca St | 0.75mi | 2/1.0 (+1) | 916 (-12%) | 22mo | $128,800 | $141 | 22 |
Match score weights: distance 35% · size 25% · config 20% · recency 20%. Top-matched comps best support the ARV.
Projected returns pro-forma
10.0% appreciation · 3.0% rent growth · sell at horizon
- IRR
- 17.6%
- Equity multiple
- 2.45×
- Total profit
- $48,557
- Equity at exit
- $108,105
- IRR
- 16.6%
- Equity multiple
- 5.67×
- Total profit
- $156,808
- Equity at exit
- $233,132
Cash invested: $33,600 (down + closing). Projections, not guarantees.
Landlord ↔ Tenant lean methodology
- Overall (STATE)
- 15 Strongly Tenant-Friendly
- State New York
- 15 Strongly Tenant-Friendly · D+10
- County
- — inherits STATE
- City
- — inherits STATE
ZIP-level market 13903
- Home prices YoY
- 4.3%
- Active inventory
- 112
- Price-to-rent
- 8.9×
Monthly cashflow live
- Estimated rent
- $1,127 high interval (Pro) →
- Mortgage (P&I)
- −$629
- Tax from tax record
- −$423 /mo · $5,071/yr
- Insurance
- −$50
- Flood insurance flood zone
- −$56 /mo · $666/yr
- HOA
- −$0
- Vacancy / Maint / Mgmt
- −$237
- Net cashflow
- $-267
Break-even live
UW: 25.0% down · 7.5% · 30yr · 1.5% tax · 5.0% vac · 8.0% maint · 8.0% mgmt
Financing live
Cash to close
- Down payment
- $30,000
- Closing costs
- $3,600
- Reserves months
- —
- Total cash needed
- —
Loan-product check · same deal, 3 products live
Conventional
25% down · 7.5% · 30yr
- Down + closing
- —
- Monthly P&I
- —
- Monthly cashflow
- —
- DSCR
- —
- Eligible?
- —
Personal DTI + credit; lowest rate.
DSCR
20% down · 8.5% · 30yr
- Down + closing
- —
- Monthly P&I
- —
- Monthly cashflow
- —
- DSCR
- —
- Eligible?
- —
No personal income docs; deal must DSCR.
Hard money
10% down · 12.0% · 12mo
- Down + closing
- —
- Monthly P&I
- —
- Monthly cashflow
- —
- DSCR
- —
- Eligible?
- —
Short-term bridge; refi at stabilization.
Rent comps 14 comps
| Address | Beds | Baths | Sqft | Rent | $/sqft | DOM | Units | Dist |
|---|---|---|---|---|---|---|---|---|
| 27 Tompkins St Unit 10 Binghamton, NY | 2.0 | 1.0 | 950 | $1,050 | $1.11 | 20d | 1 | 0.59mi |
| 27 Tompkins St Unit 9 Binghamton, NY | 2.0 | 1.0 | 950 | $950 | $1.00 | 43d | 1 | 0.59mi |
| 38 Carroll St Unit 21 Binghamton, NY | 1.0 | 1.0 | 800 | $1,050 | $1.31 | 43d | 1 | 0.94mi |
| 33 Fayette St Unit 22 Binghamton, NY | 2.0 | 1.0 | 1350 | $1,100 | $0.81 | 13d | 1 | 0.96mi |
| 198 Court St Unit 10 Binghamton, NY | 2.0 | 1.0 | 700 | $1,200 | $1.71 | 20d | 1 | 0.99mi |
| 198 Court St Unit 6 Binghamton, NY | 2.0 | 1.0 | 700 | $1,350 | $1.93 | 20d | 1 | 0.99mi |
| 71 Mary St Unit 2 Binghamton, NY | 2.0 | 1.0 | 1100 | $1,300 | $1.18 | 13d | 1 | 1.19mi |
| 26 Doubleday St #2 Binghamton, NY | 2.0 | 1.0 | 850 | $1,400 | $1.65 | 44d | 1 | 1.22mi |
| 26 Doubleday St Binghamton, NY | 2.0 | 1.0 | 1000 | $1,350 | $1.35 | 43d | 1 | 1.22mi |
| 80 State St Unit A 6 Loft Binghamton, NY | 1.0 | 1.0 | 800 | $1,200 | $1.50 | 43d | 1 | 1.26mi |
| 274 Chenango St Unit 1 Binghamton, NY | 1.0 | 1.0 | 850 | $1,200 | $1.41 | 43d | 1 | 1.29mi |
| 81 State St Unit 2 Binghamton, NY | 2.0 | 2.0 | 800 | $1,000 | $1.25 | 43d | 1 | 1.29mi |
| 159 Washington St Binghamton, NY | 1.0 | 1.0 | 725 | $1,372 | $1.89 | 43d | 4 | 1.35mi |
| 147 E Frederick St Binghamton, NY | 2.0 | 1.0 | 800 | $1,200 | $1.50 | 13d | 1 | 1.35mi |
Listing history 3 events
-
2026-05-14status Pending 428-char remark
-
2026-05-06$119,999 Active 428-char remark
-
2010-06-25soldstatus $62,765
ⓘ Source: listings_history table (triggers on properties + properties_extension) + one-shot
backfill from property_details.listing_events for pre-trigger history.
Tax reassessment forecast NY · Partial reset (capped growth)
- Current annual tax
- $5,071 · $423/mo
- Projected year-2 tax
- $5,071 · $423/mo
- Expected delta
- $0/yr ($0/mo · 0.0%)
ⓘ Screening estimate from a state-policy table — verify with the county assessor before closing.
Climate risk First Street
- Flood 8/10 Severe FEMA zone X · 99% chance over 30 yrs
- Wildfire 1/10 Low
- Heat 3/10 Moderate 7 d/yr ≥92°F today · 16 d/yr by 30 yrs out
- Wind 2/10 Low 2% chance of damaging wind over 30 yrs
- Air quality 2/10 Low 0 unhealthy d/yr today · 1 by 30 yrs out
Nearby sold comps map
Loading sold comps map…
Walkable amenities ~0.75 mi
Loading nearby amenities…
Taxation est. · year 1
- Rental income
- $13,522
- − Mortgage interest
- −$6,722
- − Property taxes
- −$5,071
- − Insurance
- −$1,266
- − Repairs & maintenance
- −$1,082
- − Management
- −$1,082
- − Depreciation
- −$3,491
- Taxable loss
- −$5,191
- Est. tax savings @ 24.0%
- +$1,246
- After-tax cash flow
- $-1,960/yr
For passive investors: Depreciation is non-cash, so a rental often shows a tax loss while cash-flowing — sheltering income. Rental losses are passive: they offset passive income freely, and up to $25,000/yr can offset ordinary (W-2) income if you actively participate and your MAGI is under $100k (phasing out to $0 by $150k); unused losses carry forward. On sale, claimed depreciation is recaptured at up to 25%, and gains may owe capital-gains tax (a 1031 exchange can defer both). Figures are a year-1 estimate at your 24.0% rate — not tax advice; consult a CPA.
Schools (NCES district)
- District
- Binghamton City School District
- NCES district ID
- 3604870
- Math proficiency
- 30% ▬ 0.00%
- Reading proficiency
- 44% ▲ 15.00%
- Median HH income
- $30,475
- Composite
- 30.09/100
- National rank
- #6342
- State rank
- #557 of 590 in NY
Livability — Binghamton
- Score
- 78/100
- State rank
- #174
- US rank
- #2710
Category grades
Schools grade is shown separately in the Schools card above.
Census & demographics
- Census place
- Binghamton, NY
- County
- Broome County · 126,805 people
- City population
- 65,170
- Metro
- Binghamton, NY
- Population (ZIP)
- 17,569
- Household income
- $66,278
- Rent vs Own
- Severe rent burden
- 602.0
Population outlook (Broome County) Hauer SSP2
- Today (2025)
- 187,989 people
- By 2030
- 183,066 · -2.6%
- By 2040
- 172,228 · -8.4%
- By 2050
- 163,161 · -13.2%
- By 2075
- 153,641 · -18.3%
- By 2100
- 140,851 · -25.1%
Race, ethnicity, and origin ACS 2023
- Neighborhood character
- Predominantly White (80%)
- Race & ethnicity
- White 80% Black 9% Two or more races 6% Hispanic / Latino 4% Asian 1%
- Common ancestry
- Romanian 6% Slovak 2% Scotch-Irish 2%
- Foreign-born
- 5% · Canada
- Languages at home
- 94% English-only · Spanish 2% Other Indo-European 1% Arabic 1%
Political lean MEDSL · Broome
- 2024 margin
- Toss-up / Even · D 50.2% · R 49.8%
- 2008→2024 swing
- -7.6pp toward R · 2008: 8.0pp · 2024: 0.4pp
- All cycles
- 2024: D+0.4 2020: D+3.5 2016: R+3.7 2012: D+4.6 2008: D+8.0
Not yet ingested
- Civics
- —
Market trends
- HPI YoY
- ▲ 11.68%
- Current HPI
- 286.1001
- Rent YoY
- —
- Metro
- Binghamton, NY
- State GDP YoY
- ▲ 2.60%
- F500 in state
- 92
Industry mix (Fortune 500 HQ in NY)
| Industry | F500 HQs | Revenue |
|---|---|---|
| Financial Services | 10 | $950B |
|
||
| Consumer Goods | 9 | $162B |
|
||
| Insurance | 4 | $225B |
|
||
| Telecommunications | 2 | $144B |
|
||
| Pharmaceuticals | 2 | $112B |
|
||
| Media / Entertainment | 2 | $69B |
|
||
Price history
+91.2% since first listed3 events — show timeline
- 2026-05-14 Pending — GBAOR
- 2026-05-06 Listed $119,999 GBAOR
- 2010-06-25 Sold (Public Records) $62,765 Public Records
Property tax history
+6.8%/yrLatest (2025): $5,071 · +0.9% YoY. Source: county tax records.
Cash-flow waterfall
monthlySold comps — $/sqft
last 12 mo · ≤1 miLoading sold comps…