 Duplex
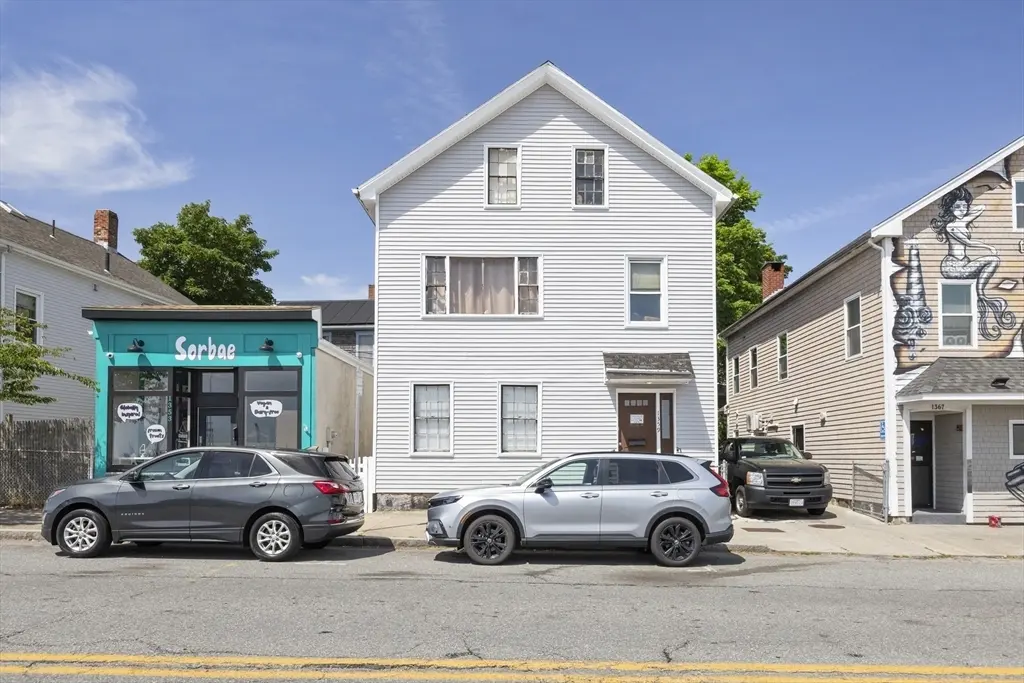
1359 Purchase St · New Bedford, MA
Flood risk 1/10 · Minimal
- FEMA flood zone
- X (unshaded)
- Chance of flooding over 30 yrs
- 0.0%
- Est. flood insurance / yr
- $473 – $860
Fire risk 1/10 · Minimal
- Est. fire insurance / yr
- $915 – $1,699
Heat risk 5/10 · Moderate
- Hot days now (above 94°F)
- 7 days/yr
- Hot days in 30 yrs
- 16 days/yr
Wind risk 8/10 · Major
- Chance of severe wind over 30 yrs
- 80.0%
Air-quality risk 2/10 · Minimal
- Unhealthy air days now
- 1 days/yr
- Unhealthy air days in 30 yrs
- 2 days/yr
Risk factors via First Street. Map © Google.
Why this score? — see what drove the C- grade
The composite is a weighted blend of 9 inputs, each scored 0–100. Each bar is that input's sub-score; the figure is the points it added to the 100-point composite (weight × sub-score).
- Cash flow +20.0/30.0
- ARV discount +7.5/15.0
- DSCR +6.3/10.0
- Rent growth +5.0/5.0
- 1% rule +4.4/10.0
- Livability +3.4/5.0
- Condition / age +2.5/5.0
- Schools +1.9/10.0
- Appreciation +0.0/10.0
$399,900
🖨 Deal sheet 📄 Offer letter ✓ Due diligence
Multi-family units
County records classify this as Multi-Family (2-4 Unit). Listing-text estimate: 2 units. confirmed
Listing remarks MLS
LARGE 2 FAMILY, SECOND FLOOR COTTAGE SET-UP, COULD BE 5 BEDROOMS, VIEW OF WATER, NEW KITCHEN ON SECOND FLOOR.
Key facts
- Create 3 units
- Vinyl-sided
- Walkup attic
Tags
Property features AI
Finance
- HOA & community: Community amenities nearby: public transportation, shopping, pool, tennis courts, park, walk/jog trails, golf, medical facility, laundromat, bike path, conservation area, highway access, house of worship, private and public schools, T-Station
Exterior
- Parking: 2 open parking spaces (2 total parking spaces)
- Utilities: Public water; Public sewer
- Home design: Multi-family property; 2 stories
- Construction: Frame construction; Shingle roof; Concrete perimeter foundation; Built (approximate year per public records)
- Exterior features: Wood deck; Level lot; Paved, public road frontage on a publicly maintained road
Interior
- Flooring: Wood flooring; Carpet flooring
- Bathrooms: 2 full bathrooms
- Interior features: Total of 8 rooms; Full, unfinished basement
Neighborhood map
What this means for you Summary
Snapshot
- This is a 2 × 2-bed/1.0-bath units multifamily listed at $400k.
Deal economics
- At list price, monthly cash flow is $487 ($6k/yr) — positive. Per door: $244/mo.
- The deal already cash-flows at list — no discount required.
- To meet the 1% rule (rent ≥ 1% of price), the offer needs to be $377k (5.7% below list).
- Recommended offer: $377k (5.7% below list) — sets the bar for 1% rule.
- Cap rate 7.8% vs local median 3.8% in New Bedford — top-decile yield for the area; either an underpriced asset or a hidden risk that comps aren't pricing in. Stress-test before assuming the spread holds.
Location & tenants
- Location reads 67/100 on livability (#155 in MA) — a middle-class / working-renter tenant base. Strengths: health & safety A+, housing B+; Watch: cost of living C-, schools D, employment D.
- New Bedford (suburban): math 17% / reading 28% proficiency, ranked #287 of 302 in MA (top 95%) — low school quality limits family demand, transient renter base, plan for 1-2y turnover; 65% free/reduced lunch — lower-income household profile, screen leases tightly.
- Market conditions: Rents rising fast (+10.8%/yr); 60 active listings in the ZIP; 5 comparable units currently listed for rent nearby; rentals lingering (median 44d on market — plan ~5-8 weeks vacancy on turnover, expect pricing pressure); 60% of comp listings sitting > 30 days — soft ceiling on asking rent; 760 units permitted in Bristol County in 2024 (142 in 5+ unit buildings).
- At $3,771/mo this rent would consume 82% of the median local household income ($55k/yr) (locally 2883% of renters already pay >50% of income on rent) — very limited rent-growth headroom before tenants either downsize or default.
Forward outlook
- Local home prices are declining (-3.0%/yr); year-one equity from $3k of loan paydown is wiped out by about $12k of value loss. Plan a longer hold.
- Bristol County population projected to shrink 3% by 2050 — rents likely to lag national; underwrite the cash flow, not the appreciation.
- At projected returns (-3.0% appreciation + 8.0% rent growth), your $112k cash investment doubles in ~10 years — after that, you're playing with house money.
Negotiation context
- Only 10 days on market — expect competitive offers; lowballing is unlikely to land.
- 2 sale attempts since 26y ago with the ask held roughly flat each time — persistent listings suggest the price (not the market) is what's stuck; bring a comps-based counter.
- Current owner paid $65k; list at $400k implies a 515% gain — meaningful room to come down on a strong offer.
Risks & watch-outs
- Watch-outs: built in 1870 — expect roof / HVAC / electrical / plumbing capex.
- Climate carrying-cost: severe wind risk, 80% chance of damaging wind over 30y; extreme-heat days projected 7→16/yr by 2055 (HVAC capex compounding) — expect insurance premiums to compound above CPI over the hold.
Questions for the listing agent
- Can we see the unit-by-unit rent roll, current vacancy, and any below-market leases? What's the average tenancy length?
- What capital expenditures (roof, boiler, parking lot, exteriors) have been made in the last 5 years, and what's planned in the next 2?
- Built in 1870 — when were the roof, HVAC, electrical panel, plumbing, and water heater last replaced?
- Is there a deadline driving the sale (1031 exchange, divorce, estate, relocation)? That informs how much negotiation room exists.
- Schools are D-rated, which usually means shorter tenancies and higher turnover. Who's the typical renter profile here, and what's been the actual vacancy rate?
- What's the average days-on-market for RENTAL listings here right now (not sales)? A rising rental-DOM trend means longer vacancies and softer asking-rent achievability than the comps imply.
- What's the recent tenant-quality profile in this submarket — average credit score on applications, eviction rate, late-payment / NSF rate, and stable-employment percentage? A property-management company in the area should have these aggregated.
- How much new apartment / multifamily construction is in the pipeline within 1–3 miles? Heavy new supply (>2% of stock underway) typically softens rents 12–24 months out; light construction supports rent growth.
Investment metrics
- 1% rule
- 0.94% ✗
- Cap rate
- 7.75%
- Cash-on-cash
- 5.22%
- DSCR
- 1.23
- GRM
- 8.8
CMA / ARV
No comps found within radius.
Projected returns pro-forma
-3.0% appreciation · 8.0% rent growth · sell at horizon
- IRR
- -3.2%
- Equity multiple
- 0.88×
- Total profit
- $-13,959
- Equity at exit
- $59,626
- IRR
- 11.1%
- Equity multiple
- 2.05×
- Total profit
- $118,050
- Equity at exit
- $34,576
Cash invested: $111,972 (down + closing). Projections, not guarantees.
Landlord ↔ Tenant lean methodology
- Overall (STATE)
- 20 Strongly Tenant-Friendly
- State Massachusetts
- 20 Strongly Tenant-Friendly · D+15
- County
- — inherits STATE
- City
- — inherits STATE
ZIP-level market 02740
- Rents YoY
- 10.8%
- Active inventory
- 60
- Price-to-rent
- 17.7×
Monthly cashflow live
- Estimated rent
- $3,771 high interval (Pro) →
- Mortgage (P&I)
- −$2,097
- Tax from tax record
- −$228 /mo · $2,739/yr
- Insurance
- −$167
- HOA
- −$0
- Vacancy / Maint / Mgmt
- −$792
- Net cashflow
- $487
Break-even live
2-unit breakdown (identical units grouped — click to expand)
| Units | Beds | Baths | Est. rent |
|---|---|---|---|
| 2× units | 2 | 1 | $3,770 |
| #1 | 2 | 1 | $1,885 |
| #2 | 2 | 1 | $1,885 |
| Total (2 units) | $3,771 | ||
UW: 25.0% down · 7.5% · 30yr · 1.5% tax · 5.0% vac · 8.0% maint · 8.0% mgmt
Financing live
Cash to close
- Down payment
- $99,975
- Closing costs
- $11,997
- Reserves months
- —
- Total cash needed
- —
Loan-product check · same deal, 3 products live
Conventional
25% down · 7.5% · 30yr
- Down + closing
- —
- Monthly P&I
- —
- Monthly cashflow
- —
- DSCR
- —
- Eligible?
- —
Personal DTI + credit; lowest rate.
DSCR
20% down · 8.5% · 30yr
- Down + closing
- —
- Monthly P&I
- —
- Monthly cashflow
- —
- DSCR
- —
- Eligible?
- —
No personal income docs; deal must DSCR.
Hard money
10% down · 12.0% · 12mo
- Down + closing
- —
- Monthly P&I
- —
- Monthly cashflow
- —
- DSCR
- —
- Eligible?
- —
Short-term bridge; refi at stabilization.
Rent comps 5 comps
| Address | Beds | Baths | Sqft | Rent | $/sqft | DOM | Units | Dist |
|---|---|---|---|---|---|---|---|---|
| 475 Cottage St New Bedford, MA | 3.0 | 1.0 | 1400 | $1,875 | $1.34 | 43d | 1 | 0.37mi |
| 75 Wamsutta St New Bedford, MA | 1.0–3.0 | 1.0–2.0 | 1550 | $2,435 | $1.57 | 1d | 7 | 0.46mi |
| 12 Market St Unit 5 New Bedford, MA | 2.0 | 2.5 | 1910 | $2,750 | $1.44 | 43d | 1 | 0.65mi |
| 109 Reynolds St New Bedford, MA | 3.0 | 1.0 | 1600 | $1,700 | $1.06 | 43d | 1 | 0.75mi |
| 107 Ash St Unit 1 New Bedford, MA | 3.0 | 1.0 | 1400 | $2,500 | $1.79 | 11d | 1 | 1.02mi |
Listing history 7 events
-
2026-06-18days on market $399,900 Active 10 DOM
-
2026-06-17days on market $399,900 Active 9 DOM
-
2026-06-16days on market $399,900 Active 8 DOM
-
2026-06-15days on market $399,900 Active 7 DOM
-
2026-06-13statusdays on market $399,900 Active 5 DOM
-
2026-06-08remarks 661-char remark
-
2026-06-08$399,900 New 1 DOM
ⓘ Source: listings_history table (triggers on properties + properties_extension) + one-shot
backfill from property_details.listing_events for pre-trigger history.
Tax reassessment forecast MA · Partial reset (capped growth)
- Current annual tax
- $2,739 · $228/mo
- Projected year-2 tax
- $3,829 · $319/mo
- Expected delta
- +$1,090/yr (+$91/mo · 39.8%)
ⓘ Screening estimate from a state-policy table — verify with the county assessor before closing.
Climate risk First Street
- Flood 1/10 Low FEMA zone X (unshaded) · 0% chance over 30 yrs
- Wildfire 1/10 Low
- Heat 5/10 Major 7 d/yr ≥94°F today · 16 d/yr by 30 yrs out
- Wind 8/10 Severe 80% chance of damaging wind over 30 yrs
- Air quality 2/10 Low 1 unhealthy d/yr today · 2 by 30 yrs out
Nearby sold comps map
Loading sold comps map…
Walkable amenities ~0.75 mi
Loading nearby amenities…
Taxation est. · year 1
- Rental income
- $45,252
- − Mortgage interest
- −$22,401
- − Property taxes
- −$2,739
- − Insurance
- −$2,000
- − Repairs & maintenance
- −$3,620
- − Management
- −$3,620
- − Depreciation
- −$11,633
- Taxable loss
- −$761
- Est. tax savings @ 24.0%
- +$183
- After-tax cash flow
- $6,028/yr
For passive investors: Depreciation is non-cash, so a rental often shows a tax loss while cash-flowing — sheltering income. Rental losses are passive: they offset passive income freely, and up to $25,000/yr can offset ordinary (W-2) income if you actively participate and your MAGI is under $100k (phasing out to $0 by $150k); unused losses carry forward. On sale, claimed depreciation is recaptured at up to 25%, and gains may owe capital-gains tax (a 1031 exchange can defer both). Figures are a year-1 estimate at your 24.0% rate — not tax advice; consult a CPA.
Schools (NCES district)
- District
- New Bedford
- NCES district ID
- 2508430
- Math proficiency
- 17% ▼ -14.00%
- Reading proficiency
- 28% ▼ -6.00%
- Median HH income
- $37,901
- Composite
- 18.79/100
- National rank
- #8869
- State rank
- #287 of 302 in MA
Livability — New Bedford
- Score
- 67/100
- State rank
- #155
- US rank
- #10150
Category grades
Schools grade is shown separately in the Schools card above.
Census & demographics
- Census place
- New Bedford, MA
- County
- Bristol County · 342,083 people
- City population
- 76,528
- Metro
- Providence-Warwick, RI-MA
- Population (ZIP)
- 46,281
- Household income
- $55,237
- Rent vs Own
- Severe rent burden
- 2883.0
Population outlook (Bristol County) Hauer SSP2
- Today (2025)
- 570,212 people
- By 2030
- 571,181 · +0.2%
- By 2040
- 565,389 · -0.8%
- By 2050
- 552,141 · -3.2%
- By 2075
- 520,923 · -8.6%
- By 2100
- 474,363 · -16.8%
Race, ethnicity, and origin ACS 2023
- Neighborhood character
- Diverse neighborhood (Simpson 0.67)
- Race & ethnicity
- White 52% Hispanic / Latino 23% Two or more races 17% Black 8% Asian 2% Native American 1%
- Hispanic origin (detail)
- Puerto Rican 14% Dominican 2%
- Common ancestry
- Russian 27% Lithuanian 5% Romanian 2%
- Foreign-born
- 19% · Canada, China
- Languages at home
- 65% English-only · Other Indo-European 15% Spanish 15% French/Haitian/Cajun 3%
Political lean MEDSL · Bristol
- 2024 margin
- Toss-up / Even · D 49.8% · R 48.5% · Other 1.8%
- 2008→2024 swing
- -21.9pp toward R · 2008: 23.2pp · 2024: 1.3pp
- All cycles
- 2024: D+1.3 2020: D+12.0 2016: D+9.3 2012: D+20.5 2008: D+23.2
Not yet ingested
- Civics
- —
Market trends
- HPI YoY
- ▼ -270.36%
- Current HPI
- 388.4115
- Rent YoY
- ▲ 10.79%
- Metro
- Providence-Warwick, RI-MA
- State GDP YoY
- ▲ 2.28%
- F500 in state
- 38
Industry mix (Fortune 500 HQ in MA)
| Industry | F500 HQs | Revenue |
|---|---|---|
| Technology | 3 | $17B |
|
||
| Insurance | 2 | $84B |
|
||
| Retail | 2 | $76B |
|
||
| Life Sciences | 1 | $43B |
|
||
| Energy Technology | 1 | $31B |
|
||
| Aerospace / Defense | 1 | $18B |
|
||
Price history
+472.1% since first listed5 events — show timeline
- 2026-06-08 Listed $399,900 MLS PIN
- 2002-05-14 Sold (MLS) $65,000 MLS PIN
- 2002-05-10 Sold (Public Records) $65,000 Public Records
- 2001-12-10 Listing Removed — MLS PIN
- 2000-07-06 Listed $69,900 MLS PIN
Property tax history
+2.0%/yrLatest (2023): $2,739 · +12.3% YoY. Source: county tax records.
Cash-flow waterfall
monthlySold comps — $/sqft
last 12 mo · ≤1 miLoading sold comps…